Interesting news this weekend. Apparently everything we’ve done in our entire careers is a “MASSIVE lie” (sic) because all of radiative physics, climate history, the instrumental record, modeling and satellite observations turn out to be based on 12 trees in an obscure part of Siberia. Who knew?
[Read more…] about Hey Ya! (mal)
Search Results for: Hockey Stick
The IPCC Sixth Assessment Report
Climate scientists are inordinately excited by the release of a new IPCC report (truth be told, that’s a bit odd – It’s a bit like bringing your end-of-(seven)-year project home and waiting anxiously to see how well it will be received). So, in an uncharacteristically enthusiastic burst of effort, we have a whole suite of posts on the report for you to read.
- AR6 of the Best. Half a dozen takeaways from the report from Gavin
- New (8/13): Sea Level Rise in AR6 from Stefan
- A Tale of Two Hockey Sticks by Mike
- #NotAllModels discusses the use (and mis-use) of the CMIP6 ensemble by Gavin
- We are not reaching 1.5ºC earlier than previously thought from guest authors Malte Meinshausen, Zebedee Nicholls and Piers Forster
- New (8/12): Deciphering the SPM AR6 WG1 Code by Rasmus
- New (8/12): A deep dive into the IPCC’s updated carbon budget numbers from guest author Joeri Rogelj
If/when we add some more commentary as we digest the details and we see how the report is being discussed, we’ll link it from here. Feel free to discuss general issues with the report in the comments here, and feel free to suggest further deep dives we might pursue.
The Rise and Fall of the “Atlantic Multidecadal Oscillation”
Two decades ago, in an interview with science journalist Richard Kerr for the journal Science, I coined the term the “Atlantic Multidecadal Oscillation” (AMO) to describe an internal oscillation in the climate system resulting from interactions between North Atlantic ocean currents and wind patterns. These interactions were thought to lead to alternating decades-long intervals of warming and cooling centered in the extra-tropical North Atlantic that play out on 40-60 year timescales (hence the name). Think of the purported AMO as a much slower relative of the El Niño/Southern Oscillation (ENSO), with a longer timescale of oscillation (multidecadal rather than interannual) and centered in a different region (the North Atlantic rather than the tropical Pacific).
Today, in a research article published in the same journal Science, my colleagues and I have provided what we consider to be the most definitive evidence yet that the AMO doesn’t actually exist.
[Read more…] about The Rise and Fall of the “Atlantic Multidecadal Oscillation”Denial and Alarmism in the Near-Term Extinction and Collapse Debate
Guest article by Alastair McIntosh, honorary professor in the College of Social Sciences at the University of Glasgow in Scotland. This is an excerpt from his new book, Riders on the Storm: The Climate Crisis and the Survival of Being
 Mostly, we only know what we think we know about climate science because of the climate science. I have had many run-ins with denialists, contrarians or climate change dismissives as they are variously called. Over the past two years especially, concern has also moved to the other end of the spectrum, to alarmism. Both ends, while the latter has been more thinly tapered, can represent forms of denial. In this abridged adaptation I will start with denialism, but round on the more recent friendly fire on science that has emerged in alarmism.
Transparency in climate science
Good thing? Of course.*
Fake news, hacked mail, alternative facts – that’s old hat for climate scientists
Distortion? False information? Conspiracy theories? Hacked email? Climate scientists have known all this for decades. What can be learned from their rich experience with climate propaganda.
The world is slowly waking up. “Post-truth” was declared the word of the year 2016 by the Oxford Dictionaries. Finally, people start to widely appreciate how dangerous the epidemic of fake news is for democracy.
Stir up hate, destroy discourse, make insane claims until no one can distinguish the most bizarre absurdity from the truth any more.
Thus the Austrian author Robert Misik aptly describes the strategy of right-wing populists.
Some call it “alternative facts”. (Those are the convenient alternative to true facts.) Let’s simply call it propaganda. [Read more…] about Fake news, hacked mail, alternative facts – that’s old hat for climate scientists
Non-condensable Cynicism in Santa Fe
Guest Post by Mark Boslough
The Fourth Santa Fe Conference on Global & Regional Climate Change will be held on Feb 5-10, 2017. It is the fourth in a series organized and chaired by Petr Chylek of Los Alamos National Laboratory (LANL) and takes place intervals of 5 years or thereabouts. It is sponsored this year by LANL’s Center for Earth and Space Science and co-sponsored by the American Meteorological Society. I attended the Third in the series, which was held the week of Oct 31, 2011. I reported on it here in my essay “Climate cynicism at the Santa Fe conference”.
In that report, I described my experiences and interactions with other attendees, whose opinions and scientific competence spanned the entire spectrum of possibility. Christopher Monckton represented one extreme end-member, with no scientific credibility, total denial of facts, zero acknowledgment of uncertainty in his position, and complete belief in a global conspiracy to promote a global warming fraud. At the opposite end were respected professional climate scientists at the top of their fields, such as Richard Peltier and Gerald North. Others, such as Fred Singer and Bill Gray, occupied different parts of the multi-dimensional phase space, having credentials but also having embraced denial—each for their own reasons that probably didn’t intersect.
For me, the Third Conference represented an opportunity to talk to people who held contrary opinions and who promoted factually incorrect information for reasons I did not understand. My main motivation for attending was to engage in dialogue with the contrarians and deniers, to try to understand them, and to try to get them to understand me. I came away on good terms with some (Bill Gray and I bonded over our common connection to Colorado State University, where I was an undergraduate physics student in the 1970s) but not so much with others.
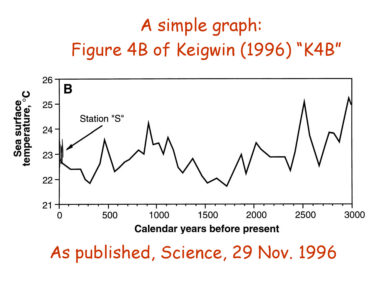
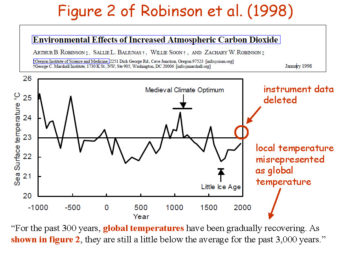
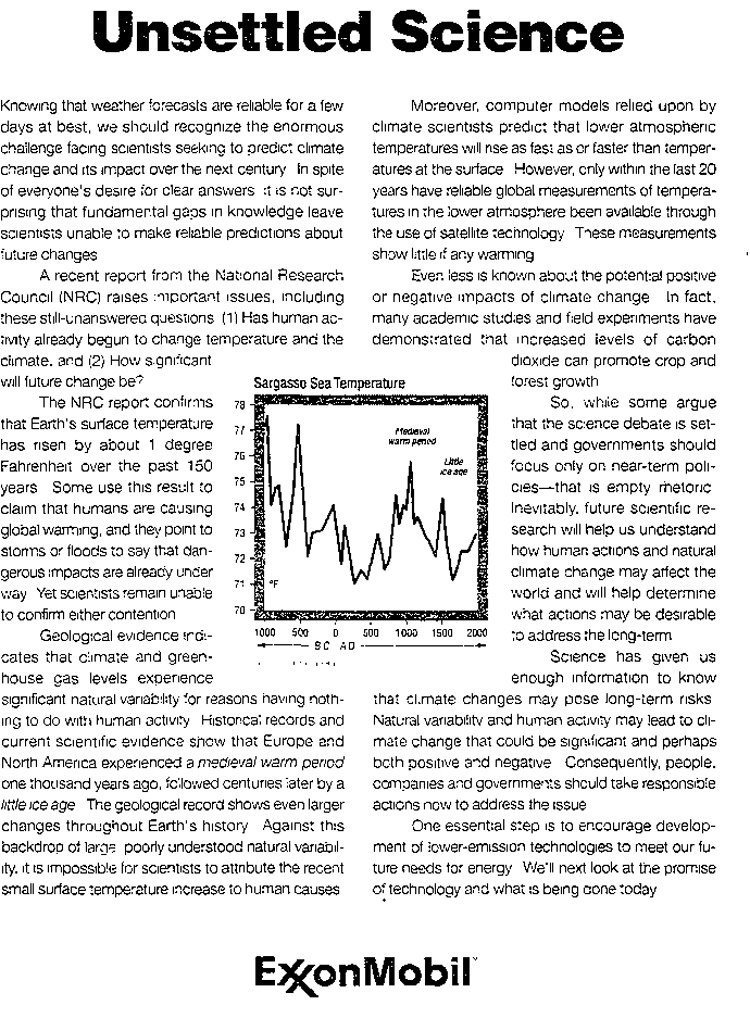
I was ambitious and submitted four abstracts. I and my colleagues were pursuing uncertainty quantification for climate change in collaboration with other DOE labs. I had been collaborating on several approaches to it, including betting markets, expert elicitation, and statistical surrogate models, so I submitted an abstract for each of those methods. I had also been working with Lloyd Keigwin, a senior scientist and oceanographer at Woods Hole Oceanographic Institution and another top-of-his-field researcher. We submitted an abstract together about his paleotemperature reconstruction of Sargasso Sea surface temperature, which is probably the most widely reproduced paleoclimate time series other than the Mann et al. “Hockey Stick” graph. I had updated it with modern SST measurements, and in our abstract we pointed out that it had been misused by contrarians who had removed some of the data, replotted it, and mislabeled it to falsely claim that it was a global temperature record showing a cooling trend. The graph continues to make appearances. On March 23, 2000, ExxonMobil took out an advertisement in the New York Times claiming that global warming was “Unsettled Science”. The ad was illustrated with a doctored version of Lloyd’s graph (the inconvenient modern temperature data showing a warming trend had been removed). This drawing was very similar to one that had been generated by climate denier Art Robinson and his son for a Wall Street Journal editorial a couple months earlier. It wasn’t long before other distorted versions started showing up elsewhere, such as the Albuquerque Journal opinion page. The 2000 ExxonMobil version was just entered into the Congressional Record last week by Senator Tim Kaine during the Tillerson confirmation hearings.
In 2011, my abstracts on betting, expert elicitation, and statistical models were all accepted, and I presented them. But the abstract that Lloyd and I submitted was unilaterally rejected by Chylek who said, “This Conference is not a suitable forum for [the] type of presentations described in [the] submitted abstract. We would accept a paper that spoke to the science, the measurements, the interpretation, but not simply an attempted refutation of someone else’s assertions (especially when made in unpublished reports and blog site).” The unpublished report he spoke of was the NIPCC/Heartland Institute report, which Fred Singer was there to discuss. After the conference, I spoke to one of the co-chairs about the reasons for the rejection. He said that he hadn’t seen it and did not agree with the reasons for the rejection. He encouraged Lloyd and me to re-submit it again for the 4th conference. So we did. Lloyd sent the following slightly-revised version on January 4.
Misrepresentations of Sargasso Sea Temperatures by Global Warming Doubters
Lloyd Keigwin (Woods Hole Oceanographic Institution) and Mark Boslough (Sandia National Laboratories)
Keigwin (Science 274:1504–1508, 1996) reconstructed the SST record in the northern Sargasso Sea to document natural climate variability in recent millennia. The annual average SST proxy used δ18O in planktonic foraminifera in a radiocarbon-dated 1990 Bermuda Rise box core. Keigwin’s Fig. 4B (K4B) shows a 50-year-averaged time series along with four decades of SST measurements from Station S near Bermuda, demonstrating that at the time of publication, the Sargasso Sea was at its warmest in more than 400 years, and well above the most recent box-core temperature. Taken together, Station S and paleotemperatures suggest there was an acceleration of warming in the 20th century, though this was not an explicit conclusion of the paper. Keigwin concluded that anthropogenic warming may be superposed on a natural warming trend.
In a paper circulated with the anti-Kyoto “Oregon Petition,” Robinson et al. (“Environmental Effects of Increased Atmospheric Carbon Dioxide,” 1998) reproduced K4B but (1) omitted Station S data, (2) incorrectly stated that the time series ended in 1975, (3) conflated Sargasso Sea data with global temperature, and (4) falsely claimed that Keigwin showed global temperatures “are still a little below the average for the past 3,000 years.” Slight variations of Robinson et al. (1998) have been repeatedly published with different author rotations. Various mislabeled, improperly-drawn, and distorted versions of K4B have appeared in the Wall Street Journal, in weblogs, and even as an editorial cartoon—all supporting baseless claims that current temperatures are lower than the long term mean, and traceable to Robinson’s misrepresentation with Station S data removed. In 2007, Robinson added a fictitious 2006 temperature that is significantly lower than the measured data. This doctored version of K4B with fabricated data was reprinted in a 2008 Heartland Institute advocacy report, “Nature, Not Human Activity, Rules the Climate.”
On Jan. 9, Lloyd and I got a terse rejection from Chylek: “Not accepted. The committee finding was that the abstract did not indicate that the presentation would provide additional science that would be appropriate for the conference.”
I had also submitted an abstract with Stephen Lewandowsky and James Risbey called “Bets reveal people’s opinions on climate change and illustrate the statistics of climate change,” and a companion poster entitled “Forty years of expert opinion on global warming: 1977-2017” in which we proposed to survey the conference attendees:
Forecasts of anthropogenic global warming in the 1970s (e.g. Broecker, 1975, Charney et al., 1979) were taken seriously by policy makers. At that time, climate change was already broadly recognized within the US defense and intelligence establishments as a threat to national and global security, particularly due to climate’s effect on food production. There was uncertainty about the degree of global warming, and media-hyped speculation about global cooling confused the public. Because science-informed policy decisions needed to be made in the face of this uncertainty, the US Department of Defense funded a study in 1977 by National Defense University (NDU) called “Climate Change to the Year 2000” in which a panel of experts was surveyed. Contrary to the recent mythology of a global cooling scare in the 1970s, the NDU report (published in 1978) concluded that, “Collectively, the respondents tended to anticipate a slight global warming rather than a cooling”.
Despite the rapid global warming since 1977, this subject remains politically contentious. We propose to use our poster presentation to survey the attendees of the Fourth Santa Fe Conference on Global and Regional Climate Change and to determine how expert opinion has changed in the last 40 years.
I had attempted a similar project at the 3rd conference with my poster “Comparison of Climate Forecasts: Expert Opinions vs. Prediction Markets” in which my abstract proposed the following: “As an experiment, we will ask participants to go on the record with estimates of probability that the global temperature anomaly for calendar year 2012 will be equal to or greater than x, where x ranges in increments of 0.05 °C from 0.30 to 1.10 °C (relative to the 1951-1980 base period, and published by NASA GISS).” I included a table for participants to fill in, and even printed extra sheets to tack up on the board with my poster so I could compile them and report them later.
This idea was a spinoff of work I had presented at an unclassified session of the 2006 International Conference on Intelligence Analysis on my research in support of the US intelligence community for which a broad spectrum of opinion must be used to generate an actionable consensus with incomplete or conflicting information. That was certainly the case in Santa Fe, where there were individuals (e.g. Don Easterbrook) who were going on record with predictions of global cooling. By the last day of the conference, several individuals had filled in the table with their probabilistic predictions and I decided to leave my poster up until the end of the day, which was how long they could be displayed according to the conference program. I wanted to plug it during my oral presentation on prediction markets so that I could get more participation. Unfortunately when I returned to the display room, my poster had been removed. Hotel employees did not know where it was, and the diverse probability estimates were lost.
This year I would be more careful, as announced in my abstract. But the committee would have no part of it. On Jan 10 I got my rejection letter:
I regret to inform you that we have decided to decline this submission.
Based on our consideration of the abstract and plan, it is our view that designing a survey that accurately elicits expert opinion requires special expertise as the answers can depend on how the questions are asked. No indication of such expertise was presented in the abstract itself or found based on examination of your publication record.
A further concern dealt with the proposed comparison with opinion elicited at a different time from a different community by a different method that might allow one to “determine how expert opinion has changed in the last 40 years.”
Concern was raised also over how one might legitimately transform the results of such a poll into “into probabilistic global warming projections.”
Although we cannot accept this poster, we certainly look forward to your active participation in the Conference.
Of the hundreds of abstracts I’ve submitted, this is the only conference that’s ever rejected one. As a frequent session convener and program committee chair myself, I am accustomed to providing poster space for abstracts that I might question, misunderstand, or disagree with. It has never occurred to me to look at the publication list of a poster presenter, But if I were to do that, I would be more thorough and look other information, including their coauthors’ publication lists and CVs as well. In this case, the committee might have discovered more than a few papers by one of them on the subject, such as Risbey and Kandlikar (2002) “Expert Assessment of Uncertainties in Detection and Attribution of Climate Change” in the Bulletin of the American Meteorological Society, or that Prof. Risbey was a faculty member in Granger Morgan’s Engineering and Public Policy department at CMU for five years, a place awash in expert elicitation of climate (I sent my abstract to Prof. Morgan–who I know from my AGU uncertainty quantification days–for his opinion before submitting it to the conference).
At the very least, I would look at the previous work cited in the abstract. The committee would not have been puzzled by how to transform survey data into probabilistic projections if they had done so. They would have learned that the 1978 NDU study we cited had already established the methodology we were proposing to use. The NDU “Task I” was “To define and estimate the likelihood of changes in climate during the next 25 years…” using ten survey questions described in Chapter One (Methodology). The first survey question was on average global temperature. So the legitimacy of the method we were planning to use was established 40 years ago.
I concluded after the 3rd Santa Fe conference that cynicism was the only attribute that was shared by the minority of attendees who were deniers, contrarians, publicity-seekers, enablers, or provocateurs. I now think that cynicism has something in common with greenhouse gases. Cynicism begets cynicism, to the detriment of society. There are natural-born cynics, and if they turn the rest of us into cynics then we are their amplifiers, just like water vapor is an amplifier of carbon dioxide’s greenhouse effect. We become part of a cynical feedback loop that generates distrust in science and the scientific method. I refuse to let that happen. I might have gotten a little steamed by an unfair or inappropriate rejection, but I’ve cooled off and my induced cynicism has condensed now. I am not going to assume that everyone is a cynic just because of a couple of misguided and misinformed decisions.
As President Obama said in his farewell address, “If you’re tired of arguing with strangers on the Internet, try talking with one of them in real life.” So if you are attending the Santa Fe conference, I would like to meet with you. If you are flying into Albuquerque, where I live, drop me a line. Or meet me for a drink or dinner in Santa Fe. I can show you why Lloyd’s research really does provide additional science that is relevant to the conference. I can try to convince you that prediction markets are indeed superior to expert elicitation in their ability to forecast climate change. Maybe I can even talk you into going on record with your own probabilistic global warming forecast!
Climate Oscillations and the Global Warming Faux Pause
No, climate change is not experiencing a hiatus. No, there is not currently a “pause” in global warming.
Despite widespread such claims in contrarian circles, human-caused warming of the globe proceeds unabated. Indeed, the most recent year (2014) was likely the warmest year on record.
It is true that Earth’s surface warmed a bit less than models predicted it to over the past decade-and-a-half or so. This doesn’t mean that the models are flawed. Instead, it points to a discrepancy that likely arose from a combination of three main factors (see the discussion my piece last year in Scientific American). These factors include the likely underestimation of the actual warming that has occurred, due to gaps in the observational data. Secondly, scientists have failed to include in model simulations some natural factors (low-level but persistent volcanic eruptions and a small dip in solar output) that had a slight cooling influence on Earth’s climate. Finally, there is the possibility that internal, natural oscillations in temperature may have masked some surface warming in recent decades, much as an outbreak of Arctic air can mask the seasonal warming of spring during a late season cold snap. One could call it a global warming “speed bump”. In fact, I have.
Some have argued that these oscillations contributed substantially to the warming of the globe in recent decades. In an article my colleagues Byron Steinman, Sonya Miller and I have in the latest issue of Science magazine, we show that internal climate variability instead partially offset global warming.
We focused on the Northern Hemisphere and the role played by two climate oscillations known as the Atlantic Multidecadal Oscillation or “AMO” (a term I coined back in 2000, as recounted in my book The Hockey Stick and the Climate Wars) and the so-called Pacific Decadal Oscillation or “PDO” (we a use a slightly different term–Pacific Multidecadal Oscillation or “PMO” to refer to the longer-term features of this apparent oscillation). The oscillation in Northern Hemisphere average temperatures (which we term the Northern Hemisphere Multidecadal Oscillation or “NMO”) is found to result from a combination of the AMO and PMO.
In numerous previous studies, these oscillations have been linked to everything from global warming, to drought in the Sahel region of Africa, to increased Atlantic hurricane activity. In our article, we show that the methods used in most if not all of these previous studies have been flawed. They fail to give the correct answer when applied to a situation (a climate model simulation) where the true answer is known.
We propose and test an alternative method for identifying these oscillations, which makes use of the climate simulations used in the most recent IPCC report (the so-called “CMIP5” simulations). These simulations are used to estimate the component of temperature changes due to increasing greenhouse gas concentrations and other human impacts plus the effects of volcanic eruptions and observed changes in solar output. When all those influences are removed, the only thing remaining should be internal oscillations. We show that our method gives the correct answer when tested with climate model simulations.
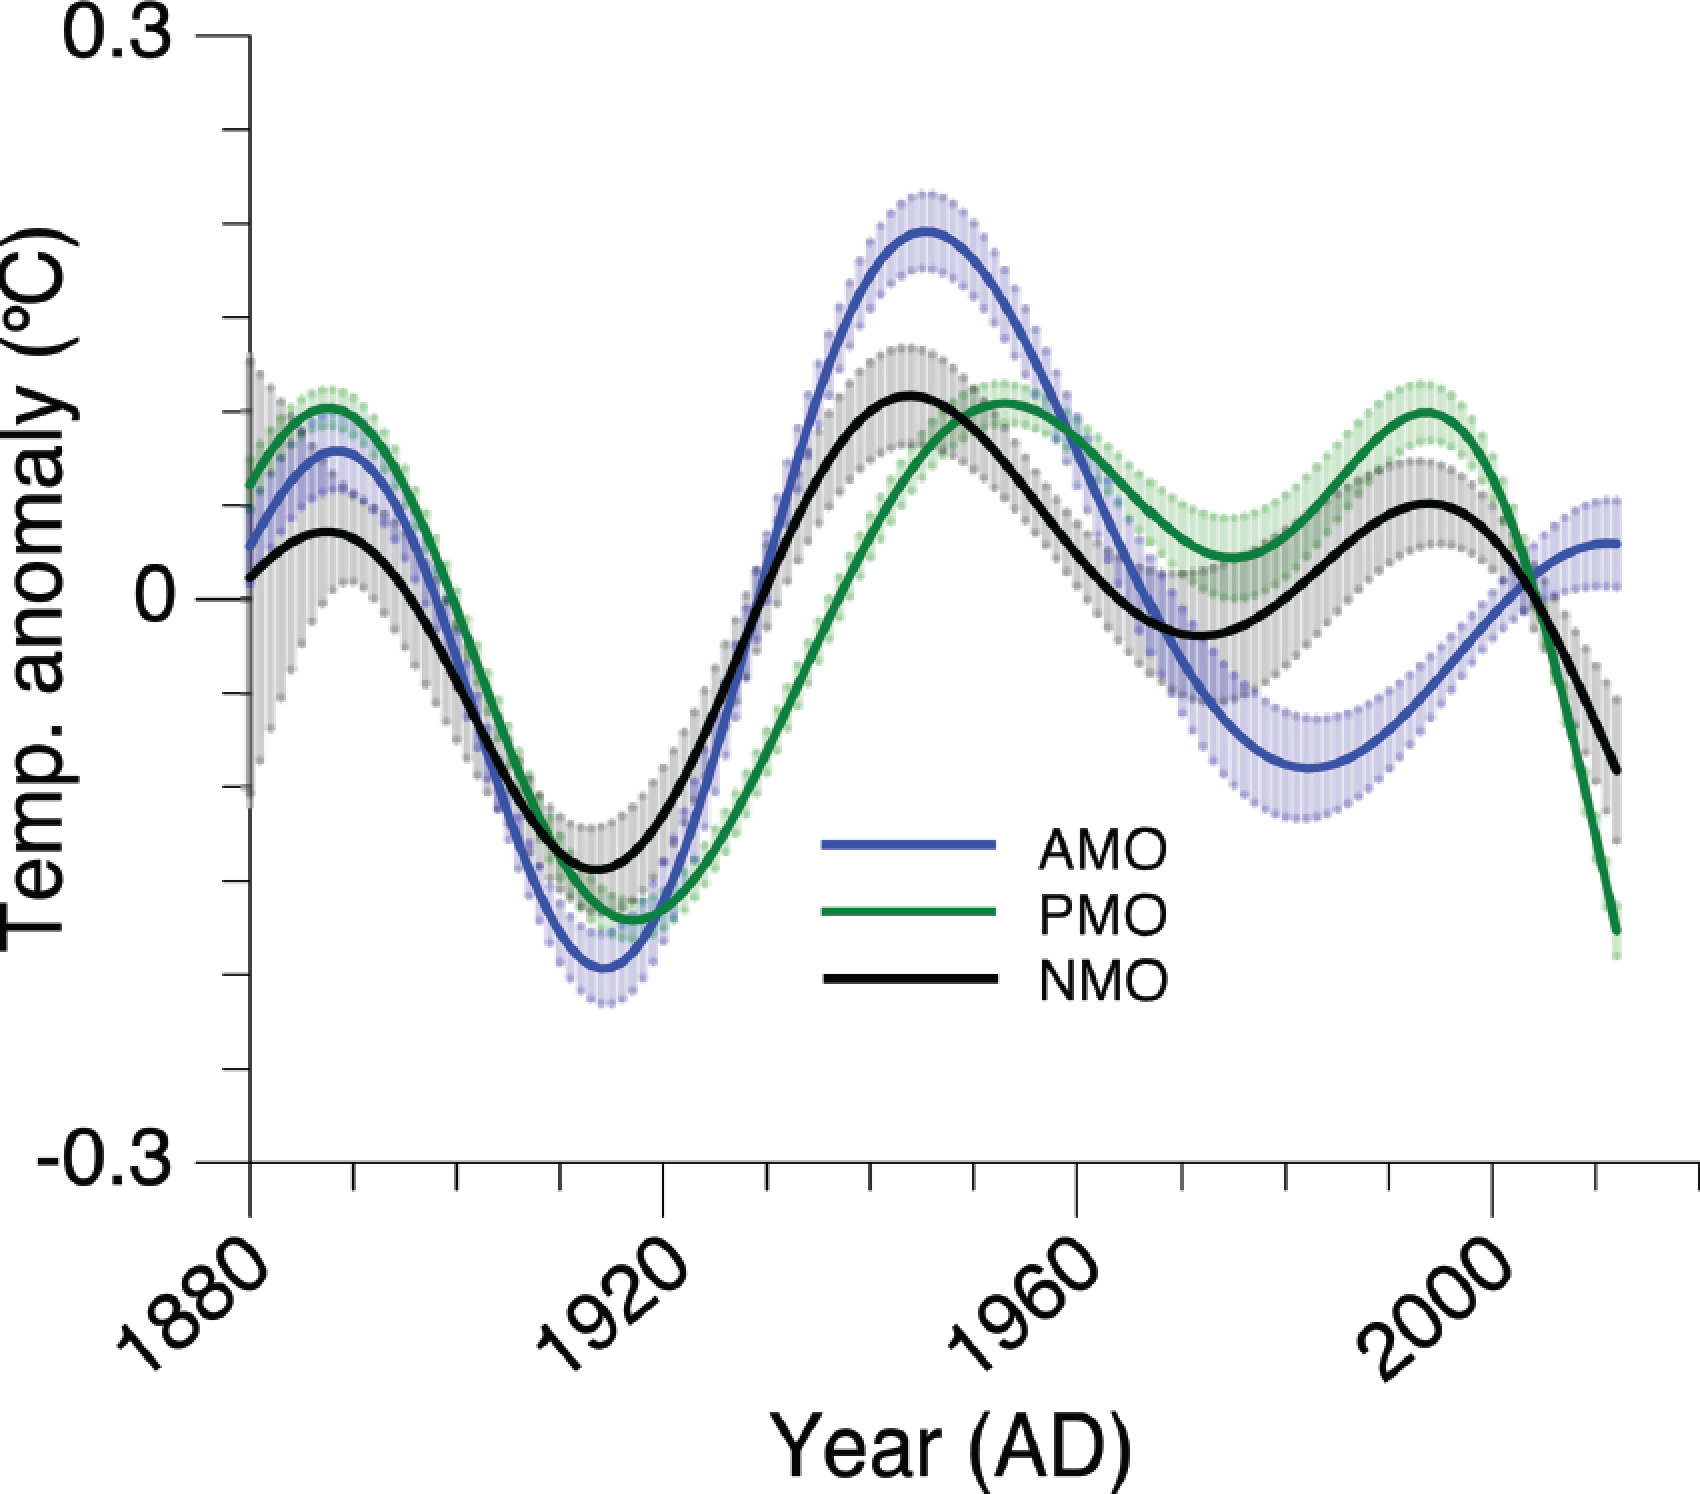
Estimated history of the “AMO” (blue), the “PMO (green) and the “NMO” (black). Uncertainties are indicated by shading. Note how the AMO (blue) has reached a shallow peak recently, while the PMO is plummeting quite dramatically. The latter accounts for the precipitous recent drop in the NMO.
Applying our method to the actual climate observations (see figure above) we find that the NMO is currently trending downward. In other words, the internal oscillatory component is currently offsetting some of the Northern Hemisphere warming that we would otherwise be experiencing. This finding expands upon our previous work coming to a similar conclusion, but in the current study we better pinpoint the source of the downturn. The much-vaunted AMO appears to have made relatively little contribution to large-scale temperature changes over the past couple decades. Its amplitude has been small, and it is currently relatively flat, approaching the crest of a very shallow upward peak. That contrasts with the PMO, which is trending sharply downward. It is that decline in the PMO (which is tied to the predominance of cold La Niña-like conditions in the tropical Pacific over the past decade) that appears responsible for the declining NMO, i.e. the slowdown in warming or “faux pause” as some have termed it.
Our conclusion that natural cooling in the Pacific is a principal contributor to the recent slowdown in large-scale warming is consistent with some other recent studies, including a study I commented on previously showing that stronger-than-normal winds in the tropical Pacific during the past decade have lead to increased upwelling of cold deep water in the eastern equatorial Pacific. Other work by Kevin Trenberth and John Fasullo of the National Center for Atmospheric Research (NCAR) shows that the there has been increased sub-surface heat burial in the Pacific ocean over this time frame, while yet another study by James Risbey and colleagues demonstrates that model simulations that most closely follow the observed sequence of El Niño and La Niña events over the past decade tend to reproduce the warming slowdown.
It is possible that the downturn in the PMO itself reflects a “dynamical response” of the climate to global warming. Indeed, I have suggested this possibility before. But the state-of-the-art climate model simulations analyzed in our current study suggest that this phenomenon is a manifestation of purely random, internal oscillations in the climate system.
This finding has potential ramifications for the climate changes we will see in the decades ahead. As we note in the last line of our article,
Given the pattern of past historical variation, this trend will likely reverse with internal variability, instead adding to anthropogenic warming in the coming decades.
That is perhaps the most worrying implication of our study, for it implies that the “false pause” may simply have been a cause for false complacency, when it comes to averting dangerous climate change.
Paleoclimate: The End of the Holocene
 )
) Recently a group of researchers from Harvard and Oregon State University has published the first global temperature reconstruction for the last 11,000 years – that’s the whole Holocene (Marcott et al. 2013). The results are striking and worthy of further discussion, after the authors have already commented on their results in this blog.
El Nino’s effect on CO2 causes confusion about CO2’s role for climate change
Are the rising atmospheric CO2-levels a result of oceans warming up? And does that mean that CO2 has little role in the global warming? Moreover, are the rising levels of CO2 at all related to human activity?
These are claims made in a fresh publication by Humlum et al. (2012). However, when seeing them in the context of their analysis, they seem to be on par with the misguided notion that the rain from clouds cannot come from the oceans because the clouds are intermittent and highly variable whereas the oceans are just there all the time. I think that the analysis presented in Humlum et al. (2012) is weak on four important accounts: the analysis, the physics, reviewing past literature, and logic.
[Read more…] about El Nino’s effect on CO2 causes confusion about CO2’s role for climate change
References
- O. Humlum, K. Stordahl, and J. Solheim, "The phase relation between atmospheric carbon dioxide and global temperature", Global and Planetary Change, vol. 100, pp. 51-69, 2013. http://dx.doi.org/10.1016/j.gloplacha.2012.08.008