• Skip to primary navigation
  • Skip to main content
  • Skip to primary sidebar
  • Skip to footer

RealClimate

Climate science from climate scientists...

  • Start here
  • Model-Observation Comparisons
  • Miscellaneous Climate Graphics
  • Surface temperature graphics
You are here: Home / Miscellaneous Climate Graphics

Miscellaneous Climate Graphics

This page is a repository of somewhat eclectic climate graphics that I’ve made that were usually designed to provide some context or a debunking of a specific point that might come up a lot. As with all our graphics, these can be used anywhere as long as credit is given and there is link back to here.

Carbon dioxide

How important is carbon dioxide in for the greenhouse effect?

How much of the current level of CO2 in the atmosphere is due to human emission? (over one third!)

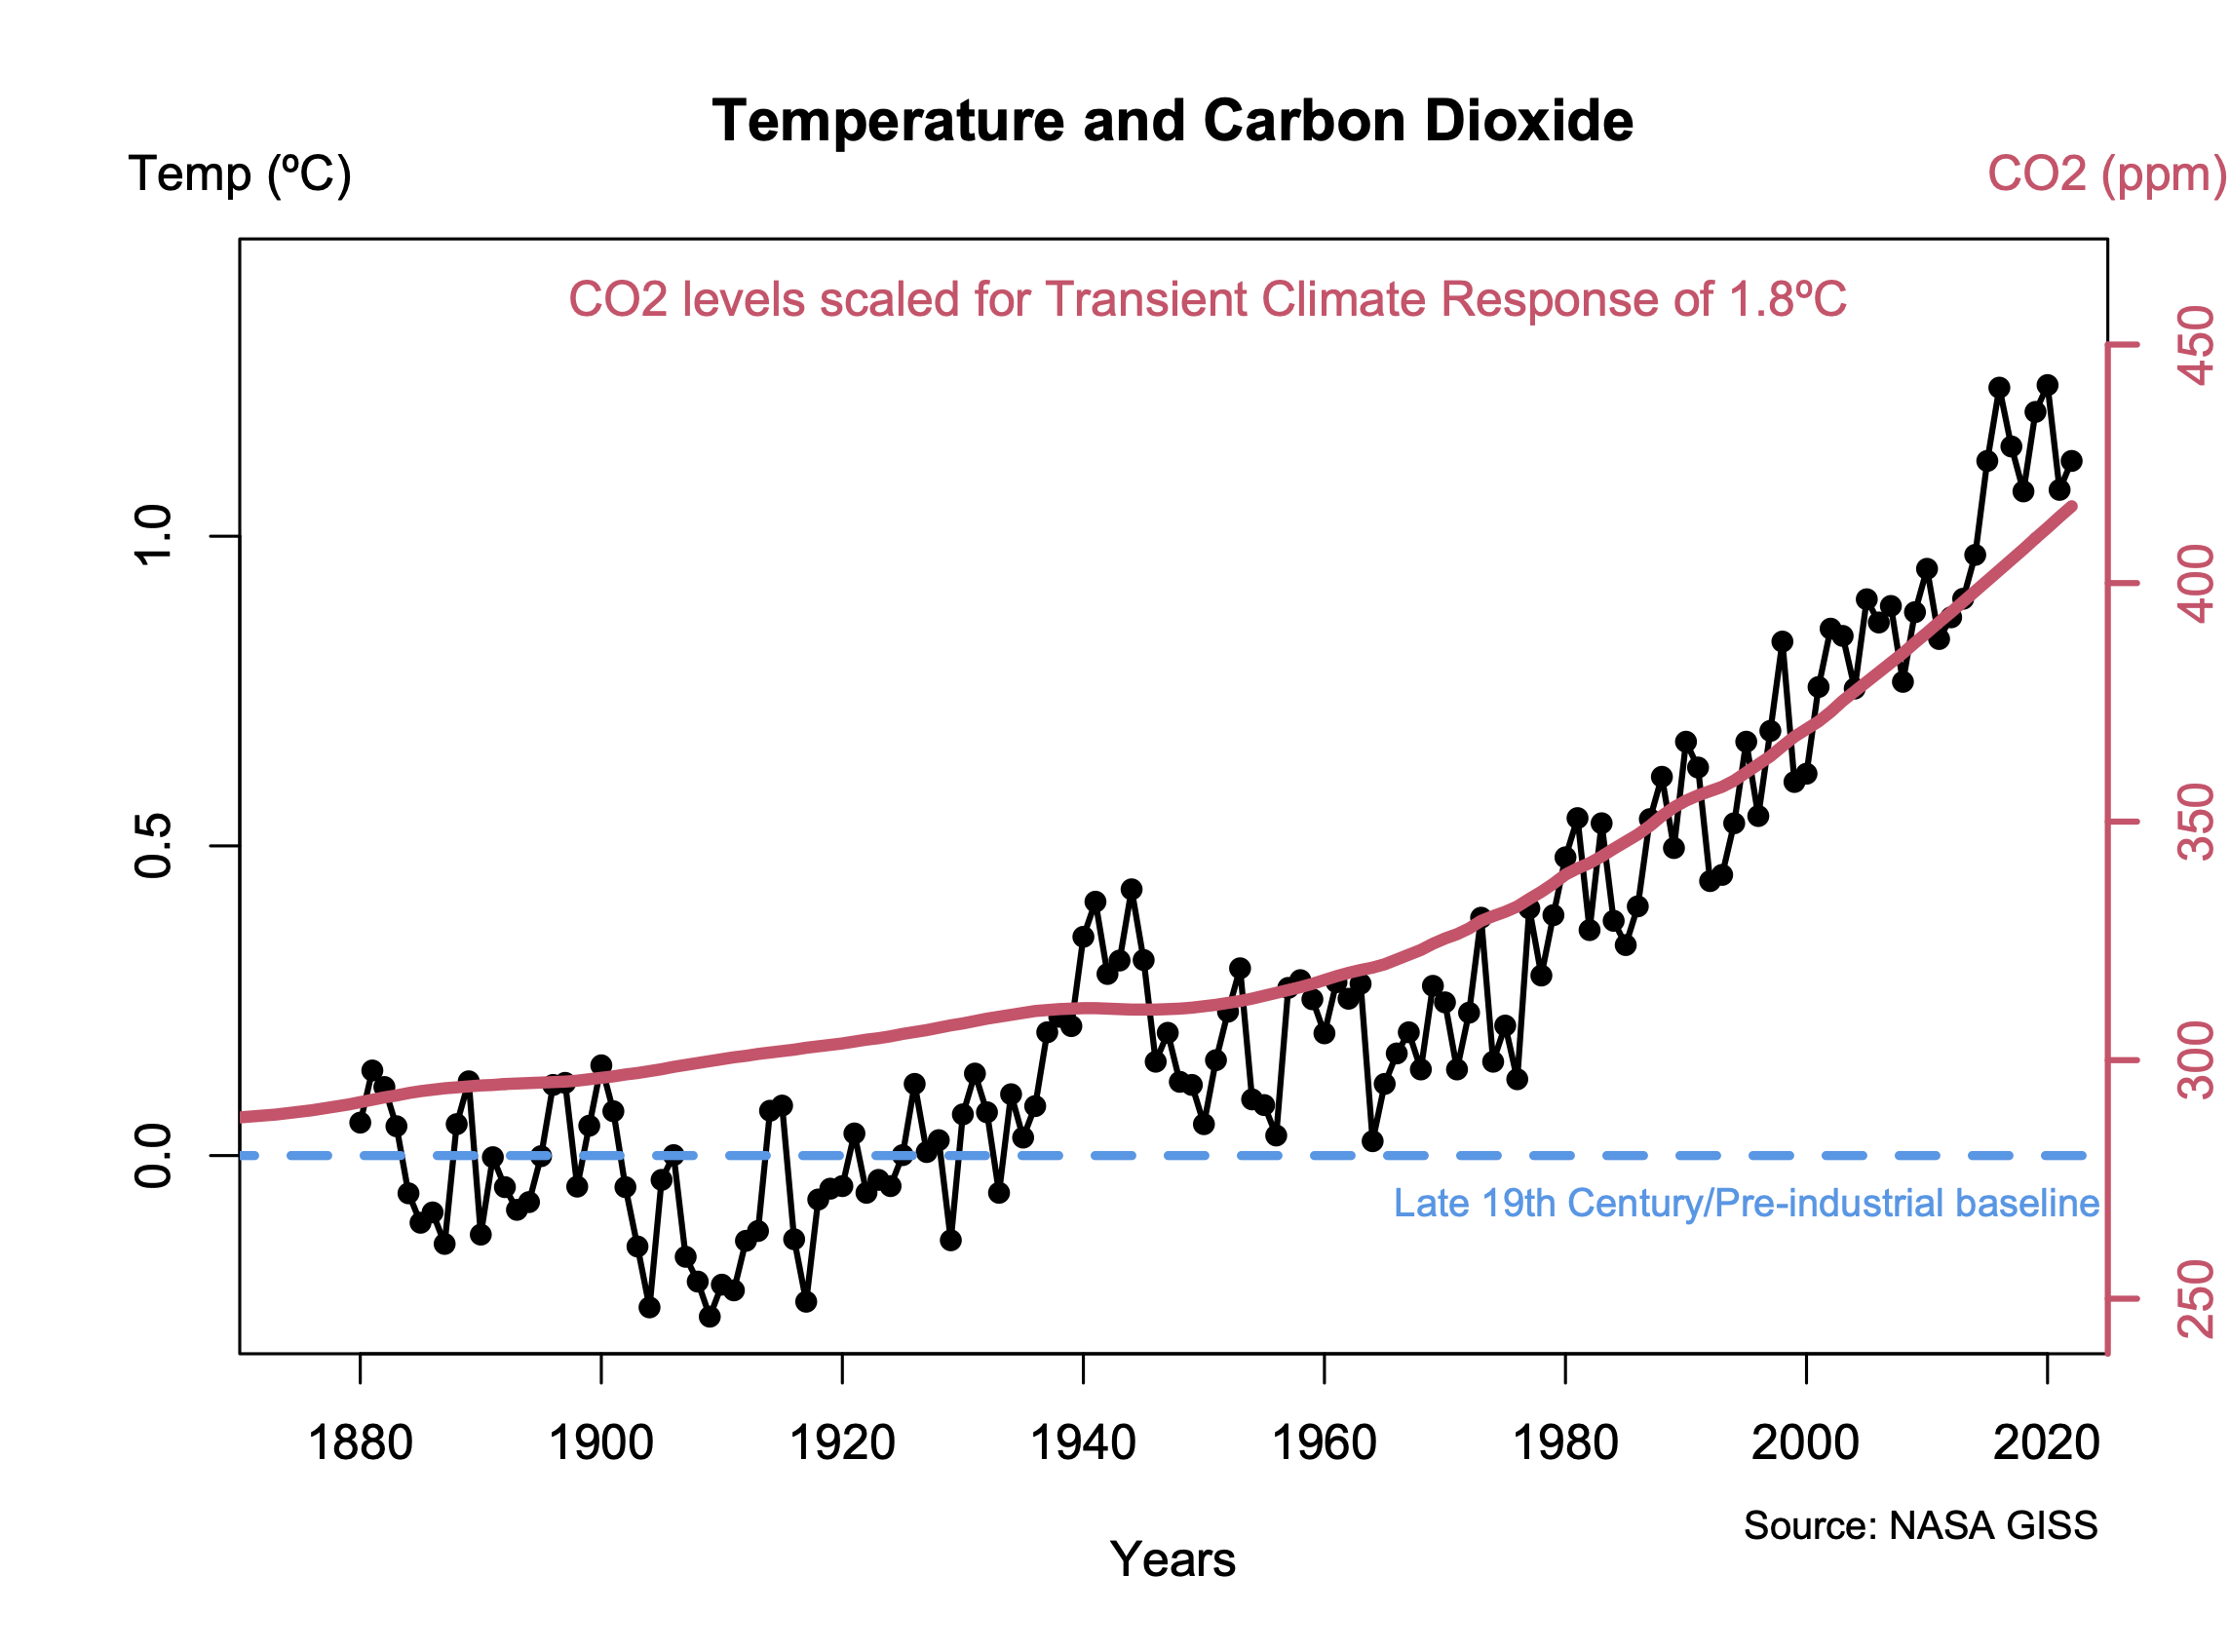
Temperature and carbon dioxide

Figures are often made purporting to compare CO2 concentration changes with temperatures, but with scales that are often implicitly chosen to mislead. This graph scales the CO2 and temperature changes assuming a transient climate sensitivity of around 1.8ºC. For reference the implied TCR in figures like this can be calculated using the formula = 290 $\Delta$ T/$\Delta CO_2
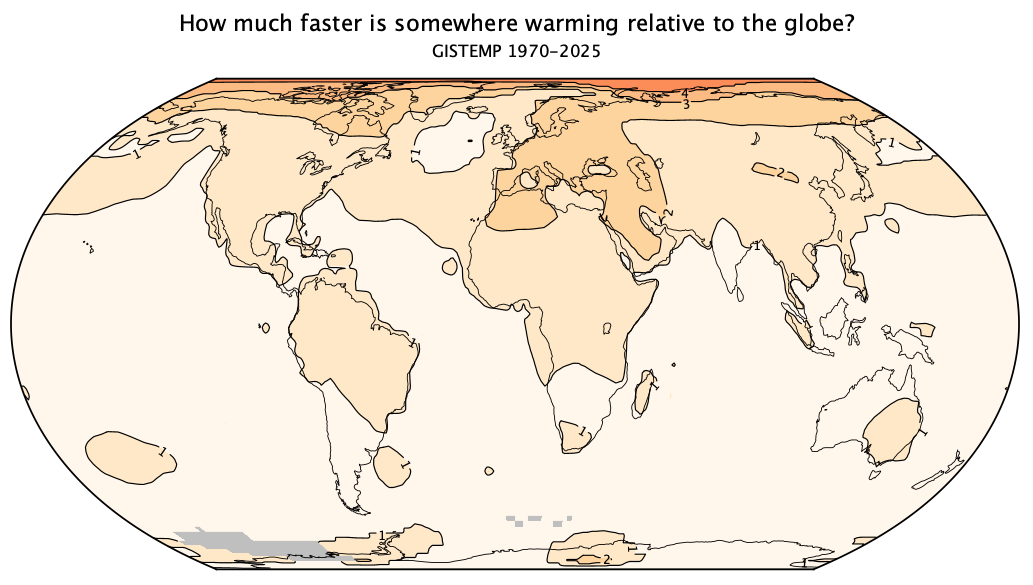
.

Warming faster than the global mean…

Land temperatures are warming faster than the ocean temperatures, and since the ocean is 70% of the globe, land temperatures are generally warming faster than the global mean. This map shows all the points where GISTEMP trends from 1970-2024 are larger than the global mean trend (0.20ºC/dec, last updated 1/21/2025).

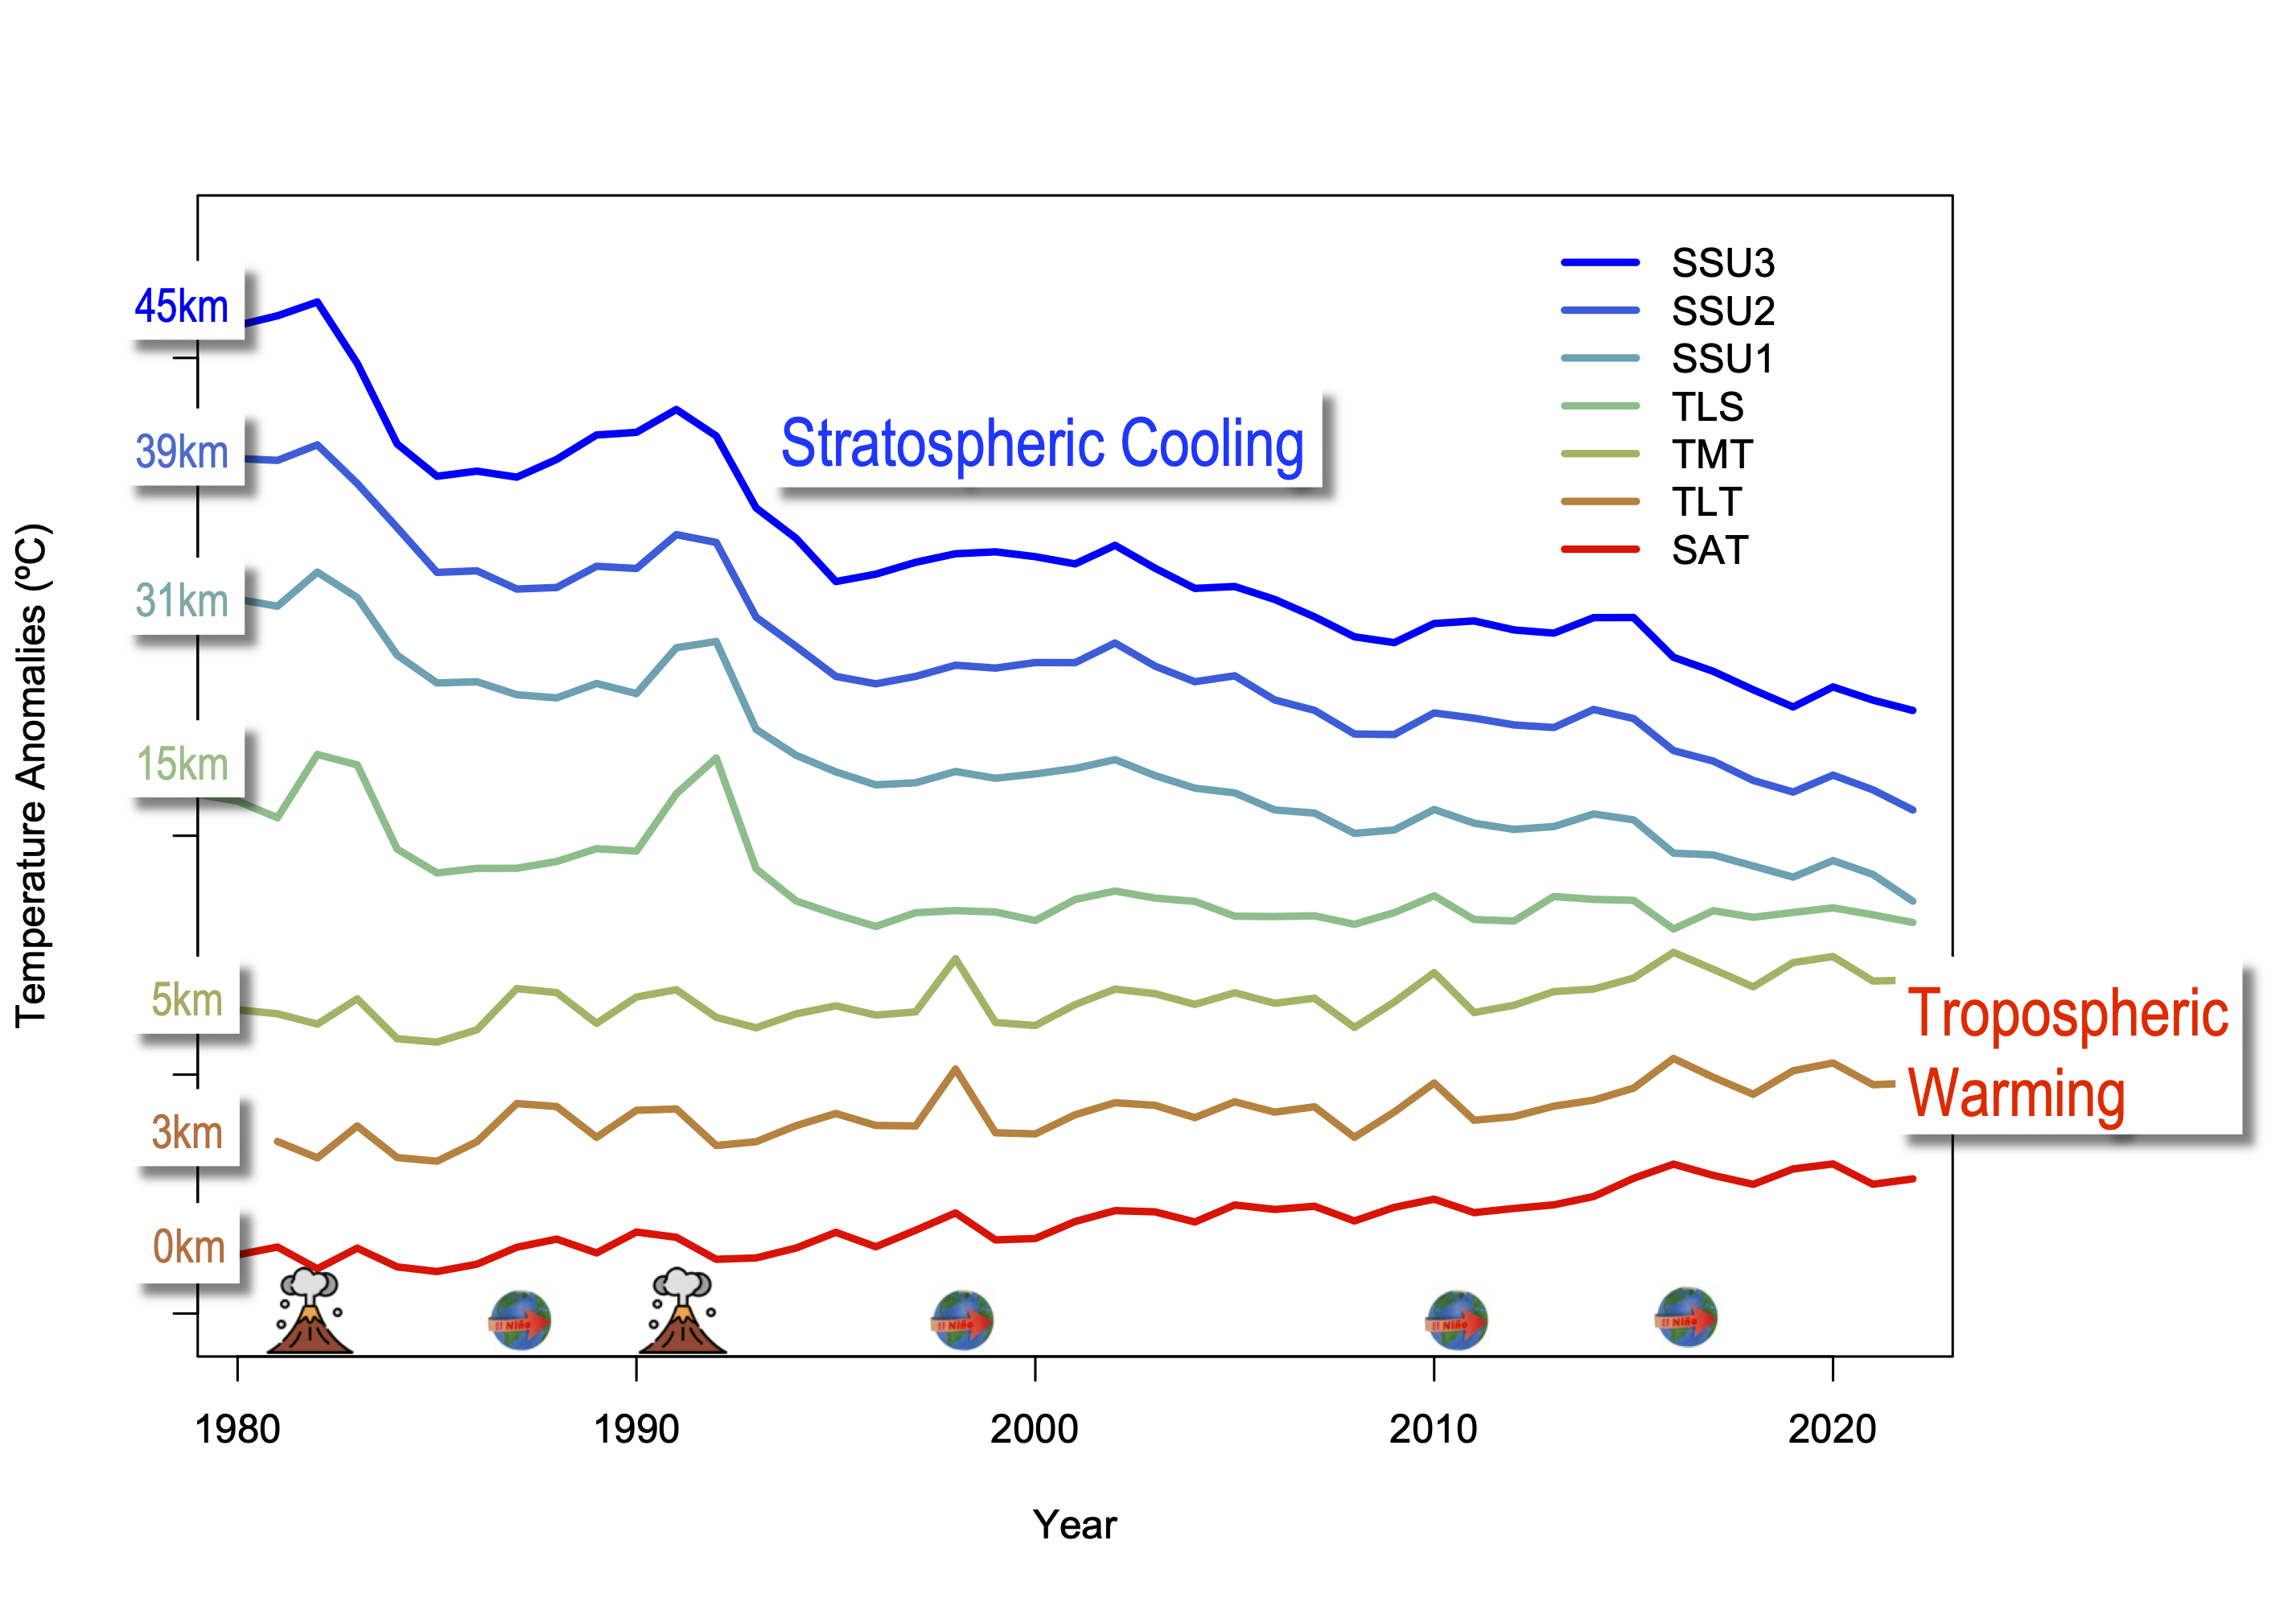
Stratospheric cooling, tropospheric warming.

Satellite retrievals of atmospheric temperature trends are available from the upper stratosphere to the lower troposphere from the SSU, MSU and AMSU instruments on multiple NOAA satellites since 1979. As predicted by Manabe and Weatherald in 1967, the stratosphere has been cooling and the troposphere has been warming, mostly as a function of CO2. (Related discussion, last updated 2/2023).

River Ice Break Up dates

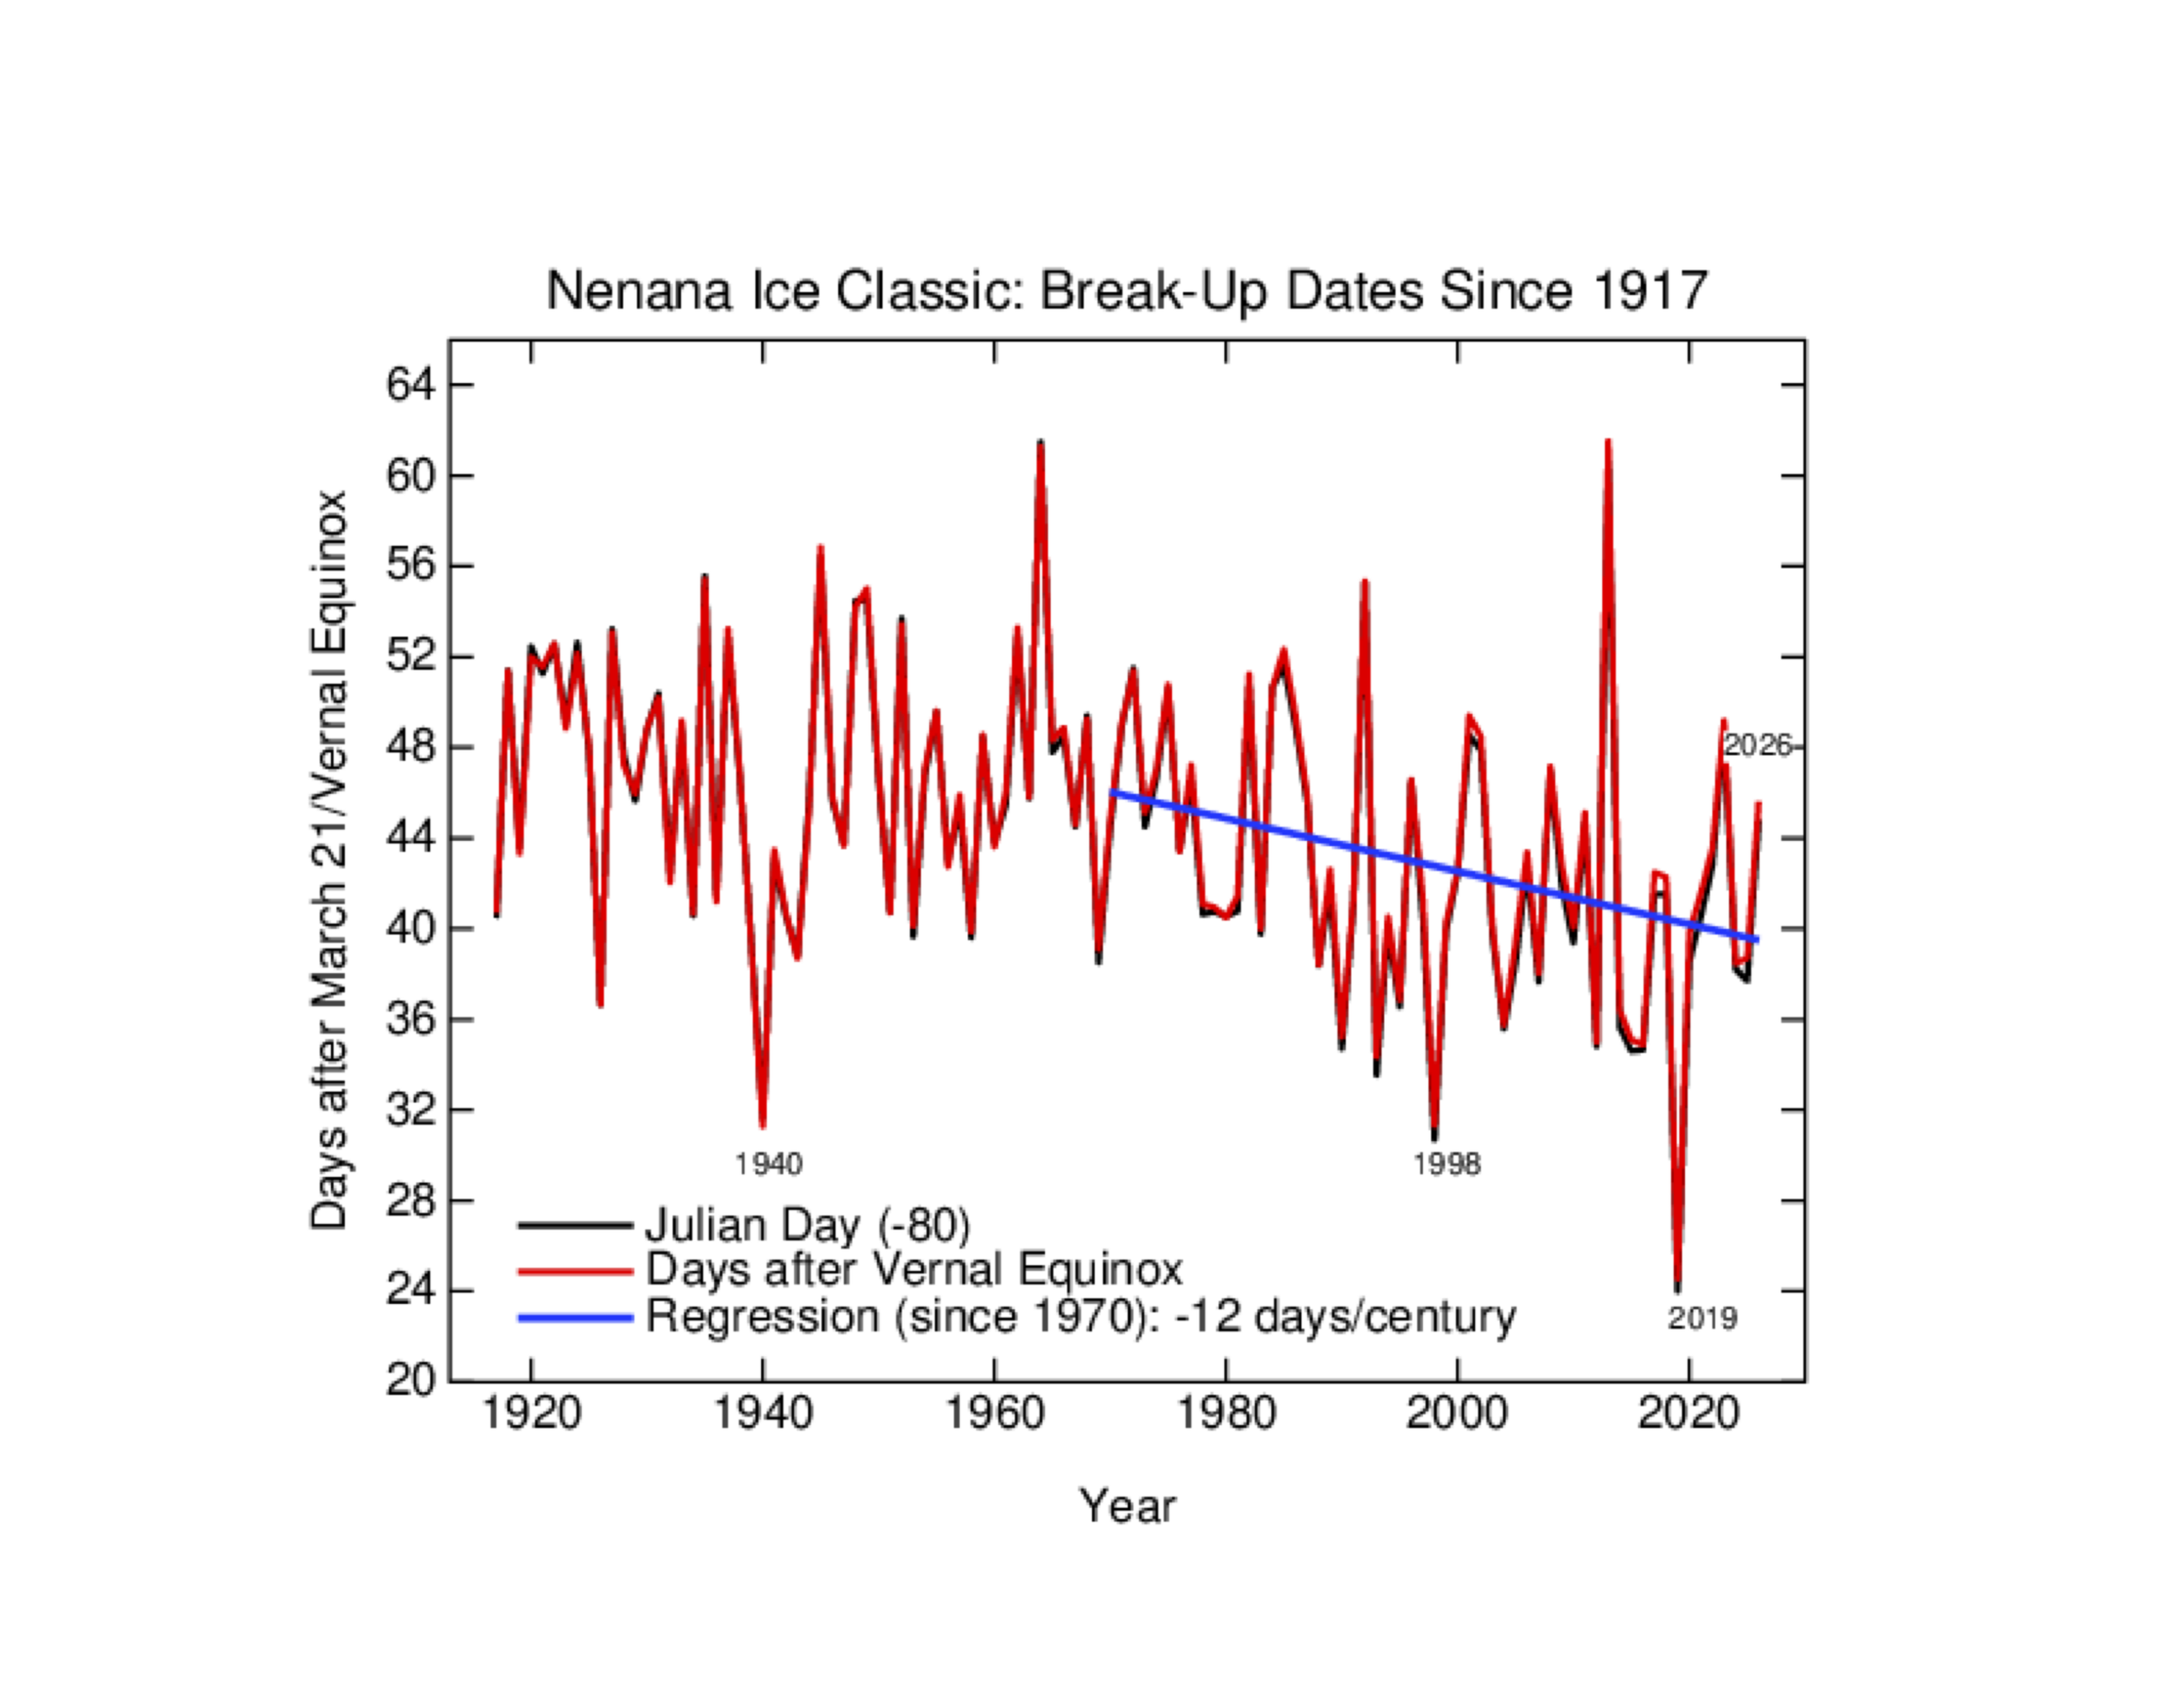
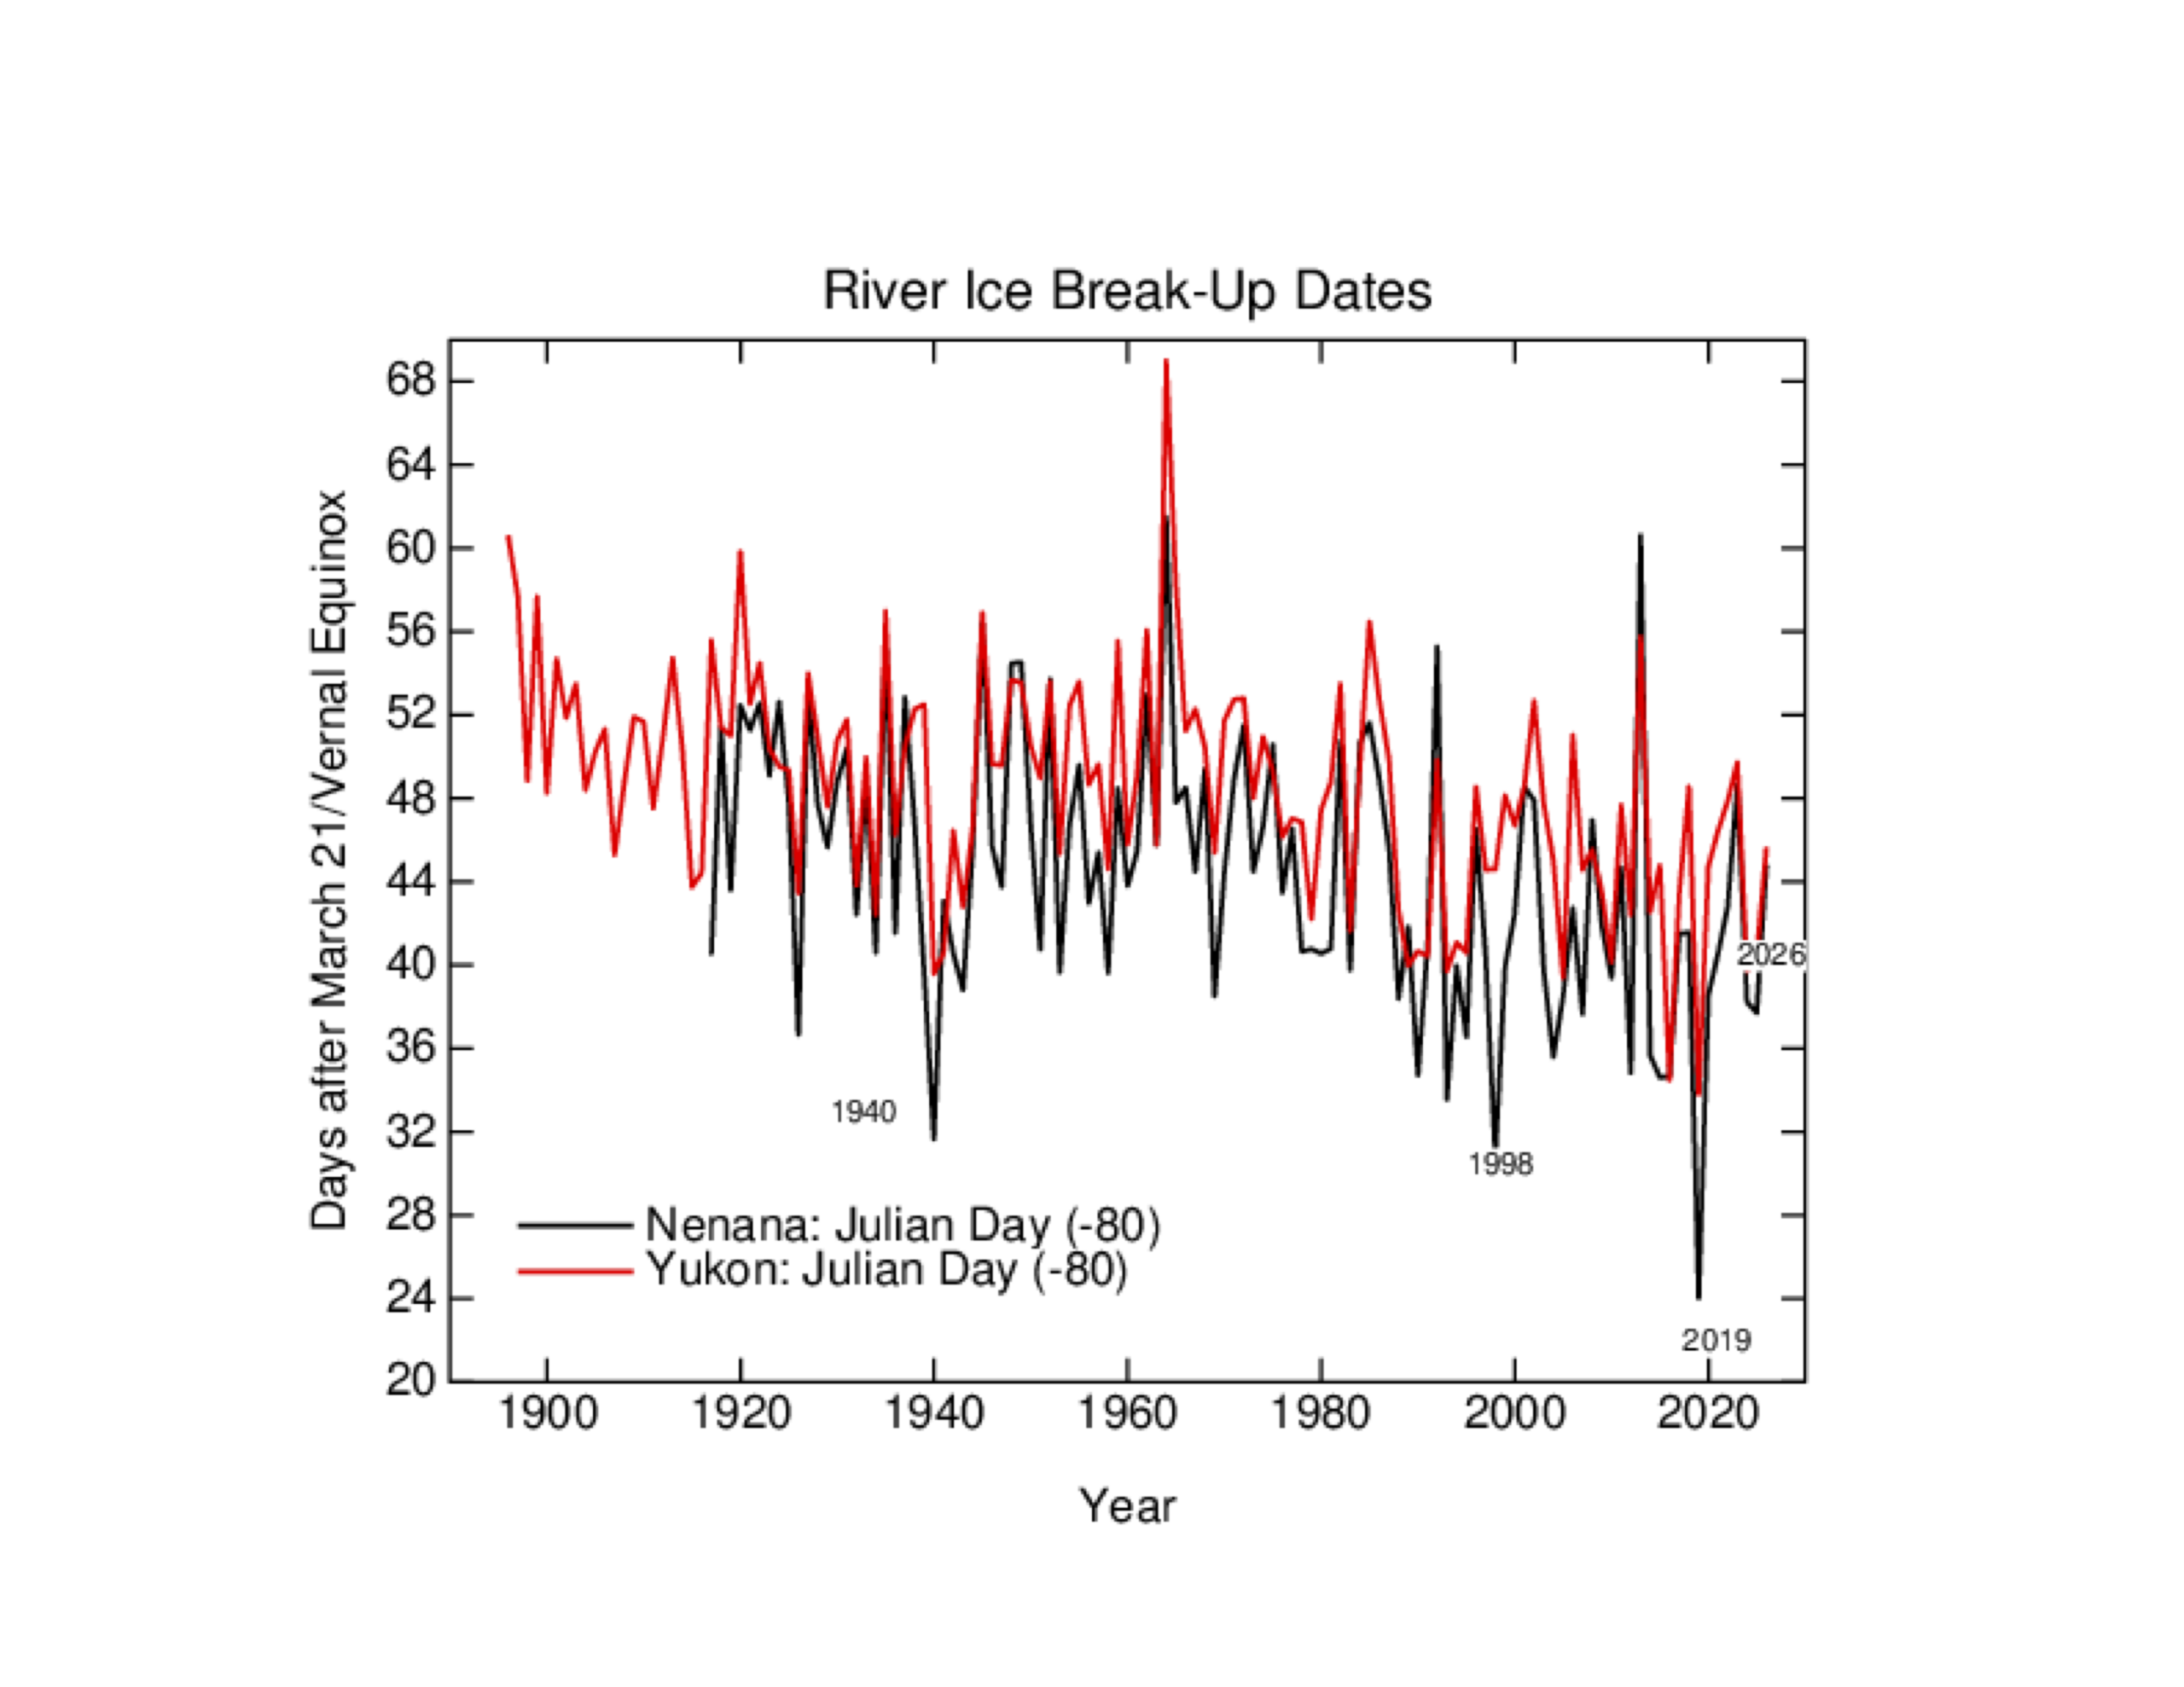
Phenological records are an important adjunct to the instrumental records, and the river ice break up dates from the Nenana Ice Classic (AK), and at the Yukon river at Dawson (YT) go back more than a century. We have tracked this on an annual basis for a decade or so, but it’s probably easier to maintain them here for reference. (Last discussion, updated 5/1/2025).

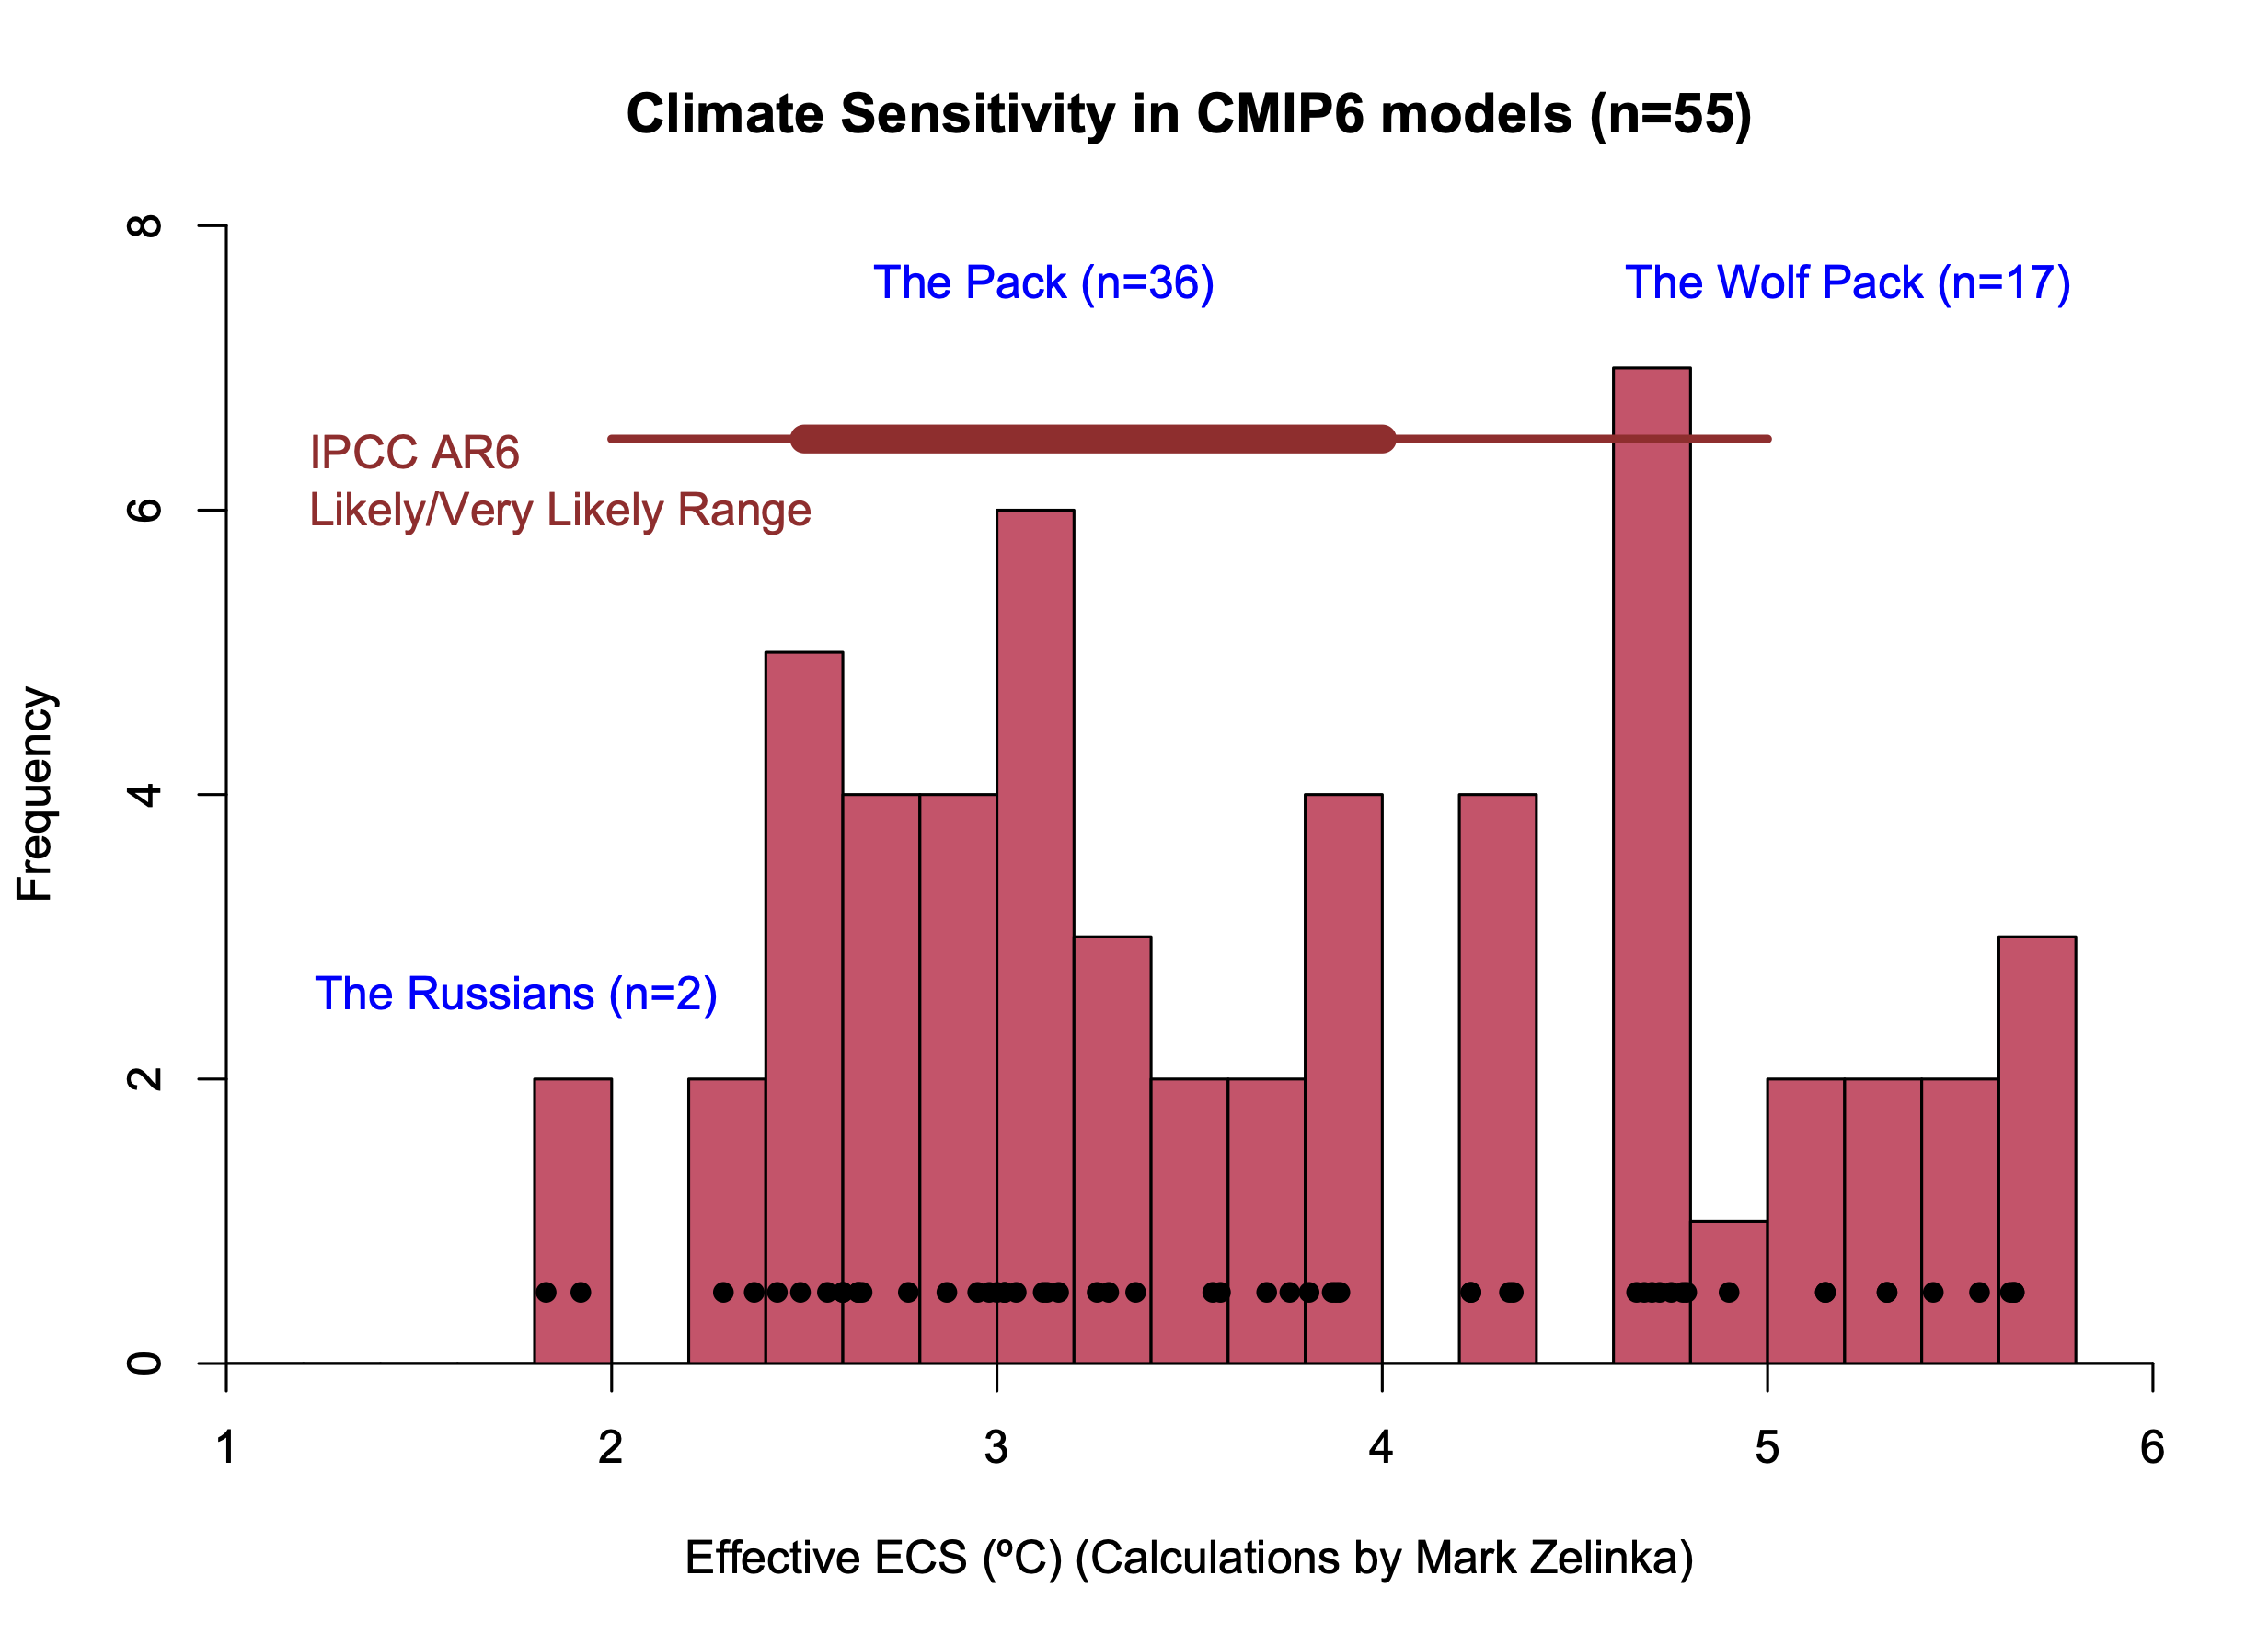
CMIP6 Climate Sensitivity Histogram

This was originally made in 2021, but as models were added and calculations fixed, it has changed a little. This version included all models that had calculated Effective ECS values (both from Mark Zelinka and elsewhere) as of October 2025.

Primary Sidebar

Search

Search for:

Email Notification

get new posts sent to you automatically (free)
Loading

Recent Posts

  • The Climate Science reference they don’t want Judges to read
  • Koonin’s Continuing Calumnies
  • Unforced variations: Feb 2026
  • 2025 Updates
  • A peek behind the curtain…
  • AI/ML climate magic?

Our Books

Book covers
This list of books since 2005 (in reverse chronological order) that we have been involved in, accompanied by the publisher’s official description, and some comments of independent reviewers of the work.
All Books >>

Recent Comments

  • Piotr on 2025 Updates
  • Ron R. on 2025 Updates
  • Tomáš Kalisz on 2025 Updates
  • Tomáš Kalisz on Koonin’s Continuing Calumnies
  • Tomáš Kalisz on Koonin’s Continuing Calumnies
  • Nigelj on Koonin’s Continuing Calumnies
  • Tomáš Kalisz on Unforced variations: Feb 2026
  • Atomsk’s Sanakan on 2025 Updates
  • Tomáš Kalisz on 2025 Updates
  • Ray Ladbury on Koonin’s Continuing Calumnies
  • zebra on Unforced variations: Feb 2026
  • MA Rodger on Unforced variations: Feb 2026
  • Nigelj on Unforced variations: Feb 2026
  • Susan Anderson on Koonin’s Continuing Calumnies
  • Tomáš Kalisz on 2025 Updates
  • Susan Anderson on Unforced variations: Feb 2026
  • Crusty Caballero on Koonin’s Continuing Calumnies
  • John Pollack on 2025 Updates
  • Yebo Kando on 2025 Updates
  • Tomáš Kalisz on 2025 Updates
  • Tomáš Kalisz on 2025 Updates
  • Barton Paul Levenson on Koonin’s Continuing Calumnies
  • Silvia Leahu-Aluas on Unforced variations: Feb 2026
  • Jean-Pierre Demol on 2025 Updates
  • Martin Smith on Unforced variations: Feb 2026
  • Pete best on Unforced variations: Feb 2026
  • Data on Koonin’s Continuing Calumnies
  • Data on Koonin’s Continuing Calumnies
  • Martin Smith on Unforced variations: Feb 2026
  • Martin Smith on Unforced variations: Feb 2026

Footer

ABOUT

  • About
  • Translations
  • Privacy Policy
  • Contact Page
  • Login

DATA AND GRAPHICS

  • Data Sources
  • Model-Observation Comparisons
  • Surface temperature graphics
  • Miscellaneous Climate Graphics

INDEX

  • Acronym index
  • Index
  • Archives
  • Contributors

Realclimate Stats

1,396 posts

15 pages

250,024 comments

Copyright © 2026 · RealClimate is a commentary site on climate science by working climate scientists for the interested public and journalists.