Have at it.
Blog – realclimate.org – All Posts
Far out in North Carolina
The extensive salt marshes on the Outer Banks of Carolina offer ideal conditions for unravelling the mysteries of sea level change during past centuries. Here is a short report from our field work there – plus some comments on strange North Carolina politics as well as two related new papers published today in Nature Climate Change.
The Outer Banks of Carolina are particularly vulnerable to coastal erosion and sea-level rise, partly because the land is subsiding and the banks are naturally moving landward. On the ocean front, land is continually being lost.
[Read more…] about Far out in North Carolina
Methane game upgrade
Walter Anthony et al (2012) have made a major contribution to the picture of methane emissions from thawing Arctic regions. Not a game-changer exactly, but definitely a graphics upgrade, bringing the game to life in stunningly higher resolution (/joke).
[Read more…] about Methane game upgrade
What makes sea-level rise?
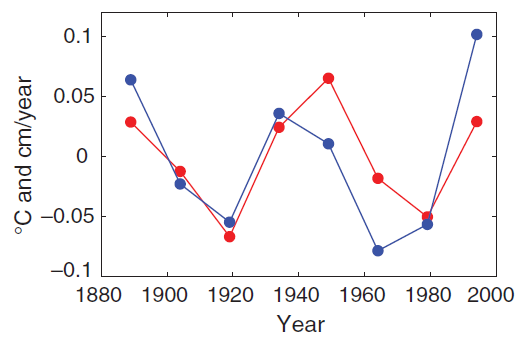
Last week the science community was shocked by the claim that 42% of the sea-level rise of the past decades is due to groundwater pumping for irrigation purposes. What could this mean for the future – and is it true?
The causes of global sea level rise can be roughly split into three categories: (1) thermal expansion of sea water as it warms up, (2) melting of land ice and (3) changes in the amount of water stored on land. There are independent estimates for these contributions, and obviously an important question is whether their sum is consistent with the total sea level rise actually observed.
foto (c) Stefan Rahmstorf 2012
[Read more…] about What makes sea-level rise?
Unforced Variations; June 2012
Real Video
Guest post by Kelly Levin, WRI; Paul Higgins, AMS; Brian Helmuth, University of South Carolina; and Andy Dessler, Texas A&M
Scientists have made massive progress in understanding the climate system and how human activities are altering it. Despite that progress, decision makers continue to struggle with climate change risk management.
RealClimate and other initiatives have shown that new media can be effective in enhancing communication of climate science. The speed by which new information can be transmitted has increased significantly, and new media has provided new learning opportunities, including discussion, debate, and links to further information.
This month, WRI, supported by google.org, launched a pilot project to further build the capacity of the scientific community to more effectively relay their recent scientific findings. The project stemmed from the Google Science Communication Fellow program, which aims to foster more accessible, open, and transparent scientific dialogue.
The project assesses whether video can be a compelling way for a scientist to describe his/her discoveries and, if so, which type of video works best. Imagine video being embedded one day into journal websites and Google scholar, not only offering the option of downloading a recent publication but also a video associated with the publication. Imagine videos sitting alongside newspaper and magazine articles, where you can hear about findings directly from the scientist in his or her own words. Like RealClimate, the project aims to connect viewers to the scientists themselves.
This project has the potential to improve scientific communication and enhance the public understanding of science. Ultimately, if done right scientific communication can help shape the public debate and lead to more informed decisions. That’s critical because societal decisions have the greatest chance to benefit the public when they are grounded in the best available knowledge and understanding. We need RealClimate’s reader’s help.
Please assist us in identifying the most effective means for communicating the latest findings of climate science via video. Go to http://www.wri.org/communicating-climate-science to watch the three videos.
Three scientists (also Google Fellows) — Andy Dessler from Texas A&M University; Brian Helmuth from University of South Carolina; and Paul Higgins from the American Meteorological Society – participated, and the videos showcase one of their recent studies that is either in production or recently published:
Dessler’s paper (Science, Vol. 330., http://geotest.tamu.edu/userfiles/216/dessler10b.pdf) focused on quantifying the cloud feedback. Using the ENSO to study changing cloud patterns during climatic variability, he found that the feedback is likely positive, consistent with the feedback that climate models yield.
Helmuth’s paper (Ecology Letters, forthcoming) examined the impact of variations in water and aerial temperatures on predator-prey interactions between sea stars and mussels in the intertidal zone. He and his colleagues found that predation rates decreased during non-coincident interactions between the two temperature stressors. Their paper underscores the need for taking into account temporal fluctuations in environmental stress, which can be ignored in experiments and models.
Higgins focuses on his recent research (Journal of Climate, in press) to more fully quantify the potential range in the terrestrial carbon cycle response to climate warming. This research suggests that plants and soils could release large amounts of carbon dioxide as global climate warms. That would push GHG concentrations higher and lead to even more climate warming. This is important because we’ve been counting on plants and soils to soak up and store some of the carbon we’re releasing.
Three videos were produced for each of the abovementioned papers:
Which video do you think works best? Click here to cast your vote and tell us about why you think it is most effective. Your votes will inform any scaling up of this project in the future.
Fresh hockey sticks from the Southern Hemisphere
In the Northern Hemisphere, the late 20th / early 21st century has been the hottest time period in the last 400 years at very high confidence, and likely in the last 1000 – 2000 years (or more). It has been unclear whether this is also true in the Southern Hemisphere. Three studies out this week shed considerable new light on this question. This post provides just brief summaries; we’ll have more to say about these studies in the coming weeks. [Read more…] about Fresh hockey sticks from the Southern Hemisphere
OHC Model/Obs Comparison Errata
This is just a brief note to point out that a few graphs that I have put together showing Ocean Heat Content changes in recent decades had an incorrect scaling for the GISS model data. My error was in assuming that the model output (which were in units W yr/m2) were scaled for the ocean area only, when in fact they were scaled for the entire global surface area (see fig. 2 in Hansen et al, 2005). Therefore, in converting to units of 1022 Joules for the absolute ocean heat content change, I had used a factor of 1.1 (0.7 x 5.1 x 365 x 3600 x 24 x 10-8), instead of the correct value of 1.61 (5.1 x 365 x 3600 x 24 x 10-8). This problem came to light while we were redoing this analysis for the CMIP5 models and from conversations with dana1981 at skepticalscience.com.
These graphs appeared in Dec 2009, May 2010, Jan 2011 and Feb 2012. In each case, I have replaced the graph with a corrected version while leaving a link to the incorrect version. Links to the figures will return the corrected image (and this is noted on the image itself). Where possible I used the data that were current at the time of the original post. Fortunately this only affects the figures used in these blog postings and not in any publications. Apologies for any confusion.
This figure shows the comparison using the most up-to-date observational products (NODC, PMEL):
The basic picture is unchanged – model simulations were able to capture the historical variance in OHC (as best we know it now – there remains significant structural uncertainty in those estimates). There are clear dips related volcanic eruptions (Agung, El Chichon, Pinatubo), and an sharp increase in the 1990s. Note that in GISS-EH (same AGCM but with a different ocean model) OHC increases at a slightly slower rate than seen with GISS-ER above. Looking at the last decade, it is clear that the observed rate of change of upper ocean heat content is a little slower than previously (and below linear extrapolations of the pre-2003 model output), and it remains unclear to what extent that is related to a reduction in net radiative forcing growth (due to the solar cycle, or perhaps larger than expected aerosol forcing growth), or internal variability, model errors, or data processing – arguments have been made for all four, singly and together.
Analyses of the CMIP5 models will provide some insight here since the historical simulations have been extended to 2012 (including the last solar minimum), and have updated aerosol emissions. Watch this space.
References
- J. Hansen, L. Nazarenko, R. Ruedy, M. Sato, J. Willis, A. Del Genio, D. Koch, A. Lacis, K. Lo, S. Menon, T. Novakov, J. Perlwitz, G. Russell, G.A. Schmidt, and N. Tausnev, "Earth's Energy Imbalance: Confirmation and Implications", Science, vol. 308, pp. 1431-1435, 2005. http://dx.doi.org/10.1126/science.1110252
Another fingerprint
When my kids were younger, they asked me why the ocean was blue. I would answer that the ocean mirrors the blue sky. However, I would not think much more about it, even though it is well-known that the oceans represent the most important source for atmospheric moisture. They also play an important role for many types of internal variations, such as the El Nino Southern Oscillation. Now a new study by Durack et al. (2012) has been published in Science that presents the relationship between the oceans and the atmosphere.
[Read more…] about Another fingerprint
References
- P.J. Durack, S.E. Wijffels, and R.J. Matear, "Ocean Salinities Reveal Strong Global Water Cycle Intensification During 1950 to 2000", Science, vol. 336, pp. 455-458, 2012. http://dx.doi.org/10.1126/science.1212222
Plugging the leaks
Guest commentary by Beate Liepert, NWRA
Clouds and water vapor accounts for only a tiny fraction of all water on Earth, but in spite of it, this moisture in the atmosphere is crucially important to replenishing drinking water reservoirs, crop yields, distribution of vegetation zones, and so on. This is the case because in the atmosphere, clouds and water vapor, transports a vast amount of water from oceans to land, where it falls out as precipitation. Scientists generally agree that rising temperatures in the coming decades will affect this cycling of water. And most climate models successfully simulate a global intensification of rainfall. However, physical models often disagree with observations and amongst themselves on the amount of the intensification, and global distribution of moisture that defines dry and wet regions.
[Read more…] about Plugging the leaks