 In the spring of 2004, when we (individually) first started talking to people about starting a blog on climate science, almost everyone thought it was a great idea, but very few thought it was something they should get involved in. Today, scientists communicating on social media is far more commonplace. On the occasion of our 10 year anniversary today it is worth reflecting on the impact of those changes, what we’ve learned and where we go next.
Blog – realclimate.org – All Posts
Ten years of RealClimate: Thanks
 As well as the current core team – David Archer, Eric Steig, Gavin Schmidt, Mike Mann, Rasmus Benestad, Ray Bradley, Ray Pierrehumbert, Stefan Rahmstorf – this blog has had input from many others over the years:
The 90+ guest contributors and previous team members who bring a necessary diversity of experience and expertise to the blog: Abby Swann, Alan Robock, Anders Levermann, Andrew Monaghan, Andy Baker, Andy Dessler, Axel Schweiger, Barry Bickmore, Bart Strengers, Bart Verheggen, Beate Liepert, Ben Santer, Brian Helmuth, Brian Soden, Brigitte Knopf, Caspar Ammann, Cecilia Bitz, Chris Colose, Christopher Hennon, Corrine LeQuere, Darrell Kaufman, David Briske, David Karoly, David Ritson, David Vaughan, Dim Coumou, Dirk Notz, Dorothy Koch, Drew Shindell, Ed Hawkins, Eugenie Scott, Figen Mekik, Francisco Doblas-Reyes, Frank Zeman, Geert Jan van Oldenborgh, Georg Feulner, Georg Hoffmann, George Tselioudis, Jacob Harold, Jared Rennie, Jason West, Jeffrey Pierce, Jim Bouldin, Jim Prall, John Fasullo, Joy Shumake-Guillemot, Juliane Fry, Karen Shell, Keith Briffa, Kelly Levin, Kevin Brown, Kevin Trenberth, Kim Cobb, Kyle Swanson, Loretta Mickley, Marco Tedesco, Mark Boslough, Martin Manning, Martin Vermeer, Matt King, Matthew England, Mauri Pelto, Michael Bentley, Michael Oppenheimer, Michael Tobis, Michelle L’Heureux, Natassa Romanou, Paul Higgins, Peter Minnett, Phil Jones, Pippa Whitehouse, PubPeer, Raimund Muscheler, Rein Haarsma, Richard Millar, Robert Rohde, Ron Lindsay, Ron Miller, Russell Seitz, Sarah Feakins, Scott Mandia, Scott Saleska, Simon Lewis, Spencer Weart, Stephen Schneider, Steve Ghan, Steve Sherwood, Sybren Drijfhout, Tad Pfeffer, Tamino, Terry Gerlach, Thibault de Garidel, Thomas Crowley, Tim Osborn, Tom Melvin, Urs Neu, Vicky Slonosky, William Anderegg, William Connolley and Zeke Hausfather;
The thousands of commenters that have enlivened the conversation and explored many issues in more depth than is possible in the main posts;
The translators of hundreds of posts into Polish, French, Czech, German, Italian, Spanish, Turkish, Mandarin etc;
Miloslav Nic for his “Guide to RC” which provides a comprehensive set of indexes to the content here;
Ryan and the internet service providers at Peer, and now Webfaction, that have helped deal with the many technical challenges and to Environmental Media Services and later, the Science Communication Network, for covering some of those costs;
A sincere thanks to all.
Ten years of Realclimate: By the numbers
 Start date: 10 December 2004
Number of posts: 914
Number of comments: ~172,000
Number of comments with inline responses: 14,277
Minimum number of total unique page visits, and unique views, respectively: 19 Million, 35 Million
Number of guest posts: 100+
Number of mentions in newspaper sources indexed by LexisNexis: 225
Minimum number of contributors and guest authors: 105
Minimum number of times RealClimate was hacked: 2
Busiest month: December 2009
Busiest day of the week: Monday
Number of times the IPCC and the NIPCC are mentioned, respectively: 357, 5
Minimum number of Science papers arising from a blog post here: 1
Minimum number of RealClimate mentions in Web Of Science references: 14
Minimum number of RealClimate mentions in theses indexed by ProQuest: 33
Posts highest ranked by Google by year:
All numbers are estimates from latest available data, but no warranty is implied or provided so all use of these numbers is at your own risk.
The most popular deceptive climate graph
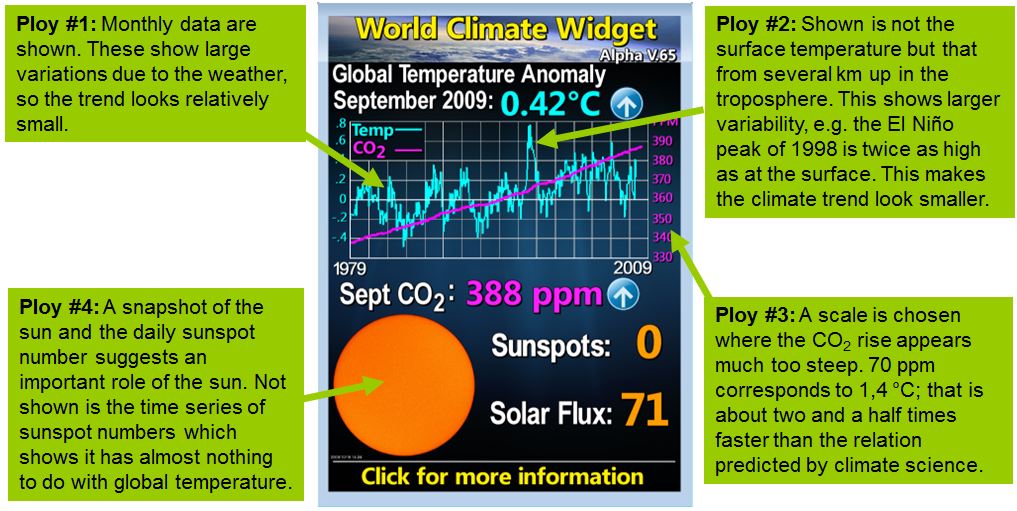
The “World Climate Widget” from Tony Watts’ blog is probably the most popular deceptive image among climate “skeptics”. We’ll take it under the microscope and show what it would look like when done properly.
So called “climate skeptics” deploy an arsenal of misleading graphics, with which the human influence on the climate can be down played (here are two other examples deconstructed at Realclimate). The image below is especially widespread. It is displayed on many “climate skeptic” websites and is regularly updated.
The “World Climate Widget” of US “climate skeptic” Anthony Watts with our explanations added. The original can be found on Watts’ blog
What would a more honest display of temperature, CO2 and sunspots look like? [Read more…] about The most popular deceptive climate graph
Recent global warming trends: significant or paused or what?
As the World Meteorological Organisation WMO has just announced that “The year 2014 is on track to be the warmest, or one of the warmest years on record”, it is timely to have a look at recent global temperature changes.
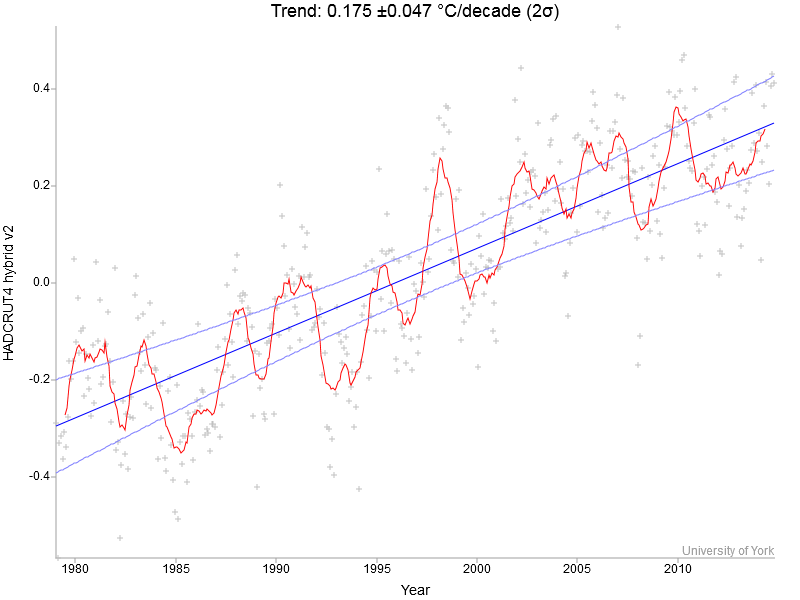
I’m going to use Kevin Cowtan’s nice interactive temperature plotting and trend calculation tool to provide some illustrations. I will be using the HadCRUT4 hybrid data, which have the most sophisticated method to fill data gaps in the Arctic with the help of satellites, but the same basic points can be illustrated with other data just as well.
Let’s start by looking at the full record, which starts in 1979 since the satellites come online there (and it’s not long after global warming really took off).
 Fig. 1. Global temperature 1979 to present – monthly values (crosses), 12-months running mean (red line) and linear trend line with uncertainty (blue) [Read more…] about Recent global warming trends: significant or paused or what?
Unforced variations: Dec 2014
A clearer picture how climate change affects El Niño?
I still remember the first time I was asked about how climate change affects El Niño. It was given as a group exercise during a winter school in Les Houghes (in France) back in February 1996. Since then, I have kept thinking about this question, and I have not been the only one wondering about this. Now I had my hopes up as a new study was just published on the evolution and forcing mechanisms of El Niño over the past 21,000 years (Liu et al., 2014).
[Read more…] about A clearer picture how climate change affects El Niño?
References
- Z. Liu, Z. Lu, X. Wen, B.L. Otto-Bliesner, A. Timmermann, and K.M. Cobb, "Evolution and forcing mechanisms of El Niño over the past 21,000 years", Nature, vol. 515, pp. 550-553, 2014. http://dx.doi.org/10.1038/nature13963
Unforced variations: Nov 2014
This month’s open thread. In honour of today’s New York Marathon, we are expecting the fastest of you to read and digest the final IPCC Synthesis report in sub-3 hours. For those who didn’t keep up with the IPCC training regime, the Summary for Policy Makers provides a more accessible target.
Also in the news, follow #ArcticCircle2014 for some great info on the Arctic Circle meeting in Iceland.
Storm surge: Hurricane Sandy
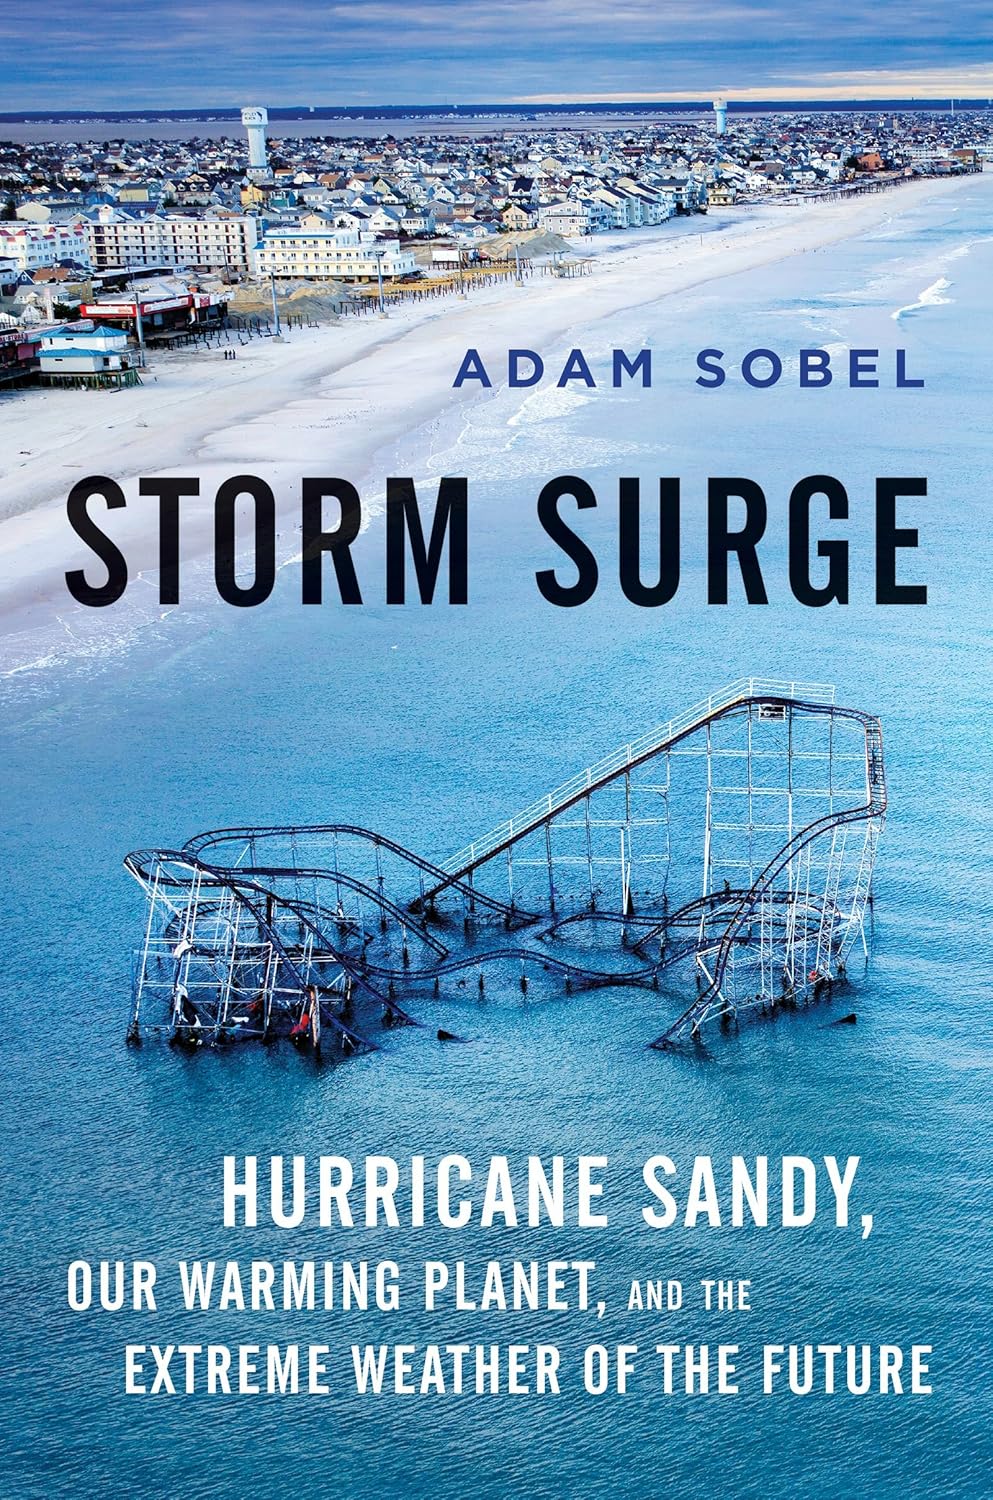
 On the second anniversary of Superstorm Sandy making landfall, we are running an extract from a new book by Adam Sobel “Storm Surge: Hurricane Sandy, Our Changing Climate, and Extreme Weather of the Past and Future”. It’s a great read covering the meteorology of the event, the preparation, the response and the implications for the future.
How do trees change the climate?
Guest commentary from Abby Swann (U. Washington)
This past month, an op-ed by Nadine Unger appeared in the New York Times with the headline “To save the climate, don’t plant trees”. The author’s main argument is that UN programs to address climate change by planting trees or preserving existing forests are “high risk” and a “bad bet”. [Ed. There is more background on the op-ed here]
However, I don’t think that these conclusions are supported by the science. The author connects unrelated issues about trees, conflates what we know about trees from different latitudes, and fails to convey the main point: tropical trees keep climate cool locally, help keep rainfall rates high, and have innumerable non-climate benefits including maintaining habitat and supporting biodiversity.
