We have now updated the model-observations comparison page for the 2021 SAT and MSU TMT datasets. Mostly this is just ‘another dot on the graphs’ but we have made a couple of updates of note. First, we have updated the observational products to their latest versions (i.e. HadCRUT5, NOAA-STAR 4.1 etc.), though we are still using NOAA’s GlobalTemp v5 – the Interim version will be available later this year. Secondly, we have added a comparison of the observations to the new CMIP6 model ensemble.
[Read more…] about Another dot on the graphs (Part II)Blog – realclimate.org – All Posts
Unforced Variations: Feb 2022
Another dot on the graph
So last week was the annual release of the temperature records from NASA, NOAA and Berkeley Earth. The Copernicus ERA5 data was released a few days ago, and the HadCRUT data will follow soon. Unlike in years past, there is no longer any serious discrepancy between the records – which use multiple approaches for the ocean temperatures, the homogenization of the weather stations records, and interpolation.
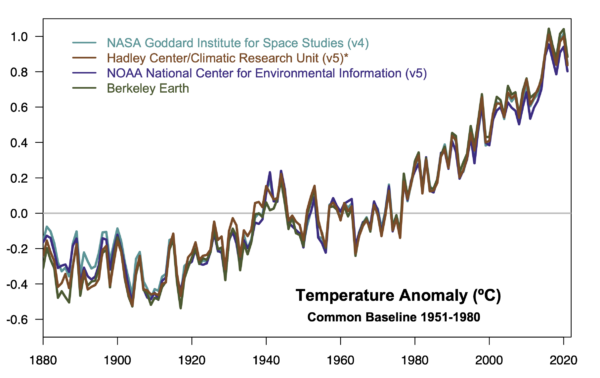
Depending on the product, 2021 was either the 5th, 6th or 7th warmest year, but in all cases, it is part of the string of warm years (since 2015) that have all been more than 1ºC warmer than the late 19th C.
[Read more…] about Another dot on the graph“Don’t Look Up”

The highlight of the movie season for climate science has clearly been the release on Dec 24th 2021 of “Don’t Look Up”. While nominally about a different kind of disaster – the discovery of a comet heading to Earth on a collision course – the skewering of our current science-policy dysfunction transcends the specifics and makes a powerful metaphor for climate change, and even the ongoing COVID-19 pandemic.
[Read more…] about “Don’t Look Up”Forced responses: Jan 2022
A bi-monthly open thread related to climate solutions.
PS. New year, new moderation policy. Please be substantive – sniping, insults, and tedious repetition will just be culled. We want to maintain a civil and productive discourse here, but the comment threads may need to be re-evaluated if that doesn’t happen.
Unforced Variations: Jan 2022
This month’s open thread on climate science topics. Note that summaries of annual climate data from 2021 will start to appear in a couple of weeks, and updates to the model/observations comparisons will appear a week or so after that.
PS. New year, new moderation policy. Please be substantive – sniping, insults, and tedious repetition will just be culled. We want to maintain a civil and productive discourse here, but the comment threads may need to be re-evaluated if that doesn’t happen.
Unforced Variations: Dec 2021
Making predictions with the CMIP6 ensemble
The CMIP6 multi-model ensemble is a unique resource with input from scientists and modeling groups from around the world. [CMIP stands for the Coupled Model Intercomparison Project, and it is now in its 6th Phase]. But as we’ve discussed before (#NotAllModels) there are some specific issues that require users to be cautious in making predictions. Fortunately, there are useful ‘best practices’ that can help avoid the worst pitfalls.
A new paper by McCrystall et al that has just appeared in Nature Communications illustrates these issues clearly by having some excellent analyses of the changes in Arctic precipitation regimes at different global warming levels, and examining the sensitivity of their metrics to both local and Arctic warming, but unfortunately relying on the CMIP6 multi-model mean for their headline statements and press release.
[Read more…] about Making predictions with the CMIP6 ensembleReferences
- M.R. McCrystall, J. Stroeve, M. Serreze, B.C. Forbes, and J.A. Screen, "New climate models reveal faster and larger increases in Arctic precipitation than previously projected", Nature Communications, vol. 12, 2021. http://dx.doi.org/10.1038/s41467-021-27031-y
Net Zero/Not Zero
At the COP26 gathering last week much of the discussion related to “Net-Zero” goals. This concept derives from important physical science results highlighted in the Special Report on 1.5ºC and more thoroughly in the last IPCC report that future warming is tied to future emissions, and that warming will effectively cease only once anthropogenic CO2 emissions are balanced by anthropogenic CO2 removals. But some activists have (rightly) pointed out that large-scale CO2 removals are as yet untested, and so reliance on them to any significant extent to balance out emissions is akin not really committing to net zero at all. Their point is that “net-zero” is not zero and hence will serve as a smokescreen for insufficient climate action. To help sort this out some background might be helpful.
[Read more…] about Net Zero/Not ZeroForced responses: Nov 2021
A bi-monthly open thread related to climate solutions. This month will start off with COP-26 and many targets and plans and mechanisms will be proposed and discussed. Look out for the updated impacts of the evolving NDCs such as this one from Climate Resource, suggesting that the world could be on track for just a little less than 2ºC warming (relative to the pre-industrial) (if everyone does what they pledge and we are lucky with respect to climate sensitivity). Please be respectful and constructive.