This month’s open thread on climate science topics. Discussions related to solutions should go here.
Blog – realclimate.org – All Posts
Climate Adaptation Summit 2021
The first ever Climate Adaptation Summit (#adaptationsummit) that I have heard about took place last week, on January 25-26. I think such a summit was a step in the right direction. It was adapted to the Covid-19 situation and therefore an online virtual summit streamed on YouTube.
I watched a few of the streamed sessions, and it struck me that climate change adaptation seems to be a fairly new concept to many leaders. It were sometimes mix-ups with mitigation during the high-level talks. Mitigation and adaptation are both important and sometimes they overlap, so mix-ups are understandable.
One important point addressed during the summit was of course financing climate change adaptation, which is promising. Financing is clearly needed for climate change adaptation. To ensure progress and avoid lofty visions without results on the ground, there may also be a need for tangible results and to show examples and demonstrations. One specific type discussed at the summit was “Early warning systems” which play an important role.
But it was not crystal clear what was meant by the concept “early warning systems”. My interpretation is that it involves something on par with weather forecasts which would imply that they are more about weather than climate. This is of course important too. Probably the first priority in many places.
But early warning systems, the way I understand them, don’t provide information about climate risks on longer timescales. Weather and climate – short and long timescales – are of course connected but nevertheless different (“climate” can be viewed as weather statistics). Other examples of climate adaptation can be found in a recent Eos article on food security in Africa. I think it is important to mention maladaptation and avoid long-term problems connected to short-term fixes. Resilience is a keyword.
As with many other summits, I felt that the scientists’ voice was largely missing. There seems to be a gap between high-level politics and science. I think we need a better dialogue between the leaders and climate scientists partly to help distinguish between different and difficult concepts. But the main reason is that we need to know what we must adapt to. We need to know the situation: the state of the climate and how it is changing. This knowledge is not readily downloadable from the Internet.
There are key questions that should involve scientists: What is needed for proper climate change adaptation? And what are the challenges in terms of meeting our objectives? What do we know about future risks? In addition, biodiversity, nature conservation, cultural, social and economic aspects are important.
Data is crucial, but is often unavailable because of lack of sharing and lack of openness. Often due to lacking finance. Information about the regional climate change must be distilled from large volumes of data, and we need to ask what information is useful and how it can be used in the best possible way.
The required analysis is often carried out in climate services and often includes downscaling. It involves tools, methods and understanding that are still evolving with regards to these topics. This fact wasn’t explained clearly during the summit in the sessions I watched. I think it would be useful with a presentation of the state of climate science relevant for climate change adaptation at a high level in the summit. Perhaps science should get an equal amount of attention as the NGOs and the businesses.
Much of the latest research relevant to the climate adaptation summit is coordinated within the World Climate Research Programme (WRCP) which also is setting a new focus on regional information for society (“RifS”). Furthermore, there is considerable scientific experience on adaptation from the Arctic with the fastest climate change on Earth, such as the Adaptive Actions in a Changing Arctic (AACA) report for the Arctic Council.
Climate adaptation involves many communities and disciplines (e.g. weather forecasting, climate services, regional climate modelling, “distillation“, disaster risk reduction) which I think aren’t well coordinated at the moment. One message from the summit was “Let’s work together” which I think implies a better coordination of the different disciplines and communities.
Update day 2021
As is now traditional, every year around this time we update the model-observation comparison page with an additional annual observational point, and upgrade any observational products to their latest versions.
A couple of notable issues this year. HadCRUT has now been updated to version 5 which includes polar infilling, making the Cowtan and Way dataset (which was designed to address that issue in HadCRUT4) a little superfluous. Going forward it is unlikely to be maintained so, in a couple of figures, I have replaced it with the new HadCRUT5. The GISTEMP version is now v4.
For the comparison with the Hansen et al. (1988), we only had the projected output up to 2019 (taken from fig 3a in the original paper). However, it turns out that fuller results were archived at NCAR, and now they have been added to our data file (and yes, I realise this is ironic). This extends Scenario B to 2030 and Scenario A to 2060.
Nothing substantive has changed with respect to the satellite data products, so the only change is the addition of 2020 in the figures and trends.
So what do we see? The early Hansen models have done very well considering the uncertainty in total forcings (as we’ve discussed (Hausfather et al., 2019)). The CMIP3 models estimates of SAT forecast from ~2000 continue to be astoundingly on point. This must be due (in part) to luck since the spread in forcings and sensitivity in the GCMs is somewhat ad hoc (given that the CMIP simulations are ensembles of opportunity), but is nonetheless impressive.
The forcings spread in CMIP5 was more constrained, but had some small systematic biases as we’ve discussed Schmidt et al., 2014. The systematic issue associated with the forcings and more general issue of the target diagnostic (whether we use SAT or a blended SST/SAT product from the models), give rise to small effects (roughly 0.1ºC and 0.05ºC respectively) but are independent and additive.
The discrepancies between the CMIP5 ensemble and the lower atmospheric MSU/AMSU products are still noticeable, but remember that we still do not have a ‘forcings-adjusted’ estimate of the CMIP5 simulations for TMT, though work with the CMIP6 models and forcings to address this is ongoing. Nonetheless, the observed TMT trends are very much on the low side of what the models projected, even while stratospheric and surface trends are much closer to the ensemble mean. There is still more to be done here. Stay tuned!
The results from CMIP6 (which are still being rolled out) are too recent to be usefully added to this assessment of forecasts right now, though some compilations have now appeared:
The issues in CMIP6 related to the excessive spread in climate sensitivity will need to be looked at in more detail moving forward. In my opinion ‘official’ projections will need to weight the models to screen out those ECS values outside of the constrained range. We’ll see if other’s agree when the IPCC report is released later this year.
Please let us know in the comments if you have suggestions for improvements to these figures/analyses, or suggestions for additions.
References
- Z. Hausfather, H.F. Drake, T. Abbott, and G.A. Schmidt, "Evaluating the Performance of Past Climate Model Projections", Geophysical Research Letters, vol. 47, 2020. http://dx.doi.org/10.1029/2019GL085378
- G.A. Schmidt, D.T. Shindell, and K. Tsigaridis, "Reconciling warming trends", Nature Geoscience, vol. 7, pp. 158-160, 2014. http://dx.doi.org/10.1038/ngeo2105
2020 Hindsight
Yesterday was the day that NASA, NOAA, the Hadley Centre and Berkeley Earth delivered their final assessments for temperatures in Dec 2020, and thus their annual summaries. The headline results have received a fair bit of attention in the media (NYT, WaPo, BBC, The Guardian etc.) and the conclusion that 2020 was pretty much tied with 2016 for the warmest year in the instrumental record is robust.
[Read more…] about 2020 HindsightFlyer tipping
You would be forgiven for not paying attention to the usual suspects of climate denial right now, but they are trying to keep busy anyway.
Last week (January 8), Roy Spencer [Update Jan 13: now deleted] posted a series of Climate Change “flyers” on his personal blog that purported to be organised by David Legates (NOAA, detailed to Office of Science and Technology Policy (OSTP), nominally on leave from (and soon to return to) U. Delaware). Each was a rather garishly colored rehash of standard climate denial talking points, but featuring the OSTP official logo, and claiming to be copyrighted by OSTP (a legal impossibility). Note that if this was an official US Govt. work, they could not copyright them, but if it wasn’t, they could not legally use the OSTP logo to indicate that it was.
The reaction to this definitive refutation of mainstream science (ha!) was… silence. Spencer’s post was reblogged at WUWT but again, nothing happened [Update Jan 13: Also now deleted]. . Many of the authors of the pieces themselves – many of whom are active on social media – didn’t bother to tweet or post about them. Odd.
The whole thing seems to be Legates trying to get a pet project out into the world before the new administration comes in, but without bothering with all that messy peer-review, official permission, proper channels or, you know, actual science. Almost certainly this is also a violation of the Data Quality Act, something Patrick Michaels (one of the flyer authors) was quite exercised about in his effort. Consistency is also apparently optional.
Anyway, a couple of days ago (Jan 10), they were also posted on Willie Soon’s new website where they were noticed on twitter, and today there have been some media eyebrows raised.
Is there a there there?
The flyers themselves are remarkably thin on valid argumentation. Will Happer’s discussion of Radiative Transfer is mostly textbook stuff except for the last paragraph where he simply asserts that a radiative forcing of 3 W/m2 can’t possibly matter. That’s kind of the key issue, which he totally elides.
Christopher Essex purports to discuss climate models, without ever showing anything from a climate model. He seems to be arguing against some Aristotelian concept of climate models that never has to be bothered with actually looking at the real world (for instance). Weird, and totally pointless.
Spencer makes the remarkable assertion that climate has changed for natural reasons in the past (I’m shocked, shocked!), and ignores how attribution actually works (I’m not at all shocked).
The Connollys and Willie Soon’s flyer purports to talk about sun-climate connections, but they spend most of their effort talking about Milankovitch forcing before pivoting to imagining a universe where the temperatures have not in fact been steadily climbing but where they could conceivably have a higher correlation to out-of-date and unsupported reconstructions of solar activity. In so doing, they even have the chutzpah to cite a paper of mine. Meh.
Etc. If there is a demand in the comments, I could expand on the others, but for now, I think you get the idea.
Why should anyone care?
Great question! I don’t think anyone should. But this whole effort is emblematic of how far the climate question has moved. With a new US administration poised to act on climate across a whole series of fronts, this feeble throwback (were they released on a Thursday?), serves to underline how out-of-touch these old school deniers and their talking points really are. This is perhaps the last weak ‘hurrah’ of a bankrupt cause.
Good riddance to bad rubbish.
Update (4pm, Jan 12): that was quick:
BREAKING: @WHOSTP has fired climate contrarians David Legates and @RyanMaue days before their last scheduled day of service, due to their role in the unauthorized writing and publishing of controversial climate papers w/ White House markings. https://t.co/3aMhpZJ65w
— Andrew Freedman (@afreedma) January 12, 2021
Forced Responses: Jan 2021
A new open thread for climate solutions in the new year (and the soon-to-be new US administration actions). As for the climate science open threads, please try to renew your commitment to constructive dialog that prioritises light over heat (like LED bulbs for instance!). Thanks!
Unforced Variations: Jan 2021
According to the somewhat* arbitrary customs of our age, the 1st of January marks the beginning of a new year, a new decade and, by analogy, a new start in human affairs. So shall it be at RealClimate too**.
This month’s topics will no doubt include the summaries of the 2020 climate (due Jan 14th or so), ongoing efforts to understand and predict extreme weather in a climate context, and the shift by the weather organizations (WMO, NWS) to a new set of climate normals (i.e. moving from 1981-2010 to 1991-2020).
In the spirit of this new year, please make a renewed effort to stay vaguely on climate science topics, try to stay constructive even when you disagree, refrain from posting abuse, and don’t bother with cut-and-paste climate denial (that stuff was tedious enough when it was originally wrong, and is simply boring now). Thanks!
*completely
**Seriously, we are thinking about how to update/re-position this blog, and would welcome constructive suggestions from readers.
2020 vision
No-one needs another litany of all the terrible things that happened this year, but there are three areas relevant to climate science that are worth thinking about:
- What actually happened in climate/weather (and how they can be teased apart). There is a good summary on the BBC radio Discover program covering wildfires, heat waves, Arctic sea ice, the hurricane season, etc. featuring Mike Mann, Nerlie Abram, Sarah Perkins-Kilpatrick, Steve Vavrus and others. In particular, there were also some new analyses of hurricanes (their rapid intensification, slowing, greater precipitation levels etc.), as well as the expanding season for tropical storms that may have climate change components. Yale Climate Connections also has a good summary.
- The accumulation of CMIP6 results. We discussed some aspects of these results extensively – notably the increased spread in Equilibrium Climate Sensitivity, but there is a lot more work to be done on analyzing the still-growing database that will dominate the discussion of climate projections for the next few years. Of particular note will be the need for more sophisticated analyses of these model simulations that take into account observational constraints on ECS and a wider range of future scenarios (beyond just the SSP marker scenarios that were used in CMIP). These issues will be key for the upcoming IPCC 6th Assessment Report and the next National Climate Assessment.
- The intersection of climate and Covid-19.
- The direct connections are clear – massive changes in emissions of aerosols, short-lived polluting gases (like NOx) and CO2 – mainly from reductions in transportation. Initial results demonstrated a clear connection between cleaner air and the pandemic-related restrictions and behavioural changes, but so far the impacts on temperature or other climate variables appear to be too small to detect (Freidlingstein et al, 2020). The impact on global CO2 emissions (LeQuere et al, 2020) has been large (about 10% globally) – but not enough to stop CO2 concentrations from continuing to rise (that would need a reduction of more like 70-80%). Since the impact from CO2 is cumulative this won’t make a big difference in future temperatures unless it is sustained through post-pandemic changes.
- The metaphorical connections are also clear. The instant rise of corona virus-denialism, the propagation of fringe viewpoints from once notable scientists, petitions to undermine mainstream epidemiology, politicized science communications, and the difficulty in matching policy to science (even for politicians who want to just ‘follow the science’), all seem instantly recognizable from a climate change perspective. The notion that climate change was a uniquely wicked problem (because of it’s long term and global nature) has evaporated as quickly as John Ioannidis’ credibility.
I need to take time to note that there has been human toll of Covid-19 on climate science, ranging from the famous (John Houghton) to the families of people you never hear about in the press but whose work underpins the data collection, analysis and understanding we all rely on. This was/is a singular tragedy.
With the La Niña now peaking in the tropical Pacific, we can expect a slightly cooler year in 2021 and perhaps a different character of weather events, though the long-term trends will persist. My hope is that the cracks in the system that 2020 has revealed (across a swathe of issues) can serve as an motivation to improve resilience, equity and planning, across the board. That might well be the most important climate impact of all.
A happier new year to you all.
References
- P.M. Forster, H.I. Forster, M.J. Evans, M.J. Gidden, C.D. Jones, C.A. Keller, R.D. Lamboll, C.L. Quéré, J. Rogelj, D. Rosen, C. Schleussner, T.B. Richardson, C.J. Smith, and S.T. Turnock, "Current and future global climate impacts resulting from COVID-19", Nature Climate Change, vol. 10, pp. 913-919, 2020. http://dx.doi.org/10.1038/s41558-020-0883-0
- C. Le Quéré, R.B. Jackson, M.W. Jones, A.J.P. Smith, S. Abernethy, R.M. Andrew, A.J. De-Gol, D.R. Willis, Y. Shan, J.G. Canadell, P. Friedlingstein, F. Creutzig, and G.P. Peters, "Temporary reduction in daily global CO2 emissions during the COVID-19 forced confinement", Nature Climate Change, vol. 10, pp. 647-653, 2020. http://dx.doi.org/10.1038/s41558-020-0797-x
The number of tropical cyclones in the North Atlantic
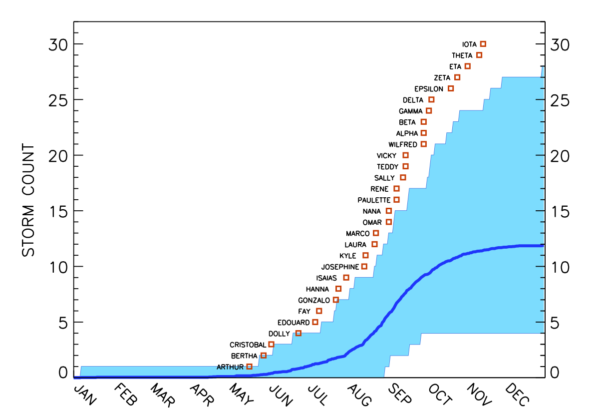
2020 has been an unusual and challenging year in many ways. One was the record-breaking number of named tropical cyclones in the North Atlantic (and the Carribean Sea). There has been 30 named North Atlantic tropical cyclones in 2020, beating the previous record of 28 from 2005 by two.
A natural question then is whether we can expect this high number in the future or if the number of tropical storms will continue to increase. A high number of such events is equivalent to a high frequency of tropical cyclones.
But we should expect fewer tropical cyclones generally in a warmer world according to the IPCC “SREX” report from 2012, and those that form may become even more powerful than the ones that we have observed to date:
There is generally low confidence in projections of changes in extreme winds because of the relatively few studies of projected extreme winds, and shortcomings in the simulation of these events. An exception is mean tropical cyclone maximum wind speed, which is likely to increase, although increases may not occur in all ocean basins. It is likely that the global frequency of tropical cyclones will either decrease or remain essentially unchanged…
So how does this conclusion relate to the number of tropical cyclones in the North Atlantic with a new record this season? One reason to look in more detail at the North Atlantic is because its observational record is believed to be more complete and more reliable than for other regions around the world.
The observational record may also suggest that the number of tropical cyclones in the North Atlantic has increased slowly over the 50 years in addition to year-to-year fluctuations around this trend (black symbols in Fig 1).
We know that the number of cyclones is sensitive to the time of the year (hence, hurricane seasons), phenomena such as El Niño Southern Oscillation (ENSO) and the Madden Julian Oscillation (MJO), and geography (the ocean basin shape and the latitude). We also know that the sea surface needs to be warmer than 26.5°C for them to form.
The role of sea surface temperature is indeed an important factor, and from physical reasoning, one would think that the number of tropical cyclones depends on the area of warm sea surface (sea surface temperature exceeding 26.5°C).
One explanation for why the area is a key factor may be that the probability of finding favourable conditions with right ‘seed’ for organised convection (e.g. easterly waves) and no wind shear increases when there is a greater region with sufficient sea surface temperatures.
The area of warm sea surface is mentioned in the IPCC SREX that dismisses the expectation that an increase in the area extent of the region of 26°C sea surface temperature should lead to increases in tropical cyclone frequency. Specifically it says that there is
a growing body of evidence that the minimum SST [sea surface temperature] threshold for tropical cyclogenesis increases at about the same rate as the SST increase due solely to greenhouse gas forcing.
On the other hand, there has also been some indication that the number of tropical cyclones does seem to be proportional to the area to the power of 5: (Benestad, 2008). When this relationship is extended to recent years, as shown with the green and blue curves in Fig 1, we see an increase that this crude estimate more or less follows the observed number of evens.
Global warming implies a greater area with sea surface exceeding the threshold of 26.5°C for tropical cyclone genesis. Also, the nonlinear dependency to implies few events and little trend as long as is below a critical size. The combination of a nonlinear relationship and a critical threshold area could explain why it is difficult to detect a trend in the historical data.
There is some good news in that is limited by the geometry of the ocean basin. Nevertheless, a potential nonlinear connection between the number of tropical cyclones and is a concern. If this cannot be falsified, then the tropical cyclones represent a more potent danger than anticipated by the IPCC SREX conclusions. So let’s hope that somebody is able to show that the analysis presented in (Benestad, 2008) is wrong.
Fig 1. Observed (black symbols) and estimated (green and blue curves) number of named tropical cyclones in the North Atlantic and the Caribbean Sea after (Benestad, 2008). Source: “demo(tropicalcyclones)”.
References
- R.E. Benestad, "On tropical cyclone frequency and the warm pool area", Natural Hazards and Earth System Sciences, vol. 9, pp. 635-645, 2009. http://dx.doi.org/10.5194/nhess-9-635-2009
An ever more perfect dataset?
Do you remember when global warming was small enough for people to care about the details of how climate scientists put together records of global temperature history? Seems like a long time ago…
Nonetheless, it’s worth a quick post to discuss the latest updates in HadCRUT (the data product put together by the UK’s Hadley Centre and the Climatic Research Unit at the University of East Anglia). They have recently released HadCRUT5 (Morice et al., 2020), which marks a big increase in the amount of source data used (similarly now to the upgrades from GHCN3 to GHCN4 used by NASA GISS and NOAA NCEI, and comparable to the data sources used by Berkeley Earth). Additionally, they have improved their analysis of the sea surface temperature anomalies (a perennial issue) which leads to an increase in the recent trends. Finally, they have started to produce an infilled data set which uses an extrapolation to fill in data-poor areas (like the Arctic – first analysed by us in 2008…) that were left blank in HadCRUT4 (so similar to GISTEMP, Berkeley Earth and the work by Cowtan and Way). Because the Arctic is warming faster than the global mean, the new procedure corrects a bias that existing in the previous global means (by about 0.16ºC in 2018 using a 1951-1980 baseline). Combined, the new changes give a result that is much closer to the other products:
Differences persist around 1940, or in earlier decades, mostly due to the treatment of ocean temperatures in HadSST4 vs. ERSST5.
In conclusion, this update further solidifies the robustness of the surface temperature record, though there are still questions to be addressed, and there remain mountains of old paper records to be digitized.
The implications of these updates for anything important (such as the climate sensitivity or the carbon budget) will however be minor because all sensible analyses would have been using a range of surface temperature products already.
With 2020 drawing to a close, the next annual update and intense comparison of all these records, including the various satellite-derived global products (UAH, RSS, AIRS) will occur in January. Hopefully, HadCRUT5 will be extended beyond 2018 by then.
In writing this post, I noticed that we had written up a detailed post on the last HadCRUT update (in 2012). Oddly enough the issues raised were more or less the same, and the most important conclusion remains true today:
First and foremost is the realisation that data synthesis is a continuous process. Single measurements are generally a one-time deal. Something is measured, and the measurement is recorded. However, comparing multiple measurements requires more work – were the measuring devices calibrated to the same standard? Were there biases in the devices? Did the result get recorded correctly? Over what time and space scales were the measurements representative? These questions are continually being revisited – as new data come in, as old data is digitized, as new issues are explored, and as old issues are reconsidered. Thus for any data synthesis – whether it is for the global mean temperature anomaly, ocean heat content or a paleo-reconstruction – revisions over time are both inevitable and necessary.