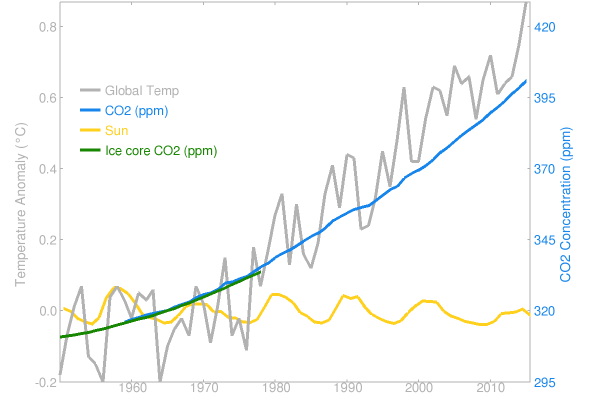
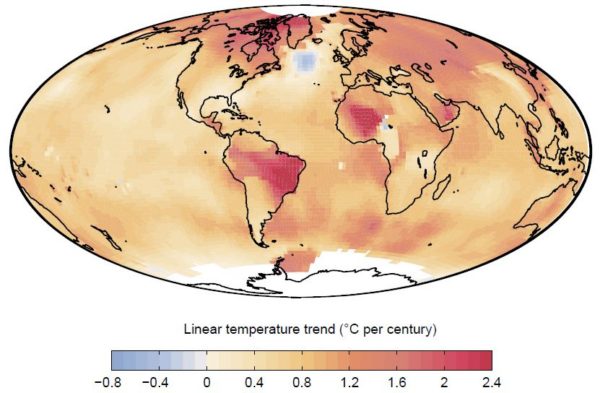
When climate deniers are desperate because the measurements don’t fit their claims, some of them take the final straw: they try to deny and discredit the data.
The years 2014 and 2015 reached new records in the global temperature, and 2016 has done so again. Some don’t like this because it doesn’t fit their political message, so they try to spread doubt about the observational records of global surface temperatures. A favorite target are the adjustments that occur as these observational records are gradually being vetted and improved by adding new data and eliminating artifacts that arise e.g. from changing measurement practices or the urban heat island effect. More about this is explained in this blog article by Victor Venema from Bonn University, a leading expert on homogenization of climate data. And of course the new paper by Hausfather et al, that made quite a bit of news recently, documents how meticulously scientists work to eliminate bias in sea surface temperature data, in this case arising from a changing proportion of ship versus buoy observations. [Read more…] about The NASA data conspiracy theory and the cold sun


