This month’s open thread for climate science topics.
Climate Science
Nenana Ice Classic 2021
And…. it’s that time again. The clock stopped on the Nenana ice classic this afternoon (April 30, 12:50pm AT). This is pretty much on trend and unsurprising given the relatively slightly cool winter in Alaska. The jackpot on offer this year was $233,591 but will likely be shared among several winners. This year’s ‘break up’ is a little odd, since the ice moved sufficiently to trigger the clock, but not enough to actually topple the tripod (which is still visible as this is being written (9pm ET) – Update 10:30pm ET: gone now though!). But, the rules are the rules…
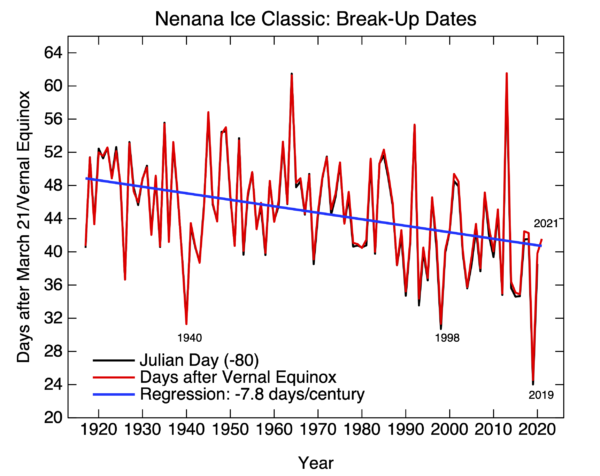
The trends in the break up date is about 8 days earlier per century (±4), estimated over the whole record, but substantially faster over the last 50 years (16 ± 12 days/century, 95% CI).
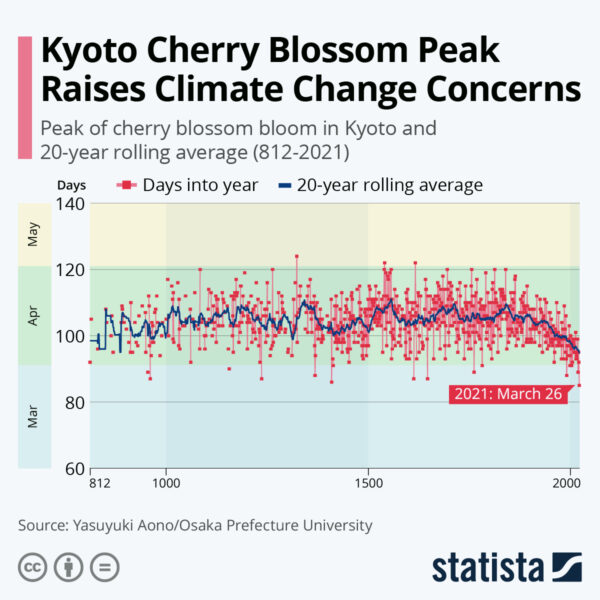
Other phenological records show similar trends, notably the longest cherry blossom record from Kyoto which dates back to 9th Century, and which had a record earliest peak bloom this year and a clear trend over the last few decades:
Feel free to link to your favorite such record in the comments…
Two graphs show the path to 1.5 degrees
In the Paris Agreement, just about all of the world’s nations pledged to “pursue efforts to limit the temperature increase to 1.5 degrees Celsius above pre-industrial levels”. On Saturday, the top climate diplomats from the U.S. and China, John Kerry and Xie Zhenhua, reiterated in a joint statement that they want to step up their climate mitigation efforts to keep that goal “within reach”.
But is that still possible? Here are two graphs.
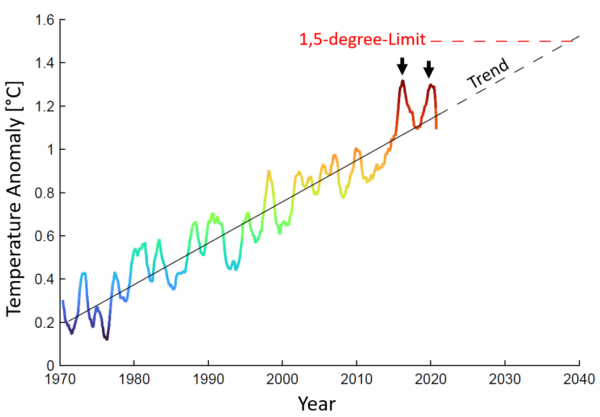
The first graph shows the global temperature trend. Warming has progressed essentially linearly for fifty years in response to increasing CO2 emissions. Although the latter accelerate the rise of CO2 in the atmosphere, on the other hand, radiative forcing (which causes warming) increases only with the logarithm of CO2 concentration, and therefore roughly linearly since the 1970s. Any acceleration of warming over the last decade is not a significant trend change. It is linked to two El Niño events in recent years, but that is part of natural variability. Does anyone remember the discussion about the supposed “warming pause” in the early 2000s? It also never was statistically significant, nor did it signify a trend change.
Therefore, if emissions continue to grow, we expect a further roughly linear increase in temperature, which would then exceed 1.5 degrees around 2040. If we lower emissions, the trend will flatten out and become roughly horizontal as we reach zero emissions. Therefore, these observational data do not argue against the possibility to still keep warming below 1.5°C.
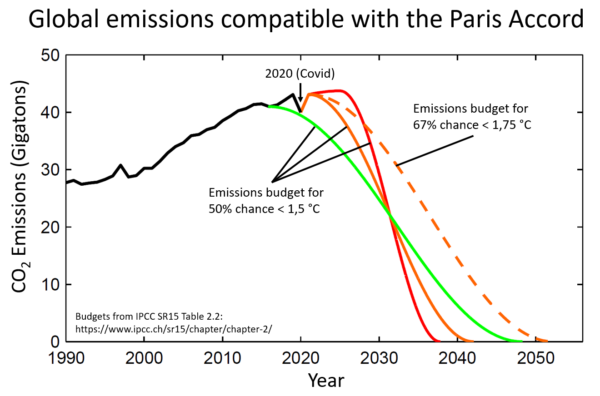
The second graph shows global CO2 emission trajectories with which we can still limit warming to 1.5 °C, at least with 50:50 probability. This means: given the uncertainties, this could also land us at 1.6 degrees, but with a bit of luck, it could land us a bit below 1.5 degrees. The core conclusions:
- It is not yet impossible to keep warming below 1.5 °C.
- This requires roughly a halving of global CO2 emissions by 2030 (as already stated in the IPCC 1.5 degree report).
- If the world dithers for another ten years before emissions fall, it will no longer be possible (red curve).
It should be noted that I have not assumed net-negative emissions here. Many scenarios assume that we first emit too much and that our children then have to pull CO2 out of the atmosphere after mid-century – I think this is not very realistic and also ethically questionable. I think we will probably not be able to achieve more than reducing global emissions to net zero. Even that would require CO2 sinks to compensate for unavoidable residual emissions, e.g. from agriculture.
Conclusion: The limitation to 1.5 degrees is still possible and from my point of view also urgently advised to avert catastrophic risks, but it requires immediate decisive measures. I am curious to see what the climate summit scheduled by US President Joe Biden will bring in the coming days!
Link
Fact check by Climate Analytics to the claim that we can no longer limit warming to 1.5°C.
This article originally appeared in German at KlimaLounge.
Should the official Atlantic hurricane season be lengthened?
By Jim Kossin, Tim Hall, Mike Mann, and Stefan Rahmstorf
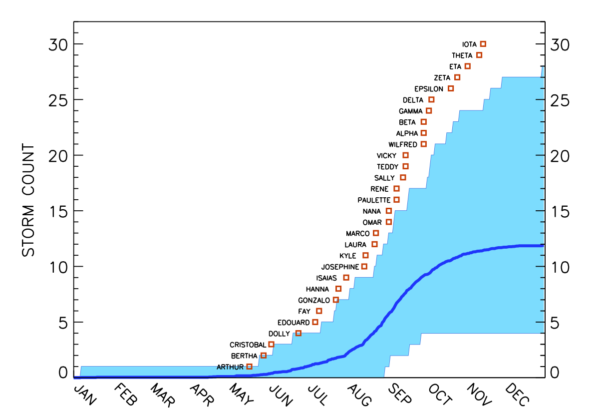
The 2020 Atlantic hurricane season broke a number of records, with the formation of an unprecedented 30 “named storms” (storms that reach wind-speed intensity of at least 18 m/s and are then given an official name). The season also started earlier than normal. In fact, when ranked by their order in the season, the date of formation of every named storm, from Tropical Storm Arthur to Hurricane Iota was substantially earlier than normal (Fig. 1).
Unforced Variations: Apr 2021
A potential rule of thumb for hourly rainfall?
Future global warming will be accompanied by more intense rainfall and flash floods due to increased evaporation, as a consequence of higher surface temperatures which also lead to a higher turn-around rate for the global hydrological cycle. In other words, we will see changing rainfall patterns. And if the global area of rainfall also shrinks, then a higher regional concentration of the rainfall is bound to lead to more intense downpours (the global rainfall indicator is discussed here).
[Read more…] about A potential rule of thumb for hourly rainfall?The Rise and Fall of the “Atlantic Multidecadal Oscillation”
Two decades ago, in an interview with science journalist Richard Kerr for the journal Science, I coined the term the “Atlantic Multidecadal Oscillation” (AMO) to describe an internal oscillation in the climate system resulting from interactions between North Atlantic ocean currents and wind patterns. These interactions were thought to lead to alternating decades-long intervals of warming and cooling centered in the extra-tropical North Atlantic that play out on 40-60 year timescales (hence the name). Think of the purported AMO as a much slower relative of the El Niño/Southern Oscillation (ENSO), with a longer timescale of oscillation (multidecadal rather than interannual) and centered in a different region (the North Atlantic rather than the tropical Pacific).
Today, in a research article published in the same journal Science, my colleagues and I have provided what we consider to be the most definitive evidence yet that the AMO doesn’t actually exist.
[Read more…] about The Rise and Fall of the “Atlantic Multidecadal Oscillation”Unforced Variations: Mar 2021
This month’s open thread. Northern Hemisphere Spring is on it’s way, along with peak Arctic/minimum Antarctic sea ice, undoubtedly more discussion about the polar vortex, and the sharpening up of the (currently very uncertain) ENSO forecast for the rest of this year.
Laschamps-ing at the bit
A placeholder to provide some space to discuss the paper last week (Cooper et al, 2021) on the putative climate consequences of the Laschamps Geomagnetic Excursion, some 42,000 yrs ago.
There was some rather breathless reporting on this paper, but there were also a lot of sceptical voices – not of the main new result (a beautiful new 14C dataset from a remarkable kauri tree log found in New Zealand), but of the more speculative implications – both climatically and anthropologically.
On twitter there were some good threads covering multiple aspects of the paper (and the lead author):
The paper presents some modeling of the impact of the geomagnetic change – mainly affecting solar energetic particles in the stratsophere which leads to some ozone depletion (but not much). They also model what might have happened if on top of the geomagnetic change, there was…
— Gavin Schmidt (@ClimateOfGavin) February 19, 2021
So, do you all know who the lead author is of that 42,000-yr climate event Science paper? It's this guy. https://t.co/2K50tzovAy
— Jessica Tierney (@leafwax) February 21, 2021
https://twitter.com/tinyicybubbles/status/1362743531438227457?s=20
So, I've started tracking down the citations in this Magnetodeth paper. It will be a surprise to no one that the papers on genetic bottlenecks do not support the 42,000-year-ago event that the new paper says they do.
— John Hawks (@johnhawks) February 19, 2021
But let me make a couple of different points. We have occasionally discussed the Laschamps event here as a counter-example to the notion that changes in galactic cosmic rays have a major impact on climate. A reversal or near-reversal of the geomagnetic field would be expected to greatly increase the GCR getting to the lower atmosphere – in far greater amounts than over a solar cycle, or grand solar minimum (like the Maunder Minimum). So if people want to postulate a big role for GCR there, they needed to explain why there wasn’t a much bigger signal at 42kya too. These authors are thus not the only people to have looked for significant climate impacts at this time. They are perhaps the first to claim to have found them…
To be clear, the modeling that was done in this paper was good (if extreme) and suggested that the geomagnetic event combined with a severe grand solar minimum (much bigger than the Maunder minimum) would cause significant depletion of the ozone layer and some shifts in the annular modes. But the ozone depletion is less than we’ve seen due to anthropogenic ozone depletion since the 1980s, and the surface climate changes don’t seem very significant at all – especially compared to the massive variability exhibited in the ice cores throughout the last ice age (particularly in Marine Isotope Stage 3 – the Dansgaard-Oeschgar events). At best these are nuanced and subtle climate effects, and certainly not anything apocalyptic (despite Stephen Fry’s dulcet tones).
Finally, it should be called the Laschamps event (with a final, and etymologically correct, ‘s’) after the village in the Auvergne where it was first identified. There is unfortunately 50 years of legacy references to the “Laschamp” excursion, but hopefully it isn’t too late to fix!
References
- A. Cooper, C.S.M. Turney, J. Palmer, A. Hogg, M. McGlone, J. Wilmshurst, A.M. Lorrey, T.J. Heaton, J.M. Russell, K. McCracken, J.G. Anet, E. Rozanov, M. Friedel, I. Suter, T. Peter, R. Muscheler, F. Adolphi, A. Dosseto, J.T. Faith, P. Fenwick, C.J. Fogwill, K. Hughen, M. Lipson, J. Liu, N. Nowaczyk, E. Rainsley, C. Bronk Ramsey, P. Sebastianelli, Y. Souilmi, J. Stevenson, Z. Thomas, R. Tobler, and R. Zech, "A global environmental crisis 42,000 years ago", Science, vol. 371, pp. 811-818, 2021. http://dx.doi.org/10.1126/science.abb8677
Regional information for society (RifS) and unresolved issues
It’s encouraging to note the growing interest for regional climate information for society and climate adaptation, such as recent advances in the World Climate Research Programme (WCRP), the climate adaptation summit CAS2021, and the new Digital Europe. These efforts are likely to boost the Global Framework for Climate Services (GFCS) needed as a guide to decision-makers on matters influenced by weather and climate.
[Read more…] about Regional information for society (RifS) and unresolved issues