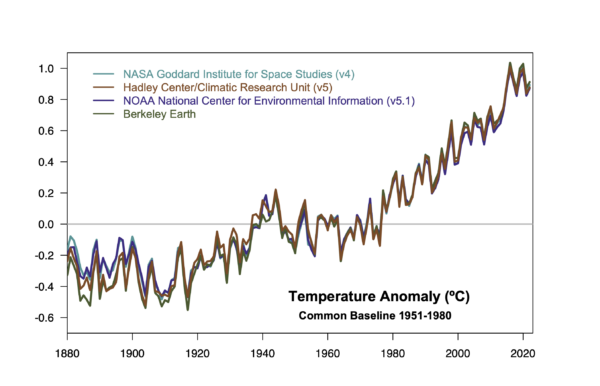
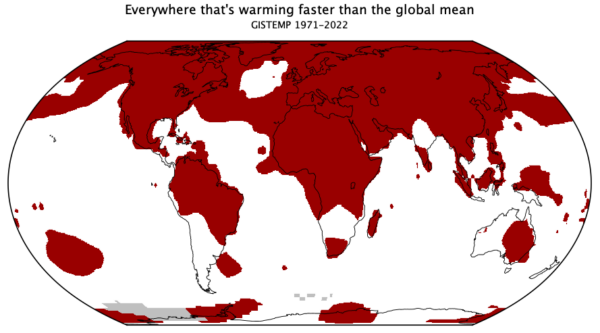
At the COP26 gathering last week much of the discussion related to “Net-Zero” goals. This concept derives from important physical science results highlighted in the Special Report on 1.5ºC and more thoroughly in the last IPCC report that future warming is tied to future emissions, and that warming will effectively cease only once anthropogenic CO2 emissions are balanced by anthropogenic CO2 removals. But some activists have (rightly) pointed out that large-scale CO2 removals are as yet untested, and so reliance on them to any significant extent to balance out emissions is akin not really committing to net zero at all. Their point is that “net-zero” is not zero and hence will serve as a smokescreen for insufficient climate action. To help sort this out some background might be helpful.
[Read more…] about Net Zero/Not ZeroClimate Science
Unforced variations: Nov 2021
This month’s open thread. The first two weeks will be dominated by COP-26, and various science updates that will be announced there, including this year’s Global Carbon Project report. Curiously, there is some archival interest in the climategate affair possibly in connection to COP-26 (a BBC dramatization “The Trick“, a BBC radio series on the security aspects “The Hack that Changed the World”, and a couple of months ago, a podcast episode of “Cheat!”). Please stick to science-related topics on this thread.
A science-based move to climate change adaptation
All countries in the world urgently need to adapt to climate change but are not yet in a good position to do so. It’s urgent because we are not even adapted to the present climate. This fact is underscored by recent weather-related calamities, such as flooding in Central Europe and heatwaves over North America. It’s also urgent because the oceans act like a flywheel, making sure that cuts in emission of greenhouse gases will have a lagged effect on global warming.
Climate change adaptation was addressed in the Paris Agreement from 2015, the Climate Adaptation Summit in January 2021, and will be one of four key priorities during the upcoming COP26. Proper climate adaptation of course needs meteorological and climatological data for mapping weather-related risks to prepare us for future extreme weather. However, I would argue that the climate research community has not had a visible presence during any of these meetings. Instead the summits have been dominated by politicians and NGOs.
[Read more…] about A science-based move to climate change adaptationTributes to Geert Jan van Oldenborgh
As many of you will know, Geert Jan van Oldenborgh died on Oct 12, 2021, and in the last week a number of very touching tributes have appeared. Notably, a lovely obituary in the NY Times by Henry Fountain, a segment on the BBC’s Inside Science from Roland Pease, a piece on Bloomberg News by Eric Roston and, of course, an appreciation from his colleagues at World Weather Attribution (including Friederike Otto, the co-recipient of the TIME 100 award to Geert earlier this year).
Geert’s work had been featured often at RealClimate (notably the rapid attribution work for the Pacific North West heat wave earlier this year), and we have made frequent reference to Climate Explorer, the tool he built to provide easier access to many sources of climate data. He also provided us with annual updates for the comparison between a 1981 climate projection to subsequent observations.
He let us know earlier this year that this was likely the last update. Moge hij rusten in vrede.
A Nobel pursuit
Last week, the Nobel physics prize was (half) awarded to Suki Manabe and Klaus Hasselmann for their work on climate prediction and the detection and attribution of climate change. This came as quite a surprise to the climate community – though it was welcomed warmly. We’ve discussed the early climate model predictions a lot (including some from Manabe and his colleagues), and we’ve discussed detection and attribution of climate change as well, though with less explicit discussion of Hasselmann’s contribution. Needless to say these are big topics which have had many inputs from many scientists over the years.
But RC has a more attuned audience to these topics than most, and so it might be fun to dive into the details of their early work to see what has stood the test of time and what has not, and how that differs (if it does) from their colleagues and rivals at the time.
[Read more…] about A Nobel pursuitUnforced Variations: Oct 2021
Fall is here (in the northern hemisphere at least), along with articles about the impact of climate change on autumnal colors. LandSat9 successfully launched to continue an almost 50 year long series of remote sensing (since 1972!), and the World Economic Forum has proposed and Earth Operations Center to monitor greenhouse gases and climate change. Please stick to climate science topics, and remember that (most) other commenters are real people.
The definitive CO2/CH4 comparison post
There is a new push to reduce CH4 emissions as a possible quick ‘win-win’ for climate and air quality. To be clear this is an eminently sensible idea – as it has been for decades (remember the ‘Methane-to-markets’ initiative from the early 2000s?), but it inevitably brings forth a mish-mash of half-remembered, inappropriate or out-of-date comparisons between the impacts of carbon dioxide and methane. So this is an attempt to put all of that in context and provide a hopefully comprehensive guide to how, when, and why to properly compare the two greenhouse gases.
[Read more…] about The definitive CO2/CH4 comparison postUnforced Variations: Sep 2021
This month’s open thread for climate science topics. Not sure about you, but we are still reading the details of the IPCC report. We are watching the unfolding hurricane season with trepidation, with particular concern related to the impacts of compound events (and not just those associated with climate), and anticipating another low, if not record, Arctic sea ice minimum.
PS. At some point this month we will be switching Internet service providers, so don’t be surprised if there are some oddities as we switch everything over.
Sea level in the IPCC 6th assessment report (AR6)
My top 3 impressions up-front:
- The sea level projections for the year 2100 have been adjusted upwards again.
- The IPCC has introduced a new high-end risk scenario, stating that a global rise “approaching 2 m by 2100 and 5 m by 2150 under a very high greenhouse gas emissions scenario cannot be ruled out due to deep uncertainty in ice sheet processes.”
- The IPCC gives more consideration to the large long-term sea-level rise beyond the year 2100.
And here is the key sea-level graphic from the Summary for Policy Makers:
This is a pretty clear illustration of how sea level starts to rise slowly; but in the long run, sea-level rise caused by fossil-fuel burning and deforestation in our generation could literally go off the chart and inundate many coastal cities and wipe entire island nations off the map. But first things first.
Observed Past Rise
Let’s dive a little deeper into the full report and start with the observed sea level change. Since 1901 sea level has risen by 20 cm, a rise unprecedented in at least 3,000 years (disclosure: I co-authored some of the research behind the latter conclusion).
Since 1900 the rise has greatly accelerated. During the most recent period analyzed, 2006-2018, it’s been rising at a rate of 3.7 mm/year – nearly three times as fast as during 1901-1971 (1.3 mm/year). The IPCC calls this a “robust acceleration (high confidence) of global mean sea level rise over the 20th century”, as did the SROCC in 2019.
The finding of sea-level acceleration is not new. The AR4 already concluded in 2007: “There is high confidence that the rate of sea level rise has increased between the mid-19th and the mid-20th centuries.” And the AR5 found in 2013 that “there is high confidence that the rate of sea level rise has increased during the last two centuries, and it is likely that global mean sea level has accelerated since the early 1900’s.” (Which has not stopped “climate skeptics” from repeatedly claiming a lack of acceleration.)
The reason for earlier hedged wording by the IPCC was the possibility of natural decadal variability affecting the trend estimates, but the AR6 now concludes “that the main driver of the observed global mean sea-level rise since at least 1970 is very likely anthropogenic forcing”. That is the result of so-called “attribution studies” – attempts to differentiate with the help of a combination of data, models, pattern detection and statistics between all possible human-caused and natural factors in the observed changes. However, on the level of basic physical reasoning, it is of course a no-brainer that warming will cause land-ice to melt (and melt faster as it gets hotter) and ocean waters to expand, so sea-level rise is the inevitable result.
And there is this:
New observational evidence leads to an assessed sea level rise over the period 1901 to 2018 that is consistent with the sum of individual components contributing to sea level rise, including expansion due to ocean warming and melting of glaciers and ice sheets (high confidence).
IPCC AR6
That’s an important consistency check; the independent data add up to the overall observed rise.
The Future Until 2100
It is virtually certain that global mean sea level will continue to rise over the 21st century in response to continued warming of the climate system.
IPCC AR6
By how much? That depends on our emissions and is shown in the following figure. The take-away message is: for high emissions we’d likely get close to a meter, sticking to the Paris agreement would cut that down to half a meter.
And how does that compare to the recent previous reports? Here is the comparison the IPCC shows:
If you look at the 2100 projections for the last three reports (AR5, SROCC, AR6) you can see that the numbers have increased each time – and remember that the AR5 numbers had already increased by ~60% compared to the AR4. This illustrates the fact that IPCC has been too “cautious” in the past (which is not a virtue in risk assessment), having to correct itself upward again and again (all the while “climate skeptics” try to paint the IPCC as “alarmist”, for want of any better arguments to play down the climate crisis).
Related to that are notable changes in grappling with uncertainty and risk. The IPCC is now showing very likely (5-95 percentile) as well as likely (17-83 percentile) ranges. In the AR5, it had made the rather ad-hoc argument that “global mean sea level rise is likely (medium confidence) to be in the 5 to 95% range of projections from proces-based models”. So their likely range was actually the modelled very likely range.
The IPCC now splits the uncertainty into two types, hence the two different shadings in the uncertainty bars, in an attempt to also cover uncertainty in processes which we still cannot confidently model. They write:
Importantly, likely range projections do not include those ice-sheet-related processes whose quantification is highly uncertain or that are characterized by deep uncertainty. Higher amounts of global mean sea level rise before 2100 could be caused by earlier-than-projected disintegration of marine ice shelves, the abrupt, widespread onset of Marine Ice Sheet Instability (MISI) and Marine Ice Cliff Instability (MICI) around Antarctica, and faster-than-projected changes in the surface mass balance and dynamical ice loss from Greenland. In a low-likelihood, high-impact storyline and a high CO2 emissions scenario, such processes could in combination contribute more than one additional meter of sea level rise by 2100.
Note that this uncertainty goes to one side: up. For estimating this uncertainty they use an expert survey as well as a smaller but more detailed structured expert judgement. I co-authored the survey (see also 7-minute video about it) with Ben Horton and others, as well as a predecessor survey published in 2014, and I am happy to see that the IPCC now includes this type of expert judgement to assess risks that can’t yet be modelled reliably, but cannot be just ignored either. In dealing with the climate crisis, it simply is not enough to consider what is likely to happen – it is even more important to understand what the risks are.
Think about it: If someone builds a nuclear facility near to your house, would you be satisfied with knowing that it is “likely” to work well (say, 83% certain)? Or would you like to know about a few percent chance that it could blow up like Chernobyl in your lifetime?
With the high-end risk scenarios, the IPCC is catching up with other assessments such as the US National Climate Assessment of 2017, which already showed a “high” scenario of 2 meters and an “extreme” scenario of 2.5 meters of rise by 2100.
The Long Term Future
One of the headline statements of the AR6 is:
Many changes due to past and future greenhouse gas emissions are irreversible for centuries to millennia, especially changes in the ocean, ice sheets and global sea level.
IPCC AR6
That’s because huge ice sheets take a long time to melt in a warmer climate, and the ocean waters take a long time to warm up as you go further down, away from the surface. So by what we are doing now in the next couple of decades we determine the rate and amount of sea-level rise for millennia to come, condemning many generations to continually changing coastlines and forcing them to abandon many coastal cities, large and small. That we cannot turn this back is the reason why the precautionary principle should be applied to the climate crisis.
Just look at the ranges expected by the year 2300, in the right-hand panel of the first image above. Even in the blue mitigation scenario, which limits warming to well below 2 °C, our descendants may well have to deal with 2-3 meters of sea-level rise, which would be catastrophic for the people living at the world’s coastlines. Not only would it be extremely hard and costly – if possible at all – to defend cities like New York during a storm surge with a so much higher sea level. We would see massive coastal erosion happening all around. And remember that “nuisance flooding” is already causing real problems after just 20 cm of sea-level rise, for example along the eastern seaboard of the US!
At least with this Paris scenario and a good portion of sheer luck, we may get away with less than a meter rise. But with further unmitigated increase in emissions, a desastrous 2 meter rise is about as likely as an utterly devastating 7 meter rise. What would our descendants think we were doing?
A deep dive into the IPCC’s updated carbon budget numbers
Guest post by Joeri Rogelj (Twitter: @joerirogelj)
Since temperature targets became international climate goals, we have been trying to understand and quantify the implications for our global emissions. Carbon budgets play an important role in this translation.
Carbon budgets tell us how much CO2 we can emit while keeping warming below specific limits. We can estimate the total carbon budget consistent with staying below a given temperature limit. If we subtract the CO2 emissions that we emitted over the past two centuries, we get an estimate of the remaining carbon budget.
I have been involved in the estimation of carbon budgets since the IPCC Fifth Assessment Report in the early 2010s. And since the first IPCC estimates published in 2013, we have learned a lot and have gotten much better at estimating remaining carbon budgets. In the 2018 IPCC Special Report on Global Warming of 1.5°C (SR1.5), the latest insights were integrated in a simple framework that allowed to estimate, track, and understand updates to these carbon budgets.
The most recent Working Group 1 Report of the IPCC Sixth Assessment Cycle (WG1 AR6) provides an updated assessment of the remaining carbon budget. Here’s an insider’s view providing a deep dive into how they differ from previous reports.
The scientific basis underlying a carbon budget is our robust scientific understanding that global warming is near-linearly proportional to the total amount of CO2 we ever emit as a society. This is illustrated in Fig. SPM10 of the WG1 AR6 report, both for the past and for future projections.
The estimates of remaining carbon budgets also made it into the Summary for Policymakers – the most prominent place that can be given for any finding of the report. Table SPM.2 gives an overview of the latest estimates, for different temperature limits and different probability levels.
How have these estimates changed since previous reports?
IPCC reported carbon budgets for the first time in 2013. And since, important advances have been made in how we estimate these. Five puzzle pieces combine to give carbon budget estimates, and allow us now to understand subsequent updates.
Starting with the key message of the AR6 carbon budget update: carbon budget estimates in AR6 are very similar to those published in the SR1.5 in 2018, but they represent a significant update since AR5 in 2013.
When adjusting for the emissions since AR5 and SR1.5, AR6 remaining carbon budget for limiting warming to 1.5C with 50% chance is about 300 GtCO2 larger than in AR5, but virtually the same as in SR1.5.
For 66% probability, the AR6 budget is about 60 GtCO2 larger than in SR1.5.
The budget is so much larger than in AR5, because since 2013 more accurate methods have been published that ensure that model uncertainties over the historical period are not accumulated into the future. This is best illustrated by this technical figure from SR1.5.
Between SR1.5 and AR6 every piece of the carbon budget was reassessed:
- warming to date
- how much warming we expect to get per tonne of CO2
- how much warming would still occur once we reach net zero CO2
- how much non-CO2 warming we can expect
- Earth system feedback otherwise not covered
Let’s dive into each piece of this puzzle to understand what has changed between SR1.5 and AR6.
Warming to date – SR1.5 used a 0.97°C warming estimate between 1850-1900 and 2006-2015. This estimate already included corrections for the incomplete global coverage of observations and the different ways in which global surface temperature can be estimated. The AR6, based on a full reassessment of all available data, assesses 0.94°C of global surface temperature increase for the same period.
In isolation, this update results in central estimates being about 65 GtCO2 larger in AR6 than in SR15. For the 33% and 67% estimates that’s about 110 and 50 GtCO2 higher, respectively.
Warming per tonne of CO2 – The next piece of the puzzle is the warming we project per tonne of CO2. SR1.5 used an estimate of 0.8-2.5°C per 1000 GtC (=3664 GtCO2). AR6 assessed this quantity, also known as the Transient Climate Response to Cumulative Emissions of CO2 (or TCRE), to fall in the 1.0-2.3°C range.
Having the same central estimate, the update in TCRE causes no shift in 50% estimates, but the higher and lower percentiles are narrowed. For a 67% chance, AR6 estimates are about 50 and 100 GtCO2 larger compared to SR1.5 for 1.5°C and 2°C of global warming, respectively.
Warming after net zero CO2 – The third piece of the puzzle is the how much warming is expected to still occur once global CO2 emissions reach (and remain at) net zero. This is known as the Zero Emissions Commitment to emissions of CO2 (or ZEC).
The AR6 estimate confirms the SR1.5 estimate of no further CO2-induced warming or cooling once global CO2 emissions reach and stay at next zero. The uncertainty surrounding this value are reported separately. ZEC therefore causes no changes between SR1.5 and AR6.
Non-CO2 warming contribution – The fourth puzzle piece is the projected warming from non-CO2 emissions. As SR1.5, AR6 uses deep mitigation pathways assessed by SR1.5 (Rogelj et al, 2018; Huppmann et al, 2018), but with climate projections updated entirely with dedicated climate emulators that integrate the scientific information across chapter.
By coincidence (and it is really coincidence), the updates in radiative forcing from tens of different gases, climate sensitivity, and carbon-cycle uncertainties result in no net shift in the estimate of non-CO2 warming for the remaining carbon budget.
Pure luck, given the many updated pieces of scientific knowledge that were integrated in AR6, but convenient for explaining differences in carbon budget estimates.
Updated non-CO2 warming estimates lead to no change in remaining carbon budget estimates compares to SR1.5.
Other Earth system feedbacks – The last piece is to account for Earth system feedbacks that would otherwise not be covered. SR1.5 assumed an additional blanket reduction of 100 GtCO2 for this century for these feedbacks. This was a crude estimate and therefore not included as a central part of the remaining carbon budget numbers in SR1.5 AR6 updates this assessment entirely and includes this contribution in its main estimates.
Taking into account not only permafrost thaw, but also a host of other biogeochemical and atmospheric feedbacks, the AR6 estimates to appropriately include the effect of all these feedbacks, remaining carbon budgets have to be reduced by 26 ± 97 GtCO2 per degree Celsius of additional warming.
Altogether these updates mean AR6 remaining carbon budget estimates are very similar compared to SR1.5, while they additionally include the effect of Earth system feedbacks that would otherwise not be covered.
Selecting a remaining carbon budget requires two normative choices as a minimum: the global warming level that is to be avoided, and the likelihood or chance with which this is achieved. Further choices involve how deeply non-CO2 emissions can be reduced.
In addition to updates to science underlying carbon budget estimates, the AR6 also provides a larger set of likelihood levels for its remaining carbon budget estimates (see Table SPM.2 above). As in previous reports, AR6 provides remaining carbon budget estimates for a 33%, 50%, and 67% chance of keeping warming to a given temperature limit. In addition, however, the AR6 also provides the bracketing percentiles for the central 66% range (the range covered between 17% and 83%), so that the uncertainty of the central estimate can be adequately understood.
These values can be used in a variety of ways. For example, the central estimate for the remaining carbon budget for keeping warming to 1.5°C is now 500 GtCO2 starting from the beginning of 2020, with a 66% uncertainty range of 300–900 GtCO2.
Designing a policy for limiting warming to 1.5°C with this global 500 GtCO2 number in mind means that in 1-out-of-2 cases warming will end up below and in 1-out-of-2 cases it will end up above 1.5°C. Alternatively, it can also be understood to mean that in 1-out-of-2 cases policy measures will have to be sharpened beyond the policies consistent with a 500 GtCO2 budget over the coming decades if warming is effectively to be kept to 1.5°C. Similar examples can be given for 1.7°C or other levels (see Table 5.8 in the underlying chapter; Canadell et al (2021)).
A last item affecting the selection of remaining carbon budgets is the expectation of how deeply non-CO2 emissions can be reduced. All remaining carbon budget estimates in AR6 assume that non-CO2 emissions such as methane are reduced consistent with a deep decarbonisation pathway that reaches net zero CO2 emissions. Depending on how effectively these non-CO2 emissions can be reduced, the remaining carbon budgets can vary by 220 GtCO2 or more.
Bottom line of this technical explanation remains, however, that these budgets are small, our current annual global CO2 emissions of about 40 GtCO2/yr are reducing them rapidly, and all budgets require CO2 to decline to net zero while global emissions have not yet shown to decline.
It’s nice to have remaining carbon budgets, but now we need to get on with it and make sure that global CO2 emissions start to decline.
If you would like to know all the ins and outs of AR6 remaining carbon budgets have a look at Section 5.5 in Canadell et al (2021). The entire section describes the assessment of TCRE and remaining carbon budgets, while Box 5.2 presents a more technical comparison with carbon budget estimates from previous reports.
Joeri Rogelj is Director of Research, Grantham Institute Climate Change & Environment, Imperial College London, UK, and Senior Research Scholar, International Institute for Applied Systems Analysis (IIASA), Laxenburg, Austria
Parts of this post have been published earlier as a twitter thread.
References
Huppmann, D., Rogelj, J., Kriegler, E., Krey, V., et al. (2018) A new scenario resource for integrated 1.5 °C research. Nature Climate Change. [Online] 8 (12), 1027–1030. Available from: doi:10.1038/s41558-018-0317-4.
Josep G. Canadell, J. G., P. M.S. Monteiro, M. H. Costa, L. Cotrim da Cunha, P. M. Cox, A. V. Eliseev, S. Henson, M. Ishii, S. Jaccard, C. Koven, A. Lohila, P. K. Patra, S. Piao, J. Rogelj, S. Syampungani, S. Zaehle, K. Zickfeld, 2021, Global Carbon and other Biogeochemical Cycles and Feedbacks. In: Climate Change 2021: The Physical Science Basis. Contribution of Working Group I to the Sixth Assessment Report of the Intergovernmental Panel on Climate Change [Masson-Delmotte, V., P. Zhai, A. Pirani, S. L. Connors, C. Péan, S. Berger, N. Caud, Y. Chen, L. Goldfarb, M. I. Gomis, M. Huang, K. Leitzell, E. Lonnoy, J. B. R. Matthews, T. K. Maycock, T. Waterfield, O. Yelekçi, R. Yu and B. Zhou (eds.)]. Cambridge University Press. In Press.
IPCC (2014) Climate Change 2014: Synthesis Report. Contribution of Working Groups I, II and III to the Fifth Assessment Report of the Intergovernmental Panel on Climate Change.
IPCC, 2021: Summary for Policymakers. In: Climate Change 2021: The Physical Science Basis. Contribution of Working Group I to the Sixth Assessment Report of the Intergovernmental Panel on Climate Change [MassonDelmotte, V., P. Zhai, A. Pirani, S. L. Connors, C. Péan, S. Berger, N. Caud, Y. Chen, L. Goldfarb, M. I. Gomis, M. Huang, K. Leitzell, E. Lonnoy, J. B. R. Matthews, T. K. Maycock, T. Waterfield, O. Yelekçi, R. Yu and B. Zhou (eds.)]. Cambridge University Press. In Press
Rogelj, J., Shindell, D., Jiang, K., Fifita, S., et al. (2018) Mitigation pathways compatible with 1.5°C in the context of sustainable development. In: Greg Flato, Jan Fuglestvedt, Rachid Mrabet, & Roberto Schaeffer (eds.). Global Warming of 1.5 °C: an IPCC special report on the impacts of global warming of 1.5 °C above pre-industrial levels and related global greenhouse gas emission pathways, in the context of strengthening the global response to the threat of climate change, sustainable development, and efforts to eradicate poverty. [Online]. Geneva, Switzerland, IPCC/WMO. pp. 93–174. Available from: http://www.ipcc.ch/report/sr15/.