One thing a scientist doesn’t want to mess up is the problem of multiplicity (also known as ‘field significance‘). It’s just like rolling a die 600 times, and then getting excited about getting roughly 100 sixes. However, sometimes it’s much more subtle than just rolling dice.
This problem seems to be an issue in a recent by paper with the title ‘Evidence for solar forcing in variability of temperatures and pressures in Europe‘ by Le Mouel et al. (2009) in the Journal of Atmospheric and Solar-Terrestrial Physics.

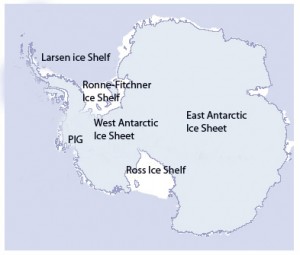
 It is popularly understood that glaciologists consider West Antarctica the biggest source of uncertainty in sea level projections. The base of the 3000-m thick West Antarctic Ice Sheet (WAIS) – unlike the much larger East Antarctic Ice Sheet – lies below sea level, and it has been recognized for a long time that this means it has the potential to change very rapidly. Most of the grounded West Antarctic ice sheet drains into the floating Ross and Ronne-Filchner ice shelves, but a significant fraction also drains into the much smaller Pine Island Glacier. Glaciologists are paying very close attention to Pine Island Glacier (“PIG” on map, right) and nearby Thwaites Glacier. In the following guest post, Mauri Pelto explains why.
