• Skip to primary navigation
  • Skip to main content
  • Skip to primary sidebar
  • Skip to footer

RealClimate

Climate science from climate scientists...

  • Start here
  • Model-Observation Comparisons
  • Miscellaneous Climate Graphics
  • Surface temperature graphics
You are here: Home / Archives for Climate Science

Climate Science

Keystone XL: Game over?

2 Nov 2011 by raypierre

Translations: (Deutsch) (Español) (English)

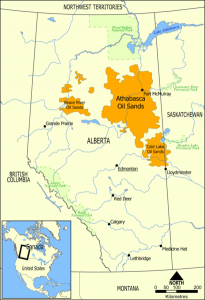
The impending Obama administration decision on the Keystone XL Pipeline, which would tap into the Athabasca Oil Sands production of Canada, has given rise to a vigorous grassroots opposition movement, leading to the arrests so far of over a thousand activists. At the very least, the protests have increased awareness of the implications of developing the oil sands deposits. Statements about the pipeline abound.

Jim Hansen has said that if the Athabasca Oil Sands are tapped, it’s “essentially game over” for any hope of achieving a stable climate. The same news article quotes Bill McKibben as saying that the pipeline represents “the fuse to biggest carbon bomb on the planet.” Others say the pipeline is no big deal, and that the brouhaha is sidetracking us from thinking about bigger climate issues. David Keith, energy and climate pundit at Calgary University, expresses that sentiment here, and Andy Revkin says “it’s a distraction from core issues and opportunities on energy and largely insignificant if your concern is averting a disruptive buildup of carbon dioxide in the atmosphere”. There’s something to be said in favor of each point of view, but on the whole, I think Bill McKibben has the better of the argument, with some important qualifications. Let’s do the arithmetic.

[Read more…] about Keystone XL: Game over?

Filed Under: Carbon cycle, Climate Science

MJO Conversations

1 Nov 2011 by Gavin

There is a (relatively) new blog from scientists involved in a big research program (DYNAMO) looking into the Madden-Julian Oscillation (MJO). Called Madden-Julian Conversations, it is run by Adam Sobel and Daehyun Kim (Columbia), Zhiming Kuang (Harvard) and Eric Maloney (Colorado State).


A schematic of the MJO from cmmap.org

The MJO can be seen in eastward propagating systems of rainfall and deep convection near the equator and influencing the Indian monsoon and El Niño dynamics. Each MJO cycle takes around 30-60 days, so these events can be seen in high frequency diagnostics of cloud cover, LW radiation, rainfall etc. The blog goes into a little more detail of what the MJO is (part i, and parts ii, iii, iv and v), (note that is sometimes referred to as the Intra-seasonal Oscillation or ISO), as well as descriptions of the DYNAMO program and what atmospheric scientists working in the field actually get up to.


(but note that apparently a helmet is not actually required for modelers to launch radiosondes).

This is exactly the kind of thing that should become more common – scientists actually showing the world directly what their research involves and the process that we follow to find stuff out. This will make a great backdrop to the rather dryer contributions to the technical literature that will come from this.

Filed Under: Climate Science, Communicating Climate

Unforced variations: Nov 2011

31 Oct 2011 by group

Once more unto the open thread…

Filed Under: Climate Science, Open thread

The Climate Data Guide

30 Oct 2011 by Jim

The National Center for Atmospheric Research (NCAR) has, in the last few months, developed an interesting and potentially very useful website The Climate Data Guide devoted to the ins and outs of obtaining and analyzing the various existing climatic data sets. The site describes itself as “…a focal point for expert-user guidance, commentary, and questions on the strengths and limitations of selected observational data sets and their applicability to model evaluations.”

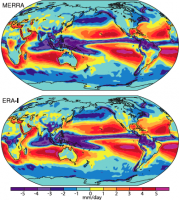
There are already many climate data set websites in existence, and lists of links to same, including at this site. Some of them host the actual data, while others provide various statistical analysis or graphing/visualization tools, all of which are helpful. What makes this new site unique is: (1) expert users contribute pages describing and pointing to various existing data sources within certain topic areas, (2) explanations of various existing data formats, gridding approaches, etc, (3) an online discussion forum dealing with the appropriateness of particular data sets for addressing particular scientific questions, and (4) a news section as well as links to a very wide range of data repositories, among other things. Here for example, is the page summarizing the existing reanalysis data sets.

The site, sponsored by the NSF, appears to be a unique and valuable approach to advancing climate data analysis. We encourage everyone to check it out, register as members as appropriate, etc. This would also be a good place to discuss or point to other useful data and analysis oriented sites that are out there.

Filed Under: Climate Science, Instrumental Record, Scientific practice

NPP lift off

28 Oct 2011 by Gavin

The launch of the NASA/NOAA NPP satellite seems to have gone off without a hitch this morning which is great news. This satellite has instruments that are vital to continuing data streams that were pioneered on the aging TERRA (1999), AQUA (2002) and AURA (2004), satellites – including the CERES instrument for monitoring the Earth’s radiation budget, a microwave sounder to continue the AMSU data and a visible/IR camera to complement the work of MODIS.

We really need to apologise for the acronym soup though – it is an endemic disease in satellite discussions. Indeed, NPP is a recursive acronym, standing for NPOESS Preparatory Project, where NPOESS stands for the National Polar-Orbiting Operational Environmental Satellite System.

Another satellite mission we’ve mentioned here, Aquarius (launched in June), has recently released its first results on ocean salinity:


The patterns are not particularly surprising, there is higher salinity in the sub-tropical evaporative regions, lower salinity near the equator (because of the rain!), and particularly low salinity near big river outflows (the Amazon plume stands out clearly). However, as we noted earlier, the main interest is going to be in the variability.

Results from the NPP mission will take a while to come out and be cross-calibrated with the existing records, but given other recent disappointments (GLORY and OCO), this is a huge boost to the effort to monitor the Earth System.

Filed Under: Climate Science, Instrumental Record

The Moscow Warming Hole

26 Oct 2011 by Stefan

This week, PNAS published our paper Increase of Extreme Events in a Warming World, which analyses how many new record events you expect to see in a time series with a trend. It does that with analytical solutions for linear trends and Monte Carlo simulations for nonlinear trends.

A key result is that the number of record-breaking events increases depending on the ratio of trend to variability. Large variability reduces the number of new records – which is why the satellite series of global mean temperature have fewer expected records than the surface data, despite showing practically the same global warming trend: they have more short-term variability.

Another application shown in our paper is to the series of July temperatures in Moscow. We conclude that the 2010 Moscow heat record is, with 80% probability, due to the long-term climatic warming trend. [Read more…] about The Moscow Warming Hole

Filed Under: Climate Science

Berkeley earthquake called off

24 Oct 2011 by eric

Anybody expecting earthshaking news from Berkeley, now that the Berkeley Earth Surface Temperature group being led by Richard Muller has released its results, had to be content with a barely perceptible quiver. As far as the basic science goes, the results could not have been less surprising if the press release had said “Man Finds Sun Rises At Dawn.” This must have been something of a disappointment for anyone hoping for something else.

[Read more…] about Berkeley earthquake called off

Filed Under: Climate Science

A Well Deserved Honor

18 Oct 2011 by group

The rest of us here would like to congratulate Gavin on a well-deserved honor. He is the recipient of the inaugural AGU Climate Communication Prize. Since co-founding RealClimate back in 2004, Gavin has emerged as the de facto leader of RealClimate, having written the majority of our posts–and many of our best ones. One of his very first contributions “Michael Crichton’s State of Confusion” remains one of our most highly cited posts. One of his most recent, about what the recent CERN experiments do (and don’t) tell us about cloud processes, is a good example of his characteristic knack for explaining complex scientific issues with clarity and wit. Gavin also takes the lead role in dealing with the comments on RC posts. His almost non-stop, patient, response to the flood of comments that ensued in the week following the CRU email server hack in late 2009 impressed us all.

Gavin’s communication efforts, of course, go well beyond RealClimate. He is frequently quoted in mainstream news venues and often appears on radio and television news programs, to help communicate key aspects of climate science to the public. Here he is in an interview articulating both the science and the history of the science, and putting the recent politicizing of climate science into context. (It’s worth watching this interview to the end, by the way, for some thoughts on what you can do to improve communication of climate science.) He’s also produced a very accessible and beautiful book, Climate Change: Picturing the Science (with photographer Josh Wolfe).

Gavin’s efforts go well beyond the classic ‘public understanding of science’, since what he so successfully promotes is the ‘public understanding of research’. He makes it understandable and tangible how scientists work and think, not just what their results are. Gavin is a champion of easy access to data: see our Realclimate section on data sources. And, of course, a champion of making good use of the available data: see his many articles where he explains how particular questions (such as whether climate models agree with data) should not be speculated about but can be answered by anyone with basic skills simply by using publicly available data archives. Gavin’s work is often about empowering people to draw their own conclusions.

All of this is based on a solid foundation of his own scientific research: Gavin is a top-notch climatologist with an excellent publication record (h-index: 33), and we and our colleagues refer frequently to Gavin’s numerous papers in our own research and teaching. We only sometimes wonder whether his days have 30 hours, or how he finds the time to achieve all this.

Of course we’re a bit biased here at RealClimate, but it is truly hard to imagine a more deserving recipient for this award than Gavin.

Congratulations, once again, to our colleague and friend.

Mike Mann, Eric Steig, Stefan Rahmstorf, Jim Bouldin, Ray Pierrehumbert, David Archer, and the rest of RealClimate

Filed Under: Climate Science, Communicating Climate

The high cost of inaction

14 Oct 2011 by Jim

In 2004 Stephen Pacala and Robert Socolow published a paper in Science in which they argued that a pragmatic, but still difficult, way of stabilizing atmospheric CO2 levels over the long term was via the implementation of seven “stabilization wedges” over the next 50 years. The idea was very simple: each wedge represented one in-hand technology or societal practice that could be implemented, relatively slowly at first and increasing linearly with time, to make a small but growing dent in the rise in CO2 emissions, stabilizing them at 2004 levels (about 7 Gigatons C/Year) over the next 50 years (see figure below).
[Read more…] about The high cost of inaction

Filed Under: Greenhouse gases

Speculative polar cartography

5 Oct 2011 by group

Guest commentary from Kevin Brown

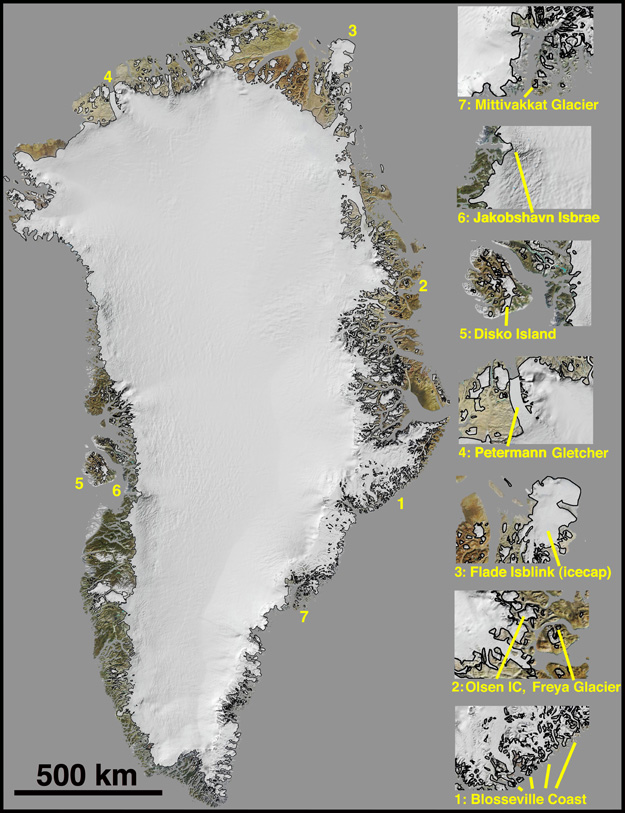
The curious mismapping of Greenland’s ice sheet cover by the venerable Times Atlas recently has excited a lot of outraged commentary. But few people noted that this follows an old tradition of speculative cartography of the polar regions. ‘Modern’ mapmakers as early as the 16th century combined real facts and scientific knowledge with fundamental misinterpretations of that knowledge to create speculative mappings of the world’s unknown shores – and nowhere was this more prevalent than at the poles.

Early cartographers had a particularly difficult time mapping the Polar Regions. Factually, they based their maps on reports from mariners who dared sail the dangerous waters. This was supplemented by information from earlier maps, speculations based upon their personal theories of geography, religious beliefs, and the fiscal and political ambitions of their patrons.
[Read more…] about Speculative polar cartography

Filed Under: Arctic and Antarctic

  • « Go to Previous Page
  • Page 1
  • Interim pages omitted …
  • Page 63
  • Page 64
  • Page 65
  • Page 66
  • Page 67
  • Interim pages omitted …
  • Page 128
  • Go to Next Page »

Primary Sidebar

Search

Search for:

Email Notification

get new posts sent to you automatically (free)
Loading

Recent Posts

  • Time and Tide Gauges wait for no Voortman
  • Lil’ NAS Express
  • DOE CWG Report “Moot”?
  • Climate Scientists response to DOE report
  • Critique of Chapter 6 “Extreme Weather” in the DOE review
  • Unforced Variations: Sep 2025

Our Books

Book covers
This list of books since 2005 (in reverse chronological order) that we have been involved in, accompanied by the publisher’s official description, and some comments of independent reviewers of the work.
All Books >>

Recent Comments

  • Ken Towe on Lil’ NAS Express
  • Nick Palmer on Lil’ NAS Express
  • Dan on Lil’ NAS Express
  • Silvia Leahu-Aluas on Lil’ NAS Express
  • Silvia Leahu-Aluas on Lil’ NAS Express
  • b fagan on DOE CWG Report “Moot”?
  • Ted Moffett on Lil’ NAS Express
  • Mo Yunus on Climate Scientists response to DOE report
  • Piotr on Unforced Variations: Sep 2025
  • Russell Seitz on DOE CWG Report “Moot”?
  • Mal Adapted on Unforced Variations: Sep 2025
  • Steven Emmerson on Unforced Variations: Sep 2025
  • Piotr on Unforced Variations: Sep 2025
  • Steven Emmerson on Climate Scientists response to DOE report
  • Mal Adapted on DOE CWG Report “Moot”?
  • b fagan on DOE CWG Report “Moot”?
  • Barton Paul Levenson on DOE CWG Report “Moot”?
  • Kevin McKinney on Unforced Variations: Sep 2025
  • Atomsk’s Sanakan on Climate Scientists response to DOE report
  • Kevin McKinney on Unforced Variations: Sep 2025
  • David on Climate Scientists response to DOE report
  • Kevin McKinney on DOE CWG Report “Moot”?
  • David on Unforced Variations: Sep 2025
  • Russell Seitz on DOE CWG Report “Moot”?
  • Mo Yunus on Unforced Variations: Sep 2025
  • Mo Yunus on Unforced Variations: Sep 2025
  • Russell Seitz on DOE CWG Report “Moot”?
  • David on Climate Scientists response to DOE report
  • Ray Ladbury on DOE CWG Report “Moot”?
  • Susan Anderson on DOE CWG Report “Moot”?

Footer

ABOUT

  • About
  • Translations
  • Privacy Policy
  • Contact Page
  • Login

DATA AND GRAPHICS

  • Data Sources
  • Model-Observation Comparisons
  • Surface temperature graphics
  • Miscellaneous Climate Graphics

INDEX

  • Acronym index
  • Index
  • Archives
  • Contributors

Realclimate Stats

1,380 posts

11 pages

246,759 comments

Copyright © 2025 · RealClimate is a commentary site on climate science by working climate scientists for the interested public and journalists.