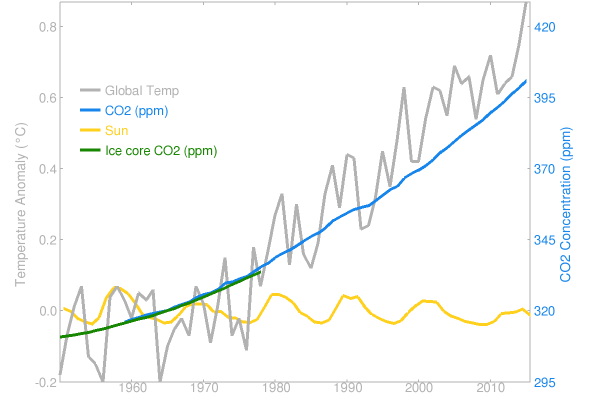
This month’s open thread. Pros and cons of celebrity awareness-raising on climate? The end of the cherry-picking of ‘pauses’ in the satellite data? Continuing impacts of El Niño? Your choice (except for the usual subjects to be avoided…).
Climate Science
Millennia of sea-level change
How has global sea level changed in the past millennia? And how will it change in this century and in the coming millennia? What part do humans play? Several new papers provide new insights.
2500 years of past sea level variations
This week, a paper will appear in the Proceedings of the National Academy of Sciences (PNAS) with the first global statistical analysis of numerous individual studies of the history of sea level over the last 2500 years (Kopp et al. 2016 – I am one of the authors). Such data on past sea level changes before the start of tide gauge measurements can be obtained from drill cores in coastal sediments. By now there are enough local data curves from different parts of the world to create a global sea level curve.
Let’s right away look at the main result. The new global sea level history looks like this:
Fig. 1 Reconstruction of the global sea-level evolution based on proxy data from different parts of the world. The red line at the end (not included in the paper) illustrates the further global increase since 2000 by 5-6 cm from satellite data. [Read more…] about Millennia of sea-level change
References
- R.E. Kopp, A.C. Kemp, K. Bittermann, B.P. Horton, J.P. Donnelly, W.R. Gehrels, C.C. Hay, J.X. Mitrovica, E.D. Morrow, and S. Rahmstorf, "Temperature-driven global sea-level variability in the Common Era", Proceedings of the National Academy of Sciences, vol. 113, 2016. http://dx.doi.org/10.1073/pnas.1517056113
What is the best description of the greenhouse effect?
What exactly is the greenhouse effect? And what does it look like if we view it from a new angle? Of course, we know the answer, and Raymond Pierrehumbert has written an excellent paper about it (Infrared radiation and planetary temperature). Computer code used in climate models contain all the details.
[Read more…] about What is the best description of the greenhouse effect?
Marvel et al (2015) Part III: Response to Nic Lewis
The first post in this series gave the basic summary of Marvel et al (2015) (henceforth MEA15) and why I think it is an important paper. The second discussed some of the risible immediate media coverage. But there has also been an ‘appraisal’ of the paper by Nic Lewis that has appeared in no fewer than three other climate blogs (you can guess which). This is a response to the more interesting of his points.
[Read more…] about Marvel et al (2015) Part III: Response to Nic Lewis
References
- K. Marvel, G.A. Schmidt, R.L. Miller, and L.S. Nazarenko, "Implications for climate sensitivity from the response to individual forcings", Nature Climate Change, vol. 6, pp. 386-389, 2015. http://dx.doi.org/10.1038/nclimate2888
Anti-scientists
Ross McKitrick was so upset about a paper ‘Learning from mistakes in climate research’(Benestad et al., 2015) that he has written a letter of complaint and asked for immediate retraction of the pages discussing his work.
This is an unusual step in science, as most disagreements and debate involve a comment or a response to the original article. The exchange of views, then, provides perspectives from different angles and may enhance the understanding of the problem. This is part of a learning process.
Responding to McKitrick’s letter, however, is a new opportunity to explain some basic statistics, and it’s excellent to have some real and clear-cut examples for this purpose.
[Read more…] about Anti-scientists
References
- R.E. Benestad, D. Nuccitelli, S. Lewandowsky, K. Hayhoe, H.O. Hygen, R. van Dorland, and J. Cook, "Learning from mistakes in climate research", Theoretical and Applied Climatology, vol. 126, pp. 699-703, 2015. http://dx.doi.org/10.1007/s00704-015-1597-5
New On-line Classes and Models
My free online class on Coursera.org entitled Global Warming I: The Science and Modeling of Climate Change has already served 45,000 people (started, not finished) in the four times that it’s run. Now it’s set up in a new format, called “on demand mode”, which allows people to start, progress, and finish on their own calendars. This would be an advantage if a teacher wanted to use the material to supplement a class; a new cohort of learners is launched every month, so the next class start date is never more than a month away.
A new, supplemental class to the first one has been added and will come online on Monday, called Global Warming II: Create Your Own Models in Python or Fortran. This takes advantage of new code-grading machinery at Coursera to automatically run your code through its paces. There is also a peer code-review step, where you will get feedback on your commenting and variable-naming skills, and provide feedback to others. The class gives detailed instructions to create simple models of: time evolution of global temperature, the ice albedo feedback drop into snowball Earth, an ice sheet, and a shallow-water circulation model. The class is intended for people who are new to programming, or new to Python, or wish to enhance their understanding and appreciation of some cool science of Earth’s climate system.
The classes are supported by the same interactive on-line interactive climate system models as before, at http://climatemodels.uchicago.edu/, with some new additions, both of which generate animations of their time-dependent solutions.
One is a Hurricane simulator using a model from Kerry Emanuel, which can demonstrate the sensitivity of ocean temperature, ocean mixing, and atmospheric structure on hurricane evolution.
The other, the Permafrost model, is a simulation of a soil or sediment column in which ice and methane hydrate can form. The model shows how the brine salinity thermodynamically excludes methane hydrate from forming until you get to the base of the permafrost zone, and also how long it takes to warm a soil column by warming the surface. This model shows why I do not believe in an imminent methane climate catastrophe from Arctic Ocean methane hydrates.
Unforced Variations: Feb 2016
This month’s open thread.
Just so you know, a lot of people have complained that these threads have devolved – particularly when the discussion has turned to differing visions of solutions – and have therefore become much less interesting. Some suggestions last month were for a side thread for that kind of stuff that wouldn’t clog interesting issues of climate science. Other suggestions were for tighter moderation. The third suggestion is that people really just stay within the parameters of what this site has to offer: knowledgeable people on climate science issues and context for the science that’s being discussed elsewhere. For the time being, let’s try the last one, combined with some moderation. The goal is not to censor, but rather to maintain somewhere where the science issues don’t get drowned out by the noise.
How Likely Is The Observed Recent Warmth?
With the official numbers now in 2015 is, by a substantial margin, the new record-holder, the warmest year in recorded history for both the globe and the Northern Hemisphere. The title was sadly short-lived for previous record-holder 2014. And 2016 could be yet warmer if the current global warmth persists through the year.
One might well wonder: just how likely is it that we would be seeing these sort of streaks of record-breaking temperatures if not for human-caused warming of the planet?
Precisely that question was posed by several media organizations a year ago, in the wake of the then-record 2014 temperatures. Various press accounts reported odds anywhere from 1-in-27 million to 1-in-650 million that the observed run of global temperature records (9 of the 10 warmest years and 13 of the 15 warmest years each having had occurred since 2000) might have resulted from chance alone, i.e. without any assistance from human-caused global warming.
My colleagues and I suspected the odds quoted were way too slim. The problem is that each year was treated as though it were statistically independent of neighboring years (i.e. that each year is uncorrelated with the year before it or after it), but that’s just not true. Temperatures don’t vary erratically from one year to the next. Natural variations in temperature wax and wane over a period of several years. [Read more…] about How Likely Is The Observed Recent Warmth?
Blizzard Jonas and the slowdown of the Gulf Stream System
Blizzard Jonas on the US east coast has just shattered snowfall records. Both weather forecasters and climate experts have linked the high snowfall amounts to the exceptionally warm sea surface temperatures off the east coast. In this post I will examine a related question: why are sea surface temperatures so high there, as shown in the snapshot from Climate Reanalyzer below?
I will argue that this warmth (as well as the cold blob in the subpolar Atlantic) is partly due to a slowdown of the Atlantic Meridional Overturning Circulation (AMOC), sometimes referred to as the Gulf Stream System, in response to global warming. There are two points to this argument:
[Read more…] about Blizzard Jonas and the slowdown of the Gulf Stream System
2015 Temperatures
To no-one’s great surprise, 2015 was clearly a record year in all the surface temperature analyses (GISTEMP, NOAA, HadCRUT4, Cowtan&Way, JMA + Berkeley Earth). There is a lot of discussion of this in the press, and on the relevant websites, so not much to add here. A few figures didn’t make it into the official announcement (audio) though…