Una traducción en español está disponible aquí.
Irreversible no significa imparable
 ) (
) ( ) (
) (") ) (
) ( )
) Climate science from climate scientists...
) () () () Una traducción en español está disponible aquí.
) () Una traducción en español está disponible aquí.
) Una traducción en español está disponible aquí.
) () () 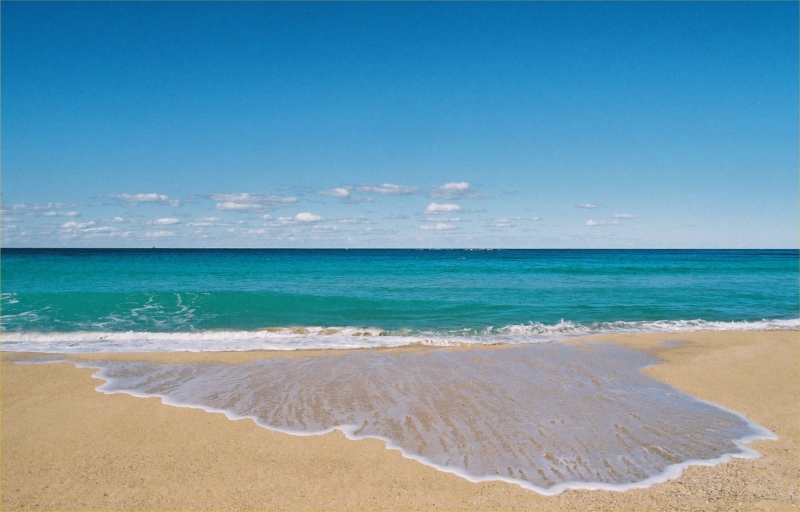 The British tabloid Daily Mirror recently headlined that “Sea will rise ‘to levels of last Ice Age’”. No doubt many of our readers will appreciate just how scary this prospect is: sea level during the last Ice Age was up to 120 meters lower than today. Our favourite swimming beaches – be it Coogee in Sydney or the Darß on the German Baltic coast – would then all be high and dry, and ports like Rotterdam or Tokyo would be far from the sea. Imagine it.
[Read more…] about Sea will rise ‘to levels of last Ice Age’
) Una traducción en español está disponible aquí.
) () A couple of us (Eric and Mike) are co-authors on a paper coming out in Nature this week (Jan. 22, 09). We have already seen misleading interpretations of our results in the popular press and the blogosphere, and so we thought we would nip such speculation in the bud.
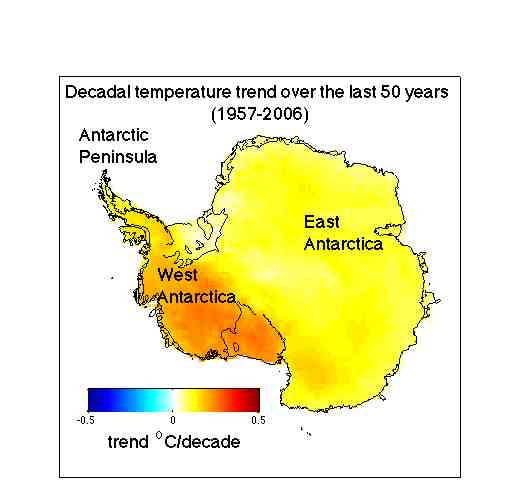 The paper shows that Antarctica has been warming for the last 50 years, and that it has been warming especially in West Antarctica (see the figure). The results are based on a statistical blending of satellite data and temperature data from weather stations. The results don’t depend on the statistics alone. They are backed up by independent data from automatic weather stations, as shown in our paper as well as in updated work by Bromwich, Monaghan and others (see their AGU abstract, here), whose earlier work in JGR was taken as contradicting ours. There is also a paper in press in Climate Dynamics (Goosse et al.) that uses a GCM with data assimilation (and without the satellite data we use) and gets the same result. Furthermore, speculation that our results somehow simply reflect changes in the near-surface inversion is ruled out by completely independent results showing that significant warming in West Antarctica extends well into the troposphere. And finally, our results have already been validated by borehole thermometery — a completely independent method — at at least one site in West Antarctica (Barrett et al. report the same rate of warming as we do, but going back to 1930 rather than 1957; see the paper in press in GRL).
With the axing of the CNN Science News team, most science stories at CNN are now being given to general assignment reporters who don’t necessarily have the background to know when they are being taken for a ride. On the Lou Dobbs show (an evening news program on cable for those of you not in the US), the last few weeks have brought a series of embarrassing non-stories on ‘global cooling’ based it seems on a few cold snaps this winter, the fact that we are at a solar minimum and a regurgitation of 1970s vintage interpretations of Milankovitch theory (via Pravda of all places!). Combine that with a few hysterical (in both senses) non-scientists as talking heads and you end up with a repeat of the nonsensical ‘Cooling world’ media stories that were misleading in the 1970s and are just as misleading now.
Exhibit A. Last night’s (13 Jan 2009) transcript (annotations in italics).
[Read more…] about CNN is spun right round, baby, right round
It is perhaps self-evident that those of us here at RealClimate have a keen interest in the topic of science communication. A number of us have written books aimed at communicating the science to the lay public, and have participated in forums devoted to the topic of science communication (see e.g. here, here, and here). We have often written here about the challenges of communicating science to the public in the modern media environment (see e.g. here, here, and here).
It is naturally our pleasure, in this vein, to bring to the attention of our readers a masterful new book on this topic by veteran environmental journalist and journalism educator Bud Ward. The book, entitled Communicating on Climate Change: An Essential Resource for Journalists, Scientists, and Educators, details the lessons learned in a series of Metcalf Institute workshops held over the past few years, funded by the National Science Foundation, and co-organized by Ward and AMS senior science and communications fellow Tony Socci. These workshops have collectively brought together numerous leading members of the environmental journalism and climate science communities in an effort to develop recommendations that might help bridge the cultural divide between these two communities that sometimes impedes accurate and effective science communication.
I had the privilege of participating in a couple of the workshops, including the inaugural workshop in Rhode Island in November 2003. The discussions emerging from these workshops were, at least in part, the inspiration behind “RealClimate”. The workshops formed the foundation for this new book, which is an appropriate resource for scientists, journalists, editors, and others interested in science communication and popularization. In addition to instructive chapters such as “Science for Journalism“, “Journalism for Scientists” and “What Institutions Can Do“, the book is interspersed with a number of insightful essays by leading scientists (e.g. “Mediarology–The Role of Climate Scientists in Debunking Climate Change Myths” by Stephen Schneider) and environmental journalists (e.g. “Hot Words” by Andy Revkin). We hope this book will serve as a standard reference for how to effectively communicate the science of climate change.
There was a paper in Science last week that has gotten quite a bit of press. It reports further evidence in support of the idea that the Younger Dryas — a distinct period towards the end of the last ice age when the deglaciation in the Northern Hemisphere was interrupted for a period of about 1300 years — was caused by a barrage of comets hitting North America.
When the first papers on this came out last year, we expressed skepticism. We remain skeptical and our reasons remain unchanged. But we think it is worth saying a bit more on this, because the reporting on this issue has largely ignored just how big an idea this is, and therefore how much more work would need to be done before it could be taken very seriously.
[Read more…] about The Younger Dryas comet-impact hypothesis: gem of an idea or fool’s gold?
This is a continuation of a previous post including interesting questions from the comments.
Some physics in the real world, that is necessary for a climate model to work, is only known empirically. Or perhaps the theory only really applies at scales much smaller than the model grid size. This physics needs to be ‘parameterised’ i.e. a formulation is used that captures the phenomenology of the process and its sensitivity to change but without going into all of the very small scale details. These parameterisations are approximations to the phenomena that we wish to model, but which work at the scales the models actually resolve. A simple example is the radiation code – instead of using a line-by-line code which would resolve the absorption at over 10,000 individual wavelengths, a GCM generally uses a broad-band approximation (with 30 to 50 bands) which gives very close to the same results as a full calculation. Another example is the formula for the evaporation from the ocean as a function of the large-scale humidity, temperature and wind-speed. This is really a highly turbulent phenomena, but there are good approximations that give the net evaporation as a function of the large scale (‘bulk’) conditions. In some parameterisations, the functional form is reasonably well known, but the values of specific coefficients might not be. In these cases, the parameterisations are ‘tuned’ to reproduce the observed processes as much as possible.