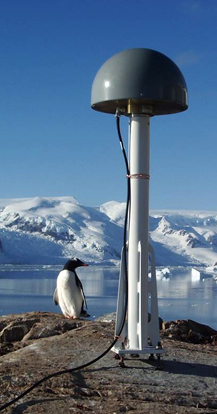
Walter Anthony et al (2012) have made a major contribution to the picture of methane emissions from thawing Arctic regions. Not a game-changer exactly, but definitely a graphics upgrade, bringing the game to life in stunningly higher resolution (/joke).
[Read more…] about Methane game upgrade
Climate Science
What makes sea-level rise?
Last week the science community was shocked by the claim that 42% of the sea-level rise of the past decades is due to groundwater pumping for irrigation purposes. What could this mean for the future – and is it true?
The causes of global sea level rise can be roughly split into three categories: (1) thermal expansion of sea water as it warms up, (2) melting of land ice and (3) changes in the amount of water stored on land. There are independent estimates for these contributions, and obviously an important question is whether their sum is consistent with the total sea level rise actually observed.
foto (c) Stefan Rahmstorf 2012
[Read more…] about What makes sea-level rise?
Unforced Variations; June 2012
Real Video
Guest post by Kelly Levin, WRI; Paul Higgins, AMS; Brian Helmuth, University of South Carolina; and Andy Dessler, Texas A&M
Scientists have made massive progress in understanding the climate system and how human activities are altering it. Despite that progress, decision makers continue to struggle with climate change risk management.
RealClimate and other initiatives have shown that new media can be effective in enhancing communication of climate science. The speed by which new information can be transmitted has increased significantly, and new media has provided new learning opportunities, including discussion, debate, and links to further information.
This month, WRI, supported by google.org, launched a pilot project to further build the capacity of the scientific community to more effectively relay their recent scientific findings. The project stemmed from the Google Science Communication Fellow program, which aims to foster more accessible, open, and transparent scientific dialogue.
The project assesses whether video can be a compelling way for a scientist to describe his/her discoveries and, if so, which type of video works best. Imagine video being embedded one day into journal websites and Google scholar, not only offering the option of downloading a recent publication but also a video associated with the publication. Imagine videos sitting alongside newspaper and magazine articles, where you can hear about findings directly from the scientist in his or her own words. Like RealClimate, the project aims to connect viewers to the scientists themselves.
This project has the potential to improve scientific communication and enhance the public understanding of science. Ultimately, if done right scientific communication can help shape the public debate and lead to more informed decisions. That’s critical because societal decisions have the greatest chance to benefit the public when they are grounded in the best available knowledge and understanding. We need RealClimate’s reader’s help.
Please assist us in identifying the most effective means for communicating the latest findings of climate science via video. Go to http://www.wri.org/communicating-climate-science to watch the three videos.
Three scientists (also Google Fellows) — Andy Dessler from Texas A&M University; Brian Helmuth from University of South Carolina; and Paul Higgins from the American Meteorological Society – participated, and the videos showcase one of their recent studies that is either in production or recently published:
Dessler’s paper (Science, Vol. 330., http://geotest.tamu.edu/userfiles/216/dessler10b.pdf) focused on quantifying the cloud feedback. Using the ENSO to study changing cloud patterns during climatic variability, he found that the feedback is likely positive, consistent with the feedback that climate models yield.
Helmuth’s paper (Ecology Letters, forthcoming) examined the impact of variations in water and aerial temperatures on predator-prey interactions between sea stars and mussels in the intertidal zone. He and his colleagues found that predation rates decreased during non-coincident interactions between the two temperature stressors. Their paper underscores the need for taking into account temporal fluctuations in environmental stress, which can be ignored in experiments and models.
Higgins focuses on his recent research (Journal of Climate, in press) to more fully quantify the potential range in the terrestrial carbon cycle response to climate warming. This research suggests that plants and soils could release large amounts of carbon dioxide as global climate warms. That would push GHG concentrations higher and lead to even more climate warming. This is important because we’ve been counting on plants and soils to soak up and store some of the carbon we’re releasing.
Three videos were produced for each of the abovementioned papers:
Which video do you think works best? Click here to cast your vote and tell us about why you think it is most effective. Your votes will inform any scaling up of this project in the future.
Fresh hockey sticks from the Southern Hemisphere
In the Northern Hemisphere, the late 20th / early 21st century has been the hottest time period in the last 400 years at very high confidence, and likely in the last 1000 – 2000 years (or more). It has been unclear whether this is also true in the Southern Hemisphere. Three studies out this week shed considerable new light on this question. This post provides just brief summaries; we’ll have more to say about these studies in the coming weeks. [Read more…] about Fresh hockey sticks from the Southern Hemisphere
OHC Model/Obs Comparison Errata
This is just a brief note to point out that a few graphs that I have put together showing Ocean Heat Content changes in recent decades had an incorrect scaling for the GISS model data. My error was in assuming that the model output (which were in units W yr/m2) were scaled for the ocean area only, when in fact they were scaled for the entire global surface area (see fig. 2 in Hansen et al, 2005). Therefore, in converting to units of 1022 Joules for the absolute ocean heat content change, I had used a factor of 1.1 (0.7 x 5.1 x 365 x 3600 x 24 x 10-8), instead of the correct value of 1.61 (5.1 x 365 x 3600 x 24 x 10-8). This problem came to light while we were redoing this analysis for the CMIP5 models and from conversations with dana1981 at skepticalscience.com.
These graphs appeared in Dec 2009, May 2010, Jan 2011 and Feb 2012. In each case, I have replaced the graph with a corrected version while leaving a link to the incorrect version. Links to the figures will return the corrected image (and this is noted on the image itself). Where possible I used the data that were current at the time of the original post. Fortunately this only affects the figures used in these blog postings and not in any publications. Apologies for any confusion.
This figure shows the comparison using the most up-to-date observational products (NODC, PMEL):
The basic picture is unchanged – model simulations were able to capture the historical variance in OHC (as best we know it now – there remains significant structural uncertainty in those estimates). There are clear dips related volcanic eruptions (Agung, El Chichon, Pinatubo), and an sharp increase in the 1990s. Note that in GISS-EH (same AGCM but with a different ocean model) OHC increases at a slightly slower rate than seen with GISS-ER above. Looking at the last decade, it is clear that the observed rate of change of upper ocean heat content is a little slower than previously (and below linear extrapolations of the pre-2003 model output), and it remains unclear to what extent that is related to a reduction in net radiative forcing growth (due to the solar cycle, or perhaps larger than expected aerosol forcing growth), or internal variability, model errors, or data processing – arguments have been made for all four, singly and together.
Analyses of the CMIP5 models will provide some insight here since the historical simulations have been extended to 2012 (including the last solar minimum), and have updated aerosol emissions. Watch this space.
References
- J. Hansen, L. Nazarenko, R. Ruedy, M. Sato, J. Willis, A. Del Genio, D. Koch, A. Lacis, K. Lo, S. Menon, T. Novakov, J. Perlwitz, G. Russell, G.A. Schmidt, and N. Tausnev, "Earth's Energy Imbalance: Confirmation and Implications", Science, vol. 308, pp. 1431-1435, 2005. http://dx.doi.org/10.1126/science.1110252
Another fingerprint
When my kids were younger, they asked me why the ocean was blue. I would answer that the ocean mirrors the blue sky. However, I would not think much more about it, even though it is well-known that the oceans represent the most important source for atmospheric moisture. They also play an important role for many types of internal variations, such as the El Nino Southern Oscillation. Now a new study by Durack et al. (2012) has been published in Science that presents the relationship between the oceans and the atmosphere.
[Read more…] about Another fingerprint
References
- P.J. Durack, S.E. Wijffels, and R.J. Matear, "Ocean Salinities Reveal Strong Global Water Cycle Intensification During 1950 to 2000", Science, vol. 336, pp. 455-458, 2012. http://dx.doi.org/10.1126/science.1212222
Plugging the leaks
Guest commentary by Beate Liepert, NWRA
Clouds and water vapor accounts for only a tiny fraction of all water on Earth, but in spite of it, this moisture in the atmosphere is crucially important to replenishing drinking water reservoirs, crop yields, distribution of vegetation zones, and so on. This is the case because in the atmosphere, clouds and water vapor, transports a vast amount of water from oceans to land, where it falls out as precipitation. Scientists generally agree that rising temperatures in the coming decades will affect this cycling of water. And most climate models successfully simulate a global intensification of rainfall. However, physical models often disagree with observations and amongst themselves on the amount of the intensification, and global distribution of moisture that defines dry and wet regions.
[Read more…] about Plugging the leaks
Greenland Glaciers — not so fast!
There have been several recent papers on ice sheets and sea level that have gotten a bit of press of the journalistic whiplash variety (“The ice is melting faster than we thought!” “No, its not!”). As usual the papers themselves are much better than the press about them, and the results less confusing. They add rich detail to our understanding of the ice sheets; they do not change estimates of the magnitude of future sea level rise.
One of these recent papers, by Hellmer et al., discusses possible mechanisms by which loss of ice from the great ice sheets may occur in the future. Hellmer et al.’s results suggest that retreat of the Ronne-Filchner ice shelf in the Weddell Sea (Antarctica) — an area that until recently has not received all that much attention from glaciologists — might correspond to an additional rise in global sea level of about 40 cm. That’s a lot, and it’s in addition to, the “worst case scenarios” often referred to — notably, that of Pfeffer et al., (2008), who did not consider the Ronne-Filchner. However, it’s also entirely model based (as such projections must be) and doesn’t really provide any information on likelihood — just on mechanisms.
Among the most important recent papers, in our view, is the one by Moon et al. in Science earlier this May (2012). The paper, with co-authors Ian Joughin (who won the Agassiz Medal at EGU this year), Ben Smith, and Ian Howat, provides a wonderful new set of data on Greenland’s glaciers. This is the first paper to provide data on *all* the outlet glaciers that drain the Greenland ice sheet into the sea.
The bottom line is that Greenland’s glaciers are still speeding up. But the results put speculation of monotonic or exponential increases in Greenland’s ice discharge to rest, an idea that some had raised after a doubling over a few years was reported in 2004 for Jakobshavn Isbræ (Greenland’s largest outlet glacier). Let it not be said that journals such as Science and Nature are only willing to publish papers that find that thing are “worse than we thought”! But neither does this new work contradict any of the previous estimates of future sea level rise, such as that of Vermeer and Rahmstorf. The reality is that the record is very short (just 10 years) and shows a complex time-dependent glacier response, from which one cannot deduce how the ice sheet will react in the long run to a major climatic warming, say over the next 50 or 100 years.
These new data provide an important baseline and they will remain important for many years to come. We asked Moon and Joughin to write a summary of their paper for us, which is reproduced below.
Guest Post by By Twila Moon and Ian Joughin, University of Washington
The sheer scale of the Greenland and Antarctic ice sheets pose significant difficulties for collecting data on the ground. Fortunately, satellites have brought in a new era of ice sheet research, allowing us to begin answering basic questions – how fast does the ice move? how quickly is it changing? where and how much melting and thinning is occurring? – on a comprehensive spatial scale. Our recent paper, “21st-century evolution of Greenland outlet glacier velocities”, published May 4th in Science, presented observations of velocity on all Greenland outlet glaciers – more than 200 glaciers – wider than 1.5km [Moon et al., 2012]. There are two primary conclusions in our study:
1) Glaciers in the northwest and southeast regions of the Greenland ice sheet, where ~80% of discharge occurs, sped up by ~30% from 2000 to 2010 (34% for the southeast, 28% for the northwest).
2) On a local scale, there is notable variability in glacier speeds, with even neighboring glaciers exhibiting different annual velocity patterns.
There are a few points on our research that may be easy to misinterpret, so we’re taking this opportunity to provide some additional details and explanation.
Melt and Velocity
The Greenland ice sheet changes mass through two primary methods: 1) loss or gain of ice through melt or precipitation (surface mass balance) and 2) loss of ice through calving of icebergs (discharge) (Figure 1) [van den Broeke et al., 2009]. It is not uncommon for people to confuse discharge and melting. Our measurements from Greenland, which are often referred to in the context of “melt”, are actually observations of velocity, and thus relate to discharge, not in situ melting.
Figure 1. Components of surface mass balance and discharge. Most components can change in both negative (e.g., thinning) and positive directions (e.g., thickening).
When glaciologists refer to “increased melt” they are usually referring to melt that occurs on the ice sheet’s top surface (i.e., surface mass balance). Surface melt largely is confined to the lower-elevation edge of the ice sheet, where air temperature and solar radiation can melt up to several meters of ice each year during summer. Melt extent depends on air temperatures which tend to be greatest at more southerly latitudes. Meltwater pools in lakes and crevasses, often finding a path to drain through and under the ice sheet to the ocean. Glaciologists and oceanographers have found evidence for notable melt where the ice contacts ocean water [Straneo et al., 2010]. So, when you hear about ice sheet “melt”, think surface lakes and streams and melting at the ends of the glaciers where they meet the ocean.
So, why focus on velocity instead of melt? Velocity is more closely related to the discharge of ice to the ocean in the process of which icebergs break off, which float away to melt somewhere else potentially far removed from the ice sheet. You can picture outlet glaciers as large conveyor belts of ice, moving ice from the interior of the ice sheet out to the ocean. Our velocity measurements help indicate how quickly these conveyor belts are moving ice toward the ocean. Given climate change projections of continued warming for the Greenland ice sheet [IPCC, 2007], it’s important to understand at what speeds Greenland glaciers flow and how they change. On the whole, the measurements thus far indicate overall speedup. It turns out that on any individual glacier, however, the flow may undergo large changes on an annual basis, including both speeding up and slowing down. With these detailed measurements of glacier velocity, we can continue to work toward a better understanding of what primary factors control glacier velocity. Answers to this latter question will ultimately help us predict the ice sheet’s future behavior in a changing climate.
Sea Level Rise
Translating velocity change into changes in sea level rise is not a straightforward task. Sea level change reflects the total mass of ice lost (or gained) from the ice sheet. Determining this quantity requires measurements of velocity, thickness, width, advance/retreat (i.e., terminus position), and density – or, in some cases, an entirely different approach, such as measuring gravity changes.
Our study does not include many of the measurements that are a part of determining total mass balance, and thus total sea level rise. In another paper that we highlight in our study, Pfeffer et al. [2008] used a specifically prescribed velocity scaling to examine potential worst-case values for sea level rise. The Pfeffer et al. paper did not produce “projections” of sea level rise so much as a look at the limits that ice sheet dynamics might place on sea level rise. It is reasonable to comment on how our observations compare to the prescribed velocity values that Pfeffer et al. used. They lay out two scenarios for Greenland dynamics. The first scenario was a thought experiment to consider sea level rise by 2100 if all glaciers double their speed between 2000 and 2010, which is plausible given the observed doubling of speed by some glacier. The second experiment laid out a worst-case scenario in which all glacier speeds increased by an order of magnitude from 2000 to 2010, based on the assumption that greater than tenfold increases were implausible. The first scenario results in 9.3 cm sea level rise from Greenland dynamics (this does not include surface mass balance) by 2100 and the second scenario produces 46.7 cm sea level rise by 2100. The observational data now in hand for 2000-2010 show speedup during this period was ~30% for fast-flowing glaciers. While velocities did not double during the decade, a continued speedup might push average velocities over the doubling mark well before 2100, suggesting that the lower number for sea level rise from Greenland dynamics is well within reason. Our results also show wide variability and individual glaciers with marked speedup and slowdown. In our survey of more than 200 glaciers, some glaciers do double in speed but they do not approach a tenfold increase. Considering these results, our data suggest that sea level rise by 2100 from Greenland dynamics is likely to remain below the worst-case laid out by Pfeffer et al.
By adding our observational data to the theoretical results laid out by Pfeffer et al., we are ignoring uncertainties of the other assumptions of their experiment, but refining their velocity estimates. The result is not a new estimate of sea level rise but, rather, an improved detail for increasing accuracy. Indeed, a primary value of our study is not in providing an estimate of sea level rise, but in offering the sort of spatial and temporal details that will be needed to improve others’ modeling and statistical extrapolation studies. With just ten years of observations, our work is the tip of the iceberg for developing an understanding of long-term ice sheet behavior. Fortunately, our study provides a wide range of spatial and temporal coverage that is important for continued efforts aimed at understanding the processes controlling fast glacier flow. The record is still relatively short, however, so continued observation to extend the record is of critical importance.
In the same Science issue as our study, two perspective pieces comment on the challenges of ice sheet modeling [Alley and Joughin, 2012] and improving predictions of regional sea level rise [Willis and Church, 2012]. Clearly, all three of the papers are connected, as much as in pointing out where we need to learn more as in indicating where we have already made important strides.
Alley, R. B., and I. Joughin (2012), Modeling Ice-Sheet Flow, Science, 336(6081), 551-552.
IPCC (2007), Climate Change 2007: The Physical Science Basis. Contribution of Working Group I to the Fourth Assessment Report of the Intergovernmental Panel on Climate Change, S. Solomon et al., Eds., Cambridge University Press, ppp 996.
Moon, T., I. Joughin, B. Smith, and I. Howat (2012), 21st-Century Evolution of Greenland Outlet Glacier Velocities, Science, 336(6081), 576-578.
Pfeffer, W. T., J. T. Harper, and S. O’Neel (2008), Kinematic constraints on glacier contributions to 21st-century sea-level rise, Science, 321(000258914300046), 1340-1343.
Straneo, F., G. S. Hamilton, D. A. Sutherland, L. A. Stearns, F. Davidson, M. O. Hammill, G. B. Stenson, and A. Rosing-Asvid (2010), Rapid circulation of warm subtropical waters in a major glacial fjord in East Greenland, Nature Geoscience, 3(3), 1-5.
van den Broeke, M., J. Bamber, J. Ettema, E. Rignot, E. Schrama, W. Van De Berg, E. Van Meijgaard, I. Velicogna, and B. Wouters (2009), Partitioning Recent Greenland Mass Loss, Science, 326(5955), 984-986.
Willis, J. K., and J. A. Church (2012), Regional Sea-Level Projection, Science, 336(6081), 550-551.
Yamalian yawns
Steve McIntyre is free to do any analysis he wants on any data he can find. But when he ladles his work with unjustified and false accusations of misconduct and deception, he demeans both himself and his contributions. The idea that scientists should be bullied into doing analyses McIntyre wants and delivering the results to him prior to publication out of fear of very public attacks on their integrity is ludicrous.
By rights we should be outraged and appalled that (yet again) unfounded claims of scientific misconduct and dishonesty are buzzing around the blogosphere, once again initiated by Steve McIntyre, and unfailingly and uncritically promoted by the usual supporters. However this has become such a common occurrence that we are no longer shocked nor surprised that misinformation based on nothing but prior assumptions gains an easy toehold on the contrarian blogs (especially at times when they are keen to ‘move on’ from more discomforting events).
So instead of outrage, we’ll settle for simply making a few observations that undermine the narrative that McIntyre and company are trying to put out.
[Read more…] about Yamalian yawns