In the Northern Hemisphere, the late 20th / early 21st century has been the hottest time period in the last 400 years at very high confidence, and likely in the last 1000 – 2000 years (or more). It has been unclear whether this is also true in the Southern Hemisphere. Three studies out this week shed considerable new light on this question. This post provides just brief summaries; we’ll have more to say about these studies in the coming weeks. [Read more…] about Fresh hockey sticks from the Southern Hemisphere
Climate Science
OHC Model/Obs Comparison Errata
This is just a brief note to point out that a few graphs that I have put together showing Ocean Heat Content changes in recent decades had an incorrect scaling for the GISS model data. My error was in assuming that the model output (which were in units W yr/m2) were scaled for the ocean area only, when in fact they were scaled for the entire global surface area (see fig. 2 in Hansen et al, 2005). Therefore, in converting to units of 1022 Joules for the absolute ocean heat content change, I had used a factor of 1.1 (0.7 x 5.1 x 365 x 3600 x 24 x 10-8), instead of the correct value of 1.61 (5.1 x 365 x 3600 x 24 x 10-8). This problem came to light while we were redoing this analysis for the CMIP5 models and from conversations with dana1981 at skepticalscience.com.
These graphs appeared in Dec 2009, May 2010, Jan 2011 and Feb 2012. In each case, I have replaced the graph with a corrected version while leaving a link to the incorrect version. Links to the figures will return the corrected image (and this is noted on the image itself). Where possible I used the data that were current at the time of the original post. Fortunately this only affects the figures used in these blog postings and not in any publications. Apologies for any confusion.
This figure shows the comparison using the most up-to-date observational products (NODC, PMEL):
The basic picture is unchanged – model simulations were able to capture the historical variance in OHC (as best we know it now – there remains significant structural uncertainty in those estimates). There are clear dips related volcanic eruptions (Agung, El Chichon, Pinatubo), and an sharp increase in the 1990s. Note that in GISS-EH (same AGCM but with a different ocean model) OHC increases at a slightly slower rate than seen with GISS-ER above. Looking at the last decade, it is clear that the observed rate of change of upper ocean heat content is a little slower than previously (and below linear extrapolations of the pre-2003 model output), and it remains unclear to what extent that is related to a reduction in net radiative forcing growth (due to the solar cycle, or perhaps larger than expected aerosol forcing growth), or internal variability, model errors, or data processing – arguments have been made for all four, singly and together.
Analyses of the CMIP5 models will provide some insight here since the historical simulations have been extended to 2012 (including the last solar minimum), and have updated aerosol emissions. Watch this space.
References
- J. Hansen, L. Nazarenko, R. Ruedy, M. Sato, J. Willis, A. Del Genio, D. Koch, A. Lacis, K. Lo, S. Menon, T. Novakov, J. Perlwitz, G. Russell, G.A. Schmidt, and N. Tausnev, "Earth's Energy Imbalance: Confirmation and Implications", Science, vol. 308, pp. 1431-1435, 2005. http://dx.doi.org/10.1126/science.1110252
Another fingerprint
When my kids were younger, they asked me why the ocean was blue. I would answer that the ocean mirrors the blue sky. However, I would not think much more about it, even though it is well-known that the oceans represent the most important source for atmospheric moisture. They also play an important role for many types of internal variations, such as the El Nino Southern Oscillation. Now a new study by Durack et al. (2012) has been published in Science that presents the relationship between the oceans and the atmosphere.
[Read more…] about Another fingerprint
References
- P.J. Durack, S.E. Wijffels, and R.J. Matear, "Ocean Salinities Reveal Strong Global Water Cycle Intensification During 1950 to 2000", Science, vol. 336, pp. 455-458, 2012. http://dx.doi.org/10.1126/science.1212222
Plugging the leaks
Guest commentary by Beate Liepert, NWRA
Clouds and water vapor accounts for only a tiny fraction of all water on Earth, but in spite of it, this moisture in the atmosphere is crucially important to replenishing drinking water reservoirs, crop yields, distribution of vegetation zones, and so on. This is the case because in the atmosphere, clouds and water vapor, transports a vast amount of water from oceans to land, where it falls out as precipitation. Scientists generally agree that rising temperatures in the coming decades will affect this cycling of water. And most climate models successfully simulate a global intensification of rainfall. However, physical models often disagree with observations and amongst themselves on the amount of the intensification, and global distribution of moisture that defines dry and wet regions.
[Read more…] about Plugging the leaks
Greenland Glaciers — not so fast!
There have been several recent papers on ice sheets and sea level that have gotten a bit of press of the journalistic whiplash variety (“The ice is melting faster than we thought!” “No, its not!”). As usual the papers themselves are much better than the press about them, and the results less confusing. They add rich detail to our understanding of the ice sheets; they do not change estimates of the magnitude of future sea level rise.
One of these recent papers, by Hellmer et al., discusses possible mechanisms by which loss of ice from the great ice sheets may occur in the future. Hellmer et al.’s results suggest that retreat of the Ronne-Filchner ice shelf in the Weddell Sea (Antarctica) — an area that until recently has not received all that much attention from glaciologists — might correspond to an additional rise in global sea level of about 40 cm. That’s a lot, and it’s in addition to, the “worst case scenarios” often referred to — notably, that of Pfeffer et al., (2008), who did not consider the Ronne-Filchner. However, it’s also entirely model based (as such projections must be) and doesn’t really provide any information on likelihood — just on mechanisms.
Among the most important recent papers, in our view, is the one by Moon et al. in Science earlier this May (2012). The paper, with co-authors Ian Joughin (who won the Agassiz Medal at EGU this year), Ben Smith, and Ian Howat, provides a wonderful new set of data on Greenland’s glaciers. This is the first paper to provide data on *all* the outlet glaciers that drain the Greenland ice sheet into the sea.
The bottom line is that Greenland’s glaciers are still speeding up. But the results put speculation of monotonic or exponential increases in Greenland’s ice discharge to rest, an idea that some had raised after a doubling over a few years was reported in 2004 for Jakobshavn Isbræ (Greenland’s largest outlet glacier). Let it not be said that journals such as Science and Nature are only willing to publish papers that find that thing are “worse than we thought”! But neither does this new work contradict any of the previous estimates of future sea level rise, such as that of Vermeer and Rahmstorf. The reality is that the record is very short (just 10 years) and shows a complex time-dependent glacier response, from which one cannot deduce how the ice sheet will react in the long run to a major climatic warming, say over the next 50 or 100 years.
These new data provide an important baseline and they will remain important for many years to come. We asked Moon and Joughin to write a summary of their paper for us, which is reproduced below.
Guest Post by By Twila Moon and Ian Joughin, University of Washington
The sheer scale of the Greenland and Antarctic ice sheets pose significant difficulties for collecting data on the ground. Fortunately, satellites have brought in a new era of ice sheet research, allowing us to begin answering basic questions – how fast does the ice move? how quickly is it changing? where and how much melting and thinning is occurring? – on a comprehensive spatial scale. Our recent paper, “21st-century evolution of Greenland outlet glacier velocities”, published May 4th in Science, presented observations of velocity on all Greenland outlet glaciers – more than 200 glaciers – wider than 1.5km [Moon et al., 2012]. There are two primary conclusions in our study:
1) Glaciers in the northwest and southeast regions of the Greenland ice sheet, where ~80% of discharge occurs, sped up by ~30% from 2000 to 2010 (34% for the southeast, 28% for the northwest).
2) On a local scale, there is notable variability in glacier speeds, with even neighboring glaciers exhibiting different annual velocity patterns.
There are a few points on our research that may be easy to misinterpret, so we’re taking this opportunity to provide some additional details and explanation.
Melt and Velocity
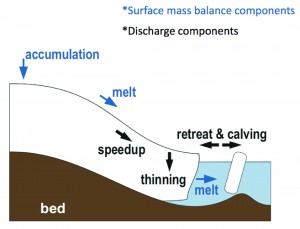
The Greenland ice sheet changes mass through two primary methods: 1) loss or gain of ice through melt or precipitation (surface mass balance) and 2) loss of ice through calving of icebergs (discharge) (Figure 1) [van den Broeke et al., 2009]. It is not uncommon for people to confuse discharge and melting. Our measurements from Greenland, which are often referred to in the context of “melt”, are actually observations of velocity, and thus relate to discharge, not in situ melting.
Figure 1. Components of surface mass balance and discharge. Most components can change in both negative (e.g., thinning) and positive directions (e.g., thickening).
When glaciologists refer to “increased melt” they are usually referring to melt that occurs on the ice sheet’s top surface (i.e., surface mass balance). Surface melt largely is confined to the lower-elevation edge of the ice sheet, where air temperature and solar radiation can melt up to several meters of ice each year during summer. Melt extent depends on air temperatures which tend to be greatest at more southerly latitudes. Meltwater pools in lakes and crevasses, often finding a path to drain through and under the ice sheet to the ocean. Glaciologists and oceanographers have found evidence for notable melt where the ice contacts ocean water [Straneo et al., 2010]. So, when you hear about ice sheet “melt”, think surface lakes and streams and melting at the ends of the glaciers where they meet the ocean.
So, why focus on velocity instead of melt? Velocity is more closely related to the discharge of ice to the ocean in the process of which icebergs break off, which float away to melt somewhere else potentially far removed from the ice sheet. You can picture outlet glaciers as large conveyor belts of ice, moving ice from the interior of the ice sheet out to the ocean. Our velocity measurements help indicate how quickly these conveyor belts are moving ice toward the ocean. Given climate change projections of continued warming for the Greenland ice sheet [IPCC, 2007], it’s important to understand at what speeds Greenland glaciers flow and how they change. On the whole, the measurements thus far indicate overall speedup. It turns out that on any individual glacier, however, the flow may undergo large changes on an annual basis, including both speeding up and slowing down. With these detailed measurements of glacier velocity, we can continue to work toward a better understanding of what primary factors control glacier velocity. Answers to this latter question will ultimately help us predict the ice sheet’s future behavior in a changing climate.
Sea Level Rise
Translating velocity change into changes in sea level rise is not a straightforward task. Sea level change reflects the total mass of ice lost (or gained) from the ice sheet. Determining this quantity requires measurements of velocity, thickness, width, advance/retreat (i.e., terminus position), and density – or, in some cases, an entirely different approach, such as measuring gravity changes.
Our study does not include many of the measurements that are a part of determining total mass balance, and thus total sea level rise. In another paper that we highlight in our study, Pfeffer et al. [2008] used a specifically prescribed velocity scaling to examine potential worst-case values for sea level rise. The Pfeffer et al. paper did not produce “projections” of sea level rise so much as a look at the limits that ice sheet dynamics might place on sea level rise. It is reasonable to comment on how our observations compare to the prescribed velocity values that Pfeffer et al. used. They lay out two scenarios for Greenland dynamics. The first scenario was a thought experiment to consider sea level rise by 2100 if all glaciers double their speed between 2000 and 2010, which is plausible given the observed doubling of speed by some glacier. The second experiment laid out a worst-case scenario in which all glacier speeds increased by an order of magnitude from 2000 to 2010, based on the assumption that greater than tenfold increases were implausible. The first scenario results in 9.3 cm sea level rise from Greenland dynamics (this does not include surface mass balance) by 2100 and the second scenario produces 46.7 cm sea level rise by 2100. The observational data now in hand for 2000-2010 show speedup during this period was ~30% for fast-flowing glaciers. While velocities did not double during the decade, a continued speedup might push average velocities over the doubling mark well before 2100, suggesting that the lower number for sea level rise from Greenland dynamics is well within reason. Our results also show wide variability and individual glaciers with marked speedup and slowdown. In our survey of more than 200 glaciers, some glaciers do double in speed but they do not approach a tenfold increase. Considering these results, our data suggest that sea level rise by 2100 from Greenland dynamics is likely to remain below the worst-case laid out by Pfeffer et al.
By adding our observational data to the theoretical results laid out by Pfeffer et al., we are ignoring uncertainties of the other assumptions of their experiment, but refining their velocity estimates. The result is not a new estimate of sea level rise but, rather, an improved detail for increasing accuracy. Indeed, a primary value of our study is not in providing an estimate of sea level rise, but in offering the sort of spatial and temporal details that will be needed to improve others’ modeling and statistical extrapolation studies. With just ten years of observations, our work is the tip of the iceberg for developing an understanding of long-term ice sheet behavior. Fortunately, our study provides a wide range of spatial and temporal coverage that is important for continued efforts aimed at understanding the processes controlling fast glacier flow. The record is still relatively short, however, so continued observation to extend the record is of critical importance.
In the same Science issue as our study, two perspective pieces comment on the challenges of ice sheet modeling [Alley and Joughin, 2012] and improving predictions of regional sea level rise [Willis and Church, 2012]. Clearly, all three of the papers are connected, as much as in pointing out where we need to learn more as in indicating where we have already made important strides.
Alley, R. B., and I. Joughin (2012), Modeling Ice-Sheet Flow, Science, 336(6081), 551-552.
IPCC (2007), Climate Change 2007: The Physical Science Basis. Contribution of Working Group I to the Fourth Assessment Report of the Intergovernmental Panel on Climate Change, S. Solomon et al., Eds., Cambridge University Press, ppp 996.
Moon, T., I. Joughin, B. Smith, and I. Howat (2012), 21st-Century Evolution of Greenland Outlet Glacier Velocities, Science, 336(6081), 576-578.
Pfeffer, W. T., J. T. Harper, and S. O’Neel (2008), Kinematic constraints on glacier contributions to 21st-century sea-level rise, Science, 321(000258914300046), 1340-1343.
Straneo, F., G. S. Hamilton, D. A. Sutherland, L. A. Stearns, F. Davidson, M. O. Hammill, G. B. Stenson, and A. Rosing-Asvid (2010), Rapid circulation of warm subtropical waters in a major glacial fjord in East Greenland, Nature Geoscience, 3(3), 1-5.
van den Broeke, M., J. Bamber, J. Ettema, E. Rignot, E. Schrama, W. Van De Berg, E. Van Meijgaard, I. Velicogna, and B. Wouters (2009), Partitioning Recent Greenland Mass Loss, Science, 326(5955), 984-986.
Willis, J. K., and J. A. Church (2012), Regional Sea-Level Projection, Science, 336(6081), 550-551.
Yamalian yawns
Steve McIntyre is free to do any analysis he wants on any data he can find. But when he ladles his work with unjustified and false accusations of misconduct and deception, he demeans both himself and his contributions. The idea that scientists should be bullied into doing analyses McIntyre wants and delivering the results to him prior to publication out of fear of very public attacks on their integrity is ludicrous.
By rights we should be outraged and appalled that (yet again) unfounded claims of scientific misconduct and dishonesty are buzzing around the blogosphere, once again initiated by Steve McIntyre, and unfailingly and uncritically promoted by the usual supporters. However this has become such a common occurrence that we are no longer shocked nor surprised that misinformation based on nothing but prior assumptions gains an easy toehold on the contrarian blogs (especially at times when they are keen to ‘move on’ from more discomforting events).
So instead of outrage, we’ll settle for simply making a few observations that undermine the narrative that McIntyre and company are trying to put out.
[Read more…] about Yamalian yawns
The legend of the Titanic
It’s 100 years since the Titanic sank in the North Atlantic, and it’s still remembered today. It was one of those landmark events that make a deep impression on people. It also fits a pattern of how we respond to different conditions, according to a recent book about the impact of environmental science on the society (Gudmund Hernes Hot Topic – Cold Comfort): major events are the stimulus and the change of mind is the response.
Hernes suggests that one of those turning moments that made us realize our true position in the universe was when we for the first time saw our own planet from space.
Unforced variations: May 2012
New open thread for this month: misrepresentations of wind farm impacts on local climate? Clouds and contrarians? or whatever…
Unlocking the secrets to ending an Ice Age
Guest Commentary by Chris Colose, SUNY Albany
It has long been known that characteristics of the Earth’s orbit (its eccentricity, the degree to which it is tilted, and its “wobble”) are slightly altered on timescales of tens to hundreds of thousands of years. Such variations, collectively known as Milankovitch cycles, conspire to pace the timing of glacial-to-interglacial variations.
Despite the immense explanatory power that this hypothesis has provided, some big questions still remain. For one, the relative roles of eccentricity, obliquity, and precession in controlling glacial onsets/terminations are still debated. While the local, seasonal climate forcing by the Milankovitch cycles is large (of the order 30 W/m2), the net forcing provided by Milankovitch is close to zero in the global mean, requiring other radiative terms (like albedo or greenhouse gas anomalies) to force global-mean temperature change.
The last deglaciation occurred as a long process between peak glacial conditions (from ~26-20,000 years ago) to the Holocene (~10,000 years ago). Explaining this evolution is not trivial. Variations in the orbit cause opposite changes in the intensity of solar radiation during the summer between the Northern and Southern hemisphere, yet ice age terminations seem synchronous between hemispheres. This could be explained by the role of the greenhouse gas CO2, which varies in abundance in the atmosphere in sync with the glacial cycles and thus acts as a “globaliser” of glacial cycles, as it is well-mixed throughout the atmosphere. However, if CO2 plays this role it is surprising that climatic proxies indicate that Antarctica seems to have warmed prior to the Northern Hemisphere, yet glacial cycles follow in phase with Northern insolation (“INcoming SOLar radiATION”) patterns, raising questions as to what communication mechanism links the hemispheres.
There have been multiple hypotheses to explain this apparent paradox. One is that the length of the austral summer co-varies with boreal summer intensity, such that local insolation forcings could result in synchronous deglaciations in each hemisphere (Huybers and Denton, 2008). A related idea is that austral spring insolation co-varies with summer duration, and could have forced sea ice retreat in the Southern Ocean and greenhouse gas feedbacks (e.g., Stott et al., 2007).
Based on transient climate model simulations of glacial-interglacial transitions (rather than “snapshots” of different modeled climate states), Ganopolski and Roche (2009) proposed that in addition to CO2, changes in ocean heat transport provide a critical link between northern and southern hemispheres, able to explain the apparent lag of CO2 behind Antarctic temperature. Recently, an elaborate data analysis published in Nature by Shakun et al., 2012 (pdf) has provided strong support for these model predictions. Shakun et al. attempt to interrogate the spatial and temporal patterns associated with the last deglaciation; in doing so, they analyze global-scale patterns (not just records from Antarctica). This is a formidable task, given the need to synchronize many marine, terrestrial, and ice core records.
[Read more…] about Unlocking the secrets to ending an Ice Age
References
- P. Huybers, and G. Denton, "Antarctic temperature at orbital timescales controlled by local summer duration", Nature Geoscience, vol. 1, pp. 787-792, 2008. http://dx.doi.org/10.1038/ngeo311
- L. Stott, A. Timmermann, and R. Thunell, "Southern Hemisphere and Deep-Sea Warming Led Deglacial Atmospheric CO 2 Rise and Tropical Warming", Science, vol. 318, pp. 435-438, 2007. http://dx.doi.org/10.1126/science.1143791
- A. Ganopolski, and D.M. Roche, "On the nature of lead–lag relationships during glacial–interglacial climate transitions", Quaternary Science Reviews, vol. 28, pp. 3361-3378, 2009. http://dx.doi.org/10.1016/j.quascirev.2009.09.019
- J.D. Shakun, P.U. Clark, F. He, S.A. Marcott, A.C. Mix, Z. Liu, B. Otto-Bliesner, A. Schmittner, and E. Bard, "Global warming preceded by increasing carbon dioxide concentrations during the last deglaciation", Nature, vol. 484, pp. 49-54, 2012. http://dx.doi.org/10.1038/nature10915
Another well-deserved honor: Oeschger medal awarded to Michael Mann
As many will have already heard, our colleague, RC co-founder and friend Michael Mann will receive the Oeschger medal from the European Geosciences Union this week in Vienna. We are delighted to announce this and to congratulate Mike.
Hans Oeschger was a Swiss scientist originally trained as a nuclear physicist. His name is well known in climate science, especially because of his discovery, with Willi Dansgaard, of the Dansgaard-Oeschger events (the rapid climate changes during the last glacial period, first observed in Greenland ice cores). He was even better known in the radiocarbon research community as famously having developed one of the first instruments (the “Oeschger counter”) for measuring carbon-14. This paved the way for determining the age of very small organic materials, including samples from deep-sea sediment cores, which eventually led to the validation of the Milankovitch theory of ice ages. Oeschger and his colleagues in Bern were the first to measure the glacial-interglacial change of atmospheric CO2 in ice cores, showing that atmospheric concentrations of CO2 during the glacial period was 50% lower than the pre-industrial concentration, a result predicted by Arrhenius nearly a century earlier. Oeschger may thus be credited with work that was critical to validating two of the most important theories in science: the role of CO2 in climate change, and the role of changes in the earth’s orbit. Oeschger was also an accomplished musician, and was known to join colleagues in playing chamber music at the International Conference on Radiocarbon.
Oeschger left rather large shoes to fill, and it is a great honor for Mike Mann to win an award bearing Oeschger’s name. Most everyone will probably assume that the award is for Mike’s well known “hockey stick” work. No doubt this is part of it, but the Oeschger award has never been given simply for the publication of one study, but rather for a career’s-worth of outstanding achievements. Most of the previous medalists are a good deal more senior than Mike Mann, and include paleoceanographer Laurent Labeyrie, limnologist Francoise Gasse, ice core pioneers Dominique Raynaud and Sigfus Johnsen and number of other major names in the climate and paleoclimate research, including RC’s own Ray Bradley.
Mike’s work, like that of previous award winners, is diverse, and includes pioneering and highly cited work in time series analysis (an elegant use of Thomson’s multitaper spectral analysis approach to detect spatiotemporal oscillations in the climate record and methods for smoothing temporal data), decadal climate variability (the term “Atlantic Multidecadal Oscillation” or “AMO” was coined by Mike in an interview with Science’s Richard Kerr about a paper he had published with Tom Delworth of GFDL showing evidence in both climate model simulations and observational data for a 50-70 year oscillation in the climate system; significantly Mike also published work with Kerry Emanuel in 2006 showing that the AMO concept has been overstated as regards its role in 20th century tropical Atlantic SST changes, a finding recently reaffirmed by a study published in Nature), in showing how changes in radiative forcing from volcanoes can affect ENSO, in examining the role of solar variations in explaining the pattern of the Medieval Climate Anomaly and Little Ice Age, the relationship between the climate changes of past centuries and phenomena such as Atlantic tropical cyclones and global sea level, and even a bit of work in atmospheric chemistry (an analysis of beryllium-7 measurements). Mike’s earliest work, as a physicist, involved studying the behavior of liquids and solids, and trying to understand phenomena such as the structural ordering of high temperature superconductors. In the earth sciences, he has published on topics as varied as the recovery from the KT-boundary mass extinction event and the factors driving long-term changes in the volume of the Great Salt Lake. He has studied and published on the impacts of historical and projected climate change on everything from the behavior of the Asian Summer Monsoon, to Atlantic Hurricanes, to rainfall patterns in the U.S. And for those interested in the hard-nosed statistics by which a scientist’s productivity gets measured, a quick check on the ISI web site will tell you that he has an “H Index” of 40 (that means that 40 of his papers have been cited at least 40 times), more than twenty of his papers have over 100 citations each, and two have over 700. Those are high numbers by any comparison.
But back to the hockey stick. Mike has weathered some rather intense scrutiny and criticism over the years, mostly over the details of a paper nearly 15 years old. Yet the basic conclusions of the “hockey stick” remain, and indeed have been strengthened by subsequent work. Most will be aware, for example, that the conclusion that the past few decades are likely the warmest of the past millennium — i.e. the conclusion of the best-known of Mike’s papers in Nature and Geophysical Research Letters –has never been seriously challenged. But well beyond the simple fact of having been right, Mike’s work was seminal, like Oeschger’s, in playing a pivotal role in launching an entirely new field of study. Although some earlier work along similar lines had been done by other paleoclimate researchers (Ed Cook, Phil Jones, Keith Briffa, Ray Bradley, Malcolm Hughes, and Henry Diaz being just a few examples), before Mike, no one had seriously attempted to use all the available paleoclimate data together, to try to reconstruct the global patterns of climate back in time before the start of direct instrumental observations of climate, or to estimate the underlying statistical uncertainties in reconstructing past temperature changes. Since Mike’s pioneering work (starting in 1995), hundreds of papers have adopted the basic approach he pioneered, and numerous PHD projects have been launched to try to improve upon it. Methods have improved of course, and no doubt will improve further (paleoclimate reconstruction using weather forecast data assimilation methods is the latest and most promising recent development). That Mike is a co-author on many of the latest and most innovative publications in this area — with dozens of different people — attests to the groundbreaking nature of his work.
We look forward to seeing Mike’s award lecture in Vienna, and we offer our heartfelt congratulations to a well-deserved honor. And while we are at it, we should congratulate Mike in advance for his election as a Fellow of the American Geophysical Union; that honor will be bestowed this fall in San Francisco.
Finally, we would be remiss to not mention that Mike has spent much of the past few months touring and lecturing on his experiences as an accidental and reluctant public figure in the debate over human-caused climate change, as detailed in his recent book The Hockey Stick and the Climate Wars: Dispatches from the Front Lines.
P.S. For those at EGU, you should also check out glaciologist Ian Joughin’s award lecture (Wednesday evening) for the Agassiz medal, for his important work in documenting and understanding the acceleration of Antarctica and Greenland’s glaciers.