Following more than a decade of tradition (at least), I’ve now updated the model-observation comparison page to include observed data through to the end of 2019.
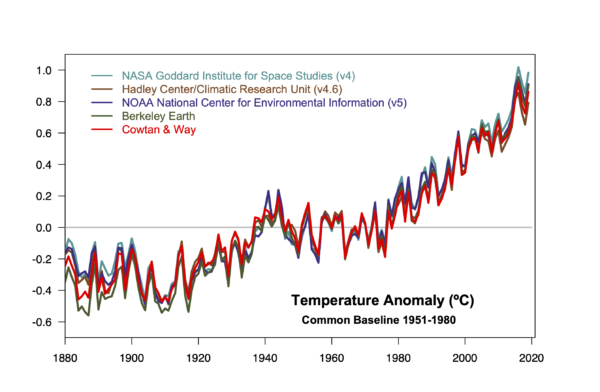
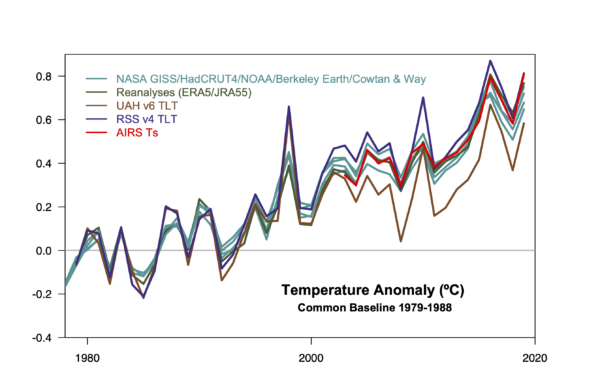
As we discussed a couple of weeks ago, 2019 was the second warmest year in the surface datasets (with the exception of HadCRUT4), and 1st, 2nd or 3rd in satellite datasets (depending on which one). Since this year was slightly above the linear trends up to 2018, it slightly increases the trends up to 2019. There is an increasing difference in trend among the surface datasets because of the polar region treatment. A slightly longer trend period additionally reduces the uncertainty in the linear trend in the climate models.
To summarize, the 1981 prediction from Hansen et al (1981) continues to underpredict the temperature trends due to an underestimate of the transient climate response. The projections in Hansen et al. (1988) bracket the actual changes, with the slight overestimate in scenario B due to the excessive anticipated growth rate of CFCs and CH4 which did not materialize. The CMIP3 simulations continue to be spot on (remarkably), with the trend in the multi-model ensemble mean effectively indistinguishable from the trends in the observations. Note that this doesn’t mean that CMIP3 ensemble means are perfect – far from it. For Arctic trends (incl. sea ice) they grossly underestimated the changes, and overestimated them in the tropics.
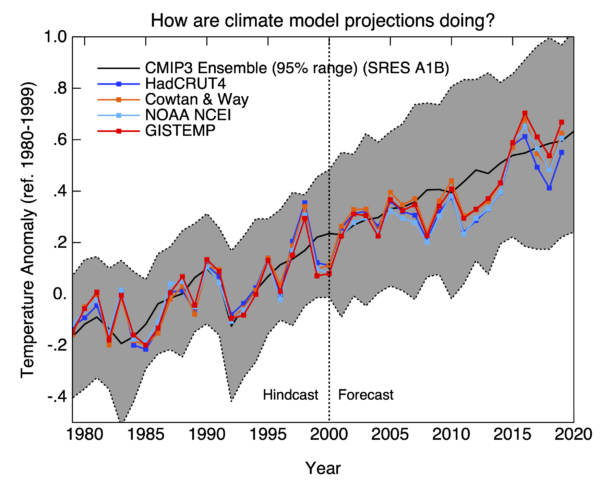
The CMIP5 ensemble mean global surface temperature trends slightly overestimate the observed trend, mainly because of a short-term overestimate of solar and volcanic forcings that was built into the design of the simulations around 2009/2010 (see Schmidt et al (2014). This is also apparent in the MSU TMT trends, where the observed trends (which themselves have a large spread) are at the edge of the modeled histogram.
A number of people have remarked over time on the reduction of the spread in the model projections in CMIP5 compared to CMIP3 (by about 20%). This is due to a wider spread in forcings used in CMIP3 – models varied enormously on whether they included aerosol indirect effects, ozone depletion and what kind of land surface forcing they had. In CMIP5, most of these elements had been standardized. This reduced the spread, but at the cost of underestimating the uncertainty in the forcings. In CMIP6, there will be a more controlled exploration of the forcing uncertainty (but given the greater spread of the climate sensitivities, it might be a minor issue).
Over the years, the model-observations comparison page is regularly in the top ten of viewed pages on RealClimate, and so obviously fills a need. And so we’ll continue to keep it updated, and perhaps expand it over time. Please leave suggestions for changes in the comments below.
References
- J. Hansen, D. Johnson, A. Lacis, S. Lebedeff, P. Lee, D. Rind, and G. Russell, "Climate Impact of Increasing Atmospheric Carbon Dioxide", Science, vol. 213, pp. 957-966, 1981. http://dx.doi.org/10.1126/science.213.4511.957
- J. Hansen, I. Fung, A. Lacis, D. Rind, S. Lebedeff, R. Ruedy, G. Russell, and P. Stone, "Global climate changes as forecast by Goddard Institute for Space Studies three‐dimensional model", Journal of Geophysical Research: Atmospheres, vol. 93, pp. 9341-9364, 1988. http://dx.doi.org/10.1029/JD093iD08p09341
- G.A. Schmidt, D.T. Shindell, and K. Tsigaridis, "Reconciling warming trends", Nature Geoscience, vol. 7, pp. 158-160, 2014. http://dx.doi.org/10.1038/ngeo2105