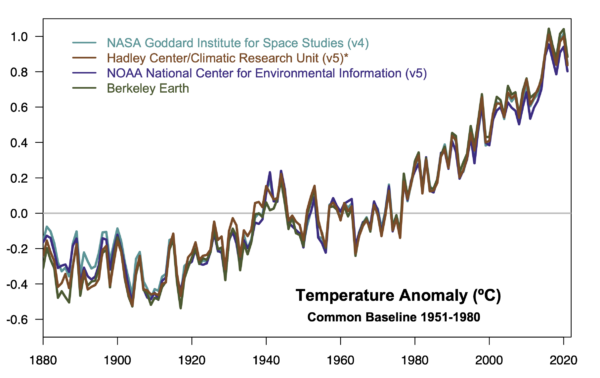
One of our most-read old posts is the step-by-step explanation for why increasing CO2 is a significant problem (The CO2 problem in 6 easy steps). However, that was written in 2007 – 15 years ago! While the basic steps and concepts have not changed, there’s 15 years of more data, updates in some of the details and concepts, and (it turns out) better graphics to accompany the text. And so, here is a mildly updated and referenced version that should be a little more useful.
[Read more…] about The CO2 problem in six easy steps (2022 Update)Instrumental Record
River Ice break-up trends 2022
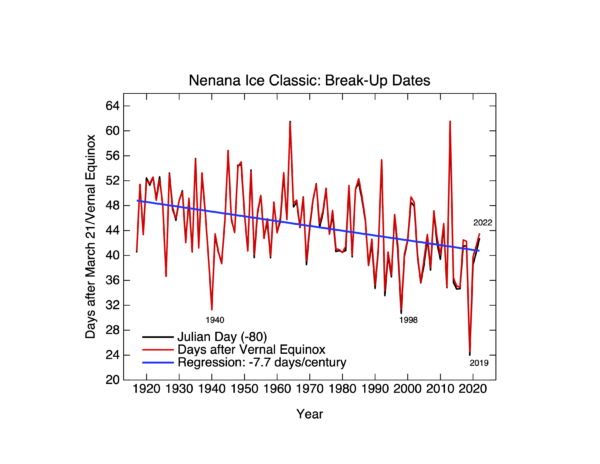
As in previous years, the spring break-up of river ice on the Tanana River at Nenana and the Yukon River at Dawson City in Canada (new! h/t Ed Wiebe), is a great opportunity to highlight phenology that indicates that the planet is in fact reacting to the ongoing global warming. As we’ve done in previous years, the Nenana dates can be plotted and show a clear trend towards earlier break-ups (by about 8 days/century over the whole record, or 13 days/century since 1975).
2022 was on trend, and in 2014, I noted that May 3rd was the most likely date given the trends until then.
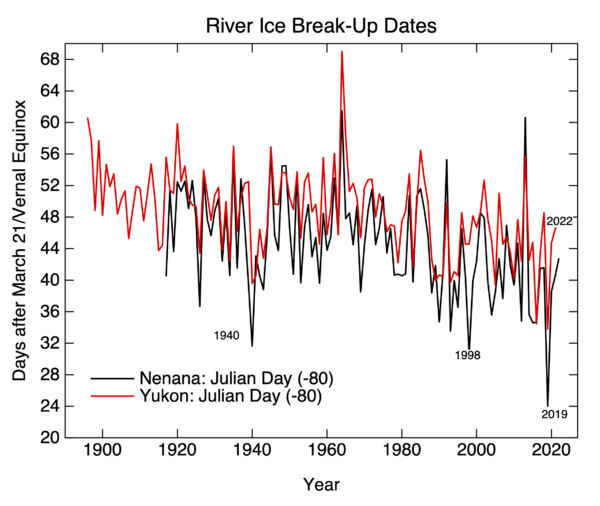
Dawson City in the Yukon is about 250 miles east of Nenana which is close enough for the seasonal anomalies in climate to be quite highly correlated. So one might expect that the break-up dates would be similarly correlated… and indeed they are:
The ice at Dawson breaks up on average 3.8 days later than the ice at Nenana (5.1 days this year), but the correlation between the two series is an impressive 0.82. There have been 15 times the ice went out within 24 hours of each other and in 1963 they broke up less than 3 minutes apart! The trends are likewise very similar 7.7±3.8 days/century for Nenana, compared to 6.5±3.1 days/century since 1917. This pretty much puts paid to the occasional claim of the urban heat island in Fairbanks affecting the water and causing the trend.
[Update: I misunderstood the Yukon river break up website, and erroneously stated that the break-up was on May 2nd. It was not. I’ll update this again when it has. Apologies.]
[Update II: The Yukon river ice broke up on May 7, and I’ve updated the graph and text.]
Digital Twinge
A couple of weeks ago the EU announced that they were funding a project called DestinE (Destination Earth) to build ‘digital twins’ of the Earth System to support policy making and rapid reaction to weather and climate events.
While the term ‘digitial twin’ has a long history in the engineering world, it’s only recently been applied to Earth System Modeling, and is intended (I surmise, as does Bryan Lawrence) to denote something more than the modeling of either weather or climate that we’ve been doing for years. But what exactly? And is it an achievable goal or just a rebranding effort of things that are happening anyway?
[Read more…] about Digital TwingeIssues and Errors in a new Scafetta paper
Earlier this week, a new paper appeared in GRL by Nicola Scafetta (Scafetta, 2022) which purported to conclude that the CMIP6 models with medium or high climate sensitivity (higher than 3ºC) were not consistent with recent historical temperature changes. Since there have been a number of papers already on this topic, notably Tokarska et al (2020), which did not come to such a conclusion, it is worthwhile to investigate where Scafetta’s result comes from. Unfortunately, it appears to emerge from a mis-appreciation of what is in the CMIP6 archive, an inappropriate statistical test, and a total neglect of observational uncertainty and internal variability.
[Read more…] about Issues and Errors in a new Scafetta paperReferences
- N. Scafetta, "Advanced Testing of Low, Medium, and High ECS CMIP6 GCM Simulations Versus ERA5‐T2m", Geophysical Research Letters, vol. 49, 2022. http://dx.doi.org/10.1029/2022GL097716
- K.B. Tokarska, M.B. Stolpe, S. Sippel, E.M. Fischer, C.J. Smith, F. Lehner, and R. Knutti, "Past warming trend constrains future warming in CMIP6 models", Science Advances, vol. 6, 2020. http://dx.doi.org/10.1126/sciadv.aaz9549
Another dot on the graphs (Part II)
We have now updated the model-observations comparison page for the 2021 SAT and MSU TMT datasets. Mostly this is just ‘another dot on the graphs’ but we have made a couple of updates of note. First, we have updated the observational products to their latest versions (i.e. HadCRUT5, NOAA-STAR 4.1 etc.), though we are still using NOAA’s GlobalTemp v5 – the Interim version will be available later this year. Secondly, we have added a comparison of the observations to the new CMIP6 model ensemble.
[Read more…] about Another dot on the graphs (Part II)Another dot on the graph
So last week was the annual release of the temperature records from NASA, NOAA and Berkeley Earth. The Copernicus ERA5 data was released a few days ago, and the HadCRUT data will follow soon. Unlike in years past, there is no longer any serious discrepancy between the records – which use multiple approaches for the ocean temperatures, the homogenization of the weather stations records, and interpolation.
Depending on the product, 2021 was either the 5th, 6th or 7th warmest year, but in all cases, it is part of the string of warm years (since 2015) that have all been more than 1ºC warmer than the late 19th C.
[Read more…] about Another dot on the graphA Tale of Two Hockey Sticks
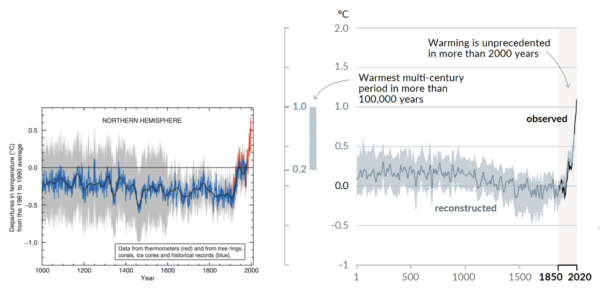
Two decades ago, the so-called “Hockey Stick” curve, published in 1999 by me and my co-authors (Mann, Bradley and Hughes, 1999), was featured in the all-important “Summary for Policy Makers” (SPM) of the 2001 IPCC Third Assessment report. The curve, which depicted temperature variations over the past 1000 years estimated from “proxy data such as tree rings, corals, ice cores, and lake sediments”, showed the upward spiking of modern temperatures (the “blade”) as it dramatically ascends, during the industrial era, upward from the “handle” that describes the modest, slightly downward steady trend that preceded it.
The Hockey Stick became an icon in the case for human-caused climate change, and I found myself at the center of the contentious climate debate (I’ve described my experiences in “The Hockey Stick and the Climate Wars”).
Featured two decades later now in the AR6 SPM is a longer Hockey Stick with an even sharper blade. And no longer just for the Northern Hemisphere, it now covers the whole globe. The recent warming is seen not only to be unprecedented over the past millennium, but tentatively, the past hundred millennia.
The relevant statements in the SPM and Technical Summary are:
A.2.2 Global surface temperature has increased faster since 1970 than in any other 50-year period over at least the last 2000 years (high confidence). Temperatures during the most recent decade (2011–2020) exceed those of the most recent multi-century warm period, around 6500 years ago13 [0.2°C to 1°C relative to 1850– 1900] (medium confidence). Prior to that, the next most recent warm period was about 125,000 years ago when the multi-century temperature [0.5°C to 1.5°C relative to 1850–1900] overlaps the observations of the most recent decade (medium confidence). {Cross-Chapter Box 2.1, 2.3, Cross-Section Box TS.1}
SPM AR6
Global surface temperature has increased by 1.09 [0.95 to 1.20] °C from 1850–1900 to 2011–2020, and the last decade was more likely than not warmer than any multi-centennial period after the Last Interglacial, roughly 125,000 years ago.
Cross Section Box TS.1
As the new IPCC report lays bare (you can find my full commentary about the new report at Time Magazine), we are engaged in a truly unprecedented and fundamentally dangerous experiment with our planet.
References
- M.E. Mann, R.S. Bradley, and M.K. Hughes, "Northern hemisphere temperatures during the past millennium: Inferences, uncertainties, and limitations", Geophysical Research Letters, vol. 26, pp. 759-762, 1999. http://dx.doi.org/10.1029/1999GL900070
We are not reaching 1.5ºC earlier than previously thought
Guest commentary by Malte Meinshausen, Zebedee Nicholls, and Piers Forster
Of all the troubling headlines emerging from the release of the Intergovernmental Panel on Climate Change (IPCC) WG1 report, one warning will surely dominate headlines in the next days and weeks: Earth is likely to reach the crucial 1.5℃ warming limit in the early 2030s.
In 2018, the IPCC Special Report on 1.5C warming stated in its summary for policy makers that the world was likely to cross the 1.5℃ threshold between 2030 and 2052, if current warming trends continue.
In this latest AR6, a more comprehensive assessment was undertaken to estimate when a warming level of 1.5℃ might be reached. As a result, some early media reports suggest 1.5ºC warming is now anticipated 10-years earlier than previously assumed (AFR, THE TIMES).
We want to explain here why that is not backed up by a rigorous comparison of the SR1.5 and AR6 reports. In fact, the science in the previous SR1.5 report and the new AR6 report are remarkably consistent.
[Read more…] about We are not reaching 1.5ºC earlier than previously thoughtThe IPCC Sixth Assessment Report
Climate scientists are inordinately excited by the release of a new IPCC report (truth be told, that’s a bit odd – It’s a bit like bringing your end-of-(seven)-year project home and waiting anxiously to see how well it will be received). So, in an uncharacteristically enthusiastic burst of effort, we have a whole suite of posts on the report for you to read.
- AR6 of the Best. Half a dozen takeaways from the report from Gavin
- New (8/13): Sea Level Rise in AR6 from Stefan
- A Tale of Two Hockey Sticks by Mike
- #NotAllModels discusses the use (and mis-use) of the CMIP6 ensemble by Gavin
- We are not reaching 1.5ºC earlier than previously thought from guest authors Malte Meinshausen, Zebedee Nicholls and Piers Forster
- New (8/12): Deciphering the SPM AR6 WG1 Code by Rasmus
- New (8/12): A deep dive into the IPCC’s updated carbon budget numbers from guest author Joeri Rogelj
If/when we add some more commentary as we digest the details and we see how the report is being discussed, we’ll link it from here. Feel free to discuss general issues with the report in the comments here, and feel free to suggest further deep dives we might pursue.
Rapid attribution of PNW heatwave
Summary: It was almost impossible for the temperatures seen recently in the Pacific North West heatwave to have occurred without global warming. And only improbable with it.
It’s been clear for at least a decade that global warming has been in general increasing the intensity of heat waves, with clear trends in observed maximum temperatures that match what climate models have been predicting. For the specific situation in the Pacific NorthWest at the end of June, we now have the first attribution analysis from the World Weather Attribution group – a consortium of climate experts from around the world working on extreme event attribution. Their preprint (Philip et al.) is available here.