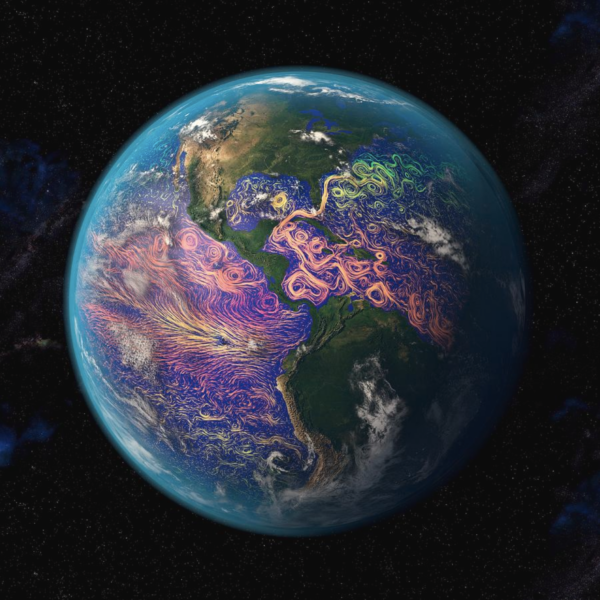
What’s good (and what’s not quite ready) about plans for ‘k-scale’ climate modeling?
[Read more…] about Mmm-k scale climate modelsClimate science from climate scientists...
by Gavin

What’s good (and what’s not quite ready) about plans for ‘k-scale’ climate modeling?
[Read more…] about Mmm-k scale climate modelsby Gavin
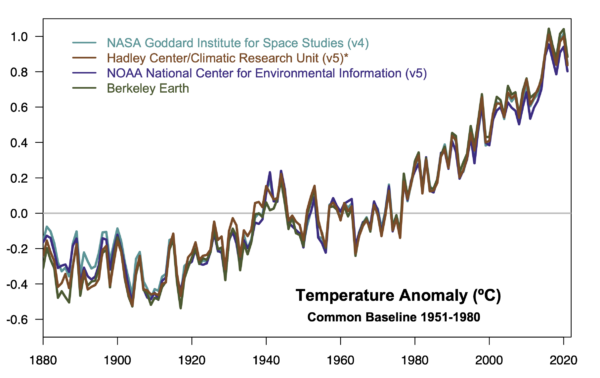
So last week was the annual release of the temperature records from NASA, NOAA and Berkeley Earth. The Copernicus ERA5 data was released a few days ago, and the HadCRUT data will follow soon. Unlike in years past, there is no longer any serious discrepancy between the records – which use multiple approaches for the ocean temperatures, the homogenization of the weather stations records, and interpolation.

Depending on the product, 2021 was either the 5th, 6th or 7th warmest year, but in all cases, it is part of the string of warm years (since 2015) that have all been more than 1ºC warmer than the late 19th C.
[Read more…] about Another dot on the graphby group
This month’s open thread. Northern Hemisphere Spring is on it’s way, along with peak Arctic/minimum Antarctic sea ice, undoubtedly more discussion about the polar vortex, and the sharpening up of the (currently very uncertain) ENSO forecast for the rest of this year.
by Gavin
Yesterday was the day that NASA, NOAA, the Hadley Centre and Berkeley Earth delivered their final assessments for temperatures in Dec 2020, and thus their annual summaries. The headline results have received a fair bit of attention in the media (NYT, WaPo, BBC, The Guardian etc.) and the conclusion that 2020 was pretty much tied with 2016 for the warmest year in the instrumental record is robust.
[Read more…] about 2020 Hindsightby Gavin

No-one needs another litany of all the terrible things that happened this year, but there are three areas relevant to climate science that are worth thinking about:
I need to take time to note that there has been human toll of Covid-19 on climate science, ranging from the famous (John Houghton) to the families of people you never hear about in the press but whose work underpins the data collection, analysis and understanding we all rely on. This was/is a singular tragedy.
With the La Niña now peaking in the tropical Pacific, we can expect a slightly cooler year in 2021 and perhaps a different character of weather events, though the long-term trends will persist. My hope is that the cracks in the system that 2020 has revealed (across a swathe of issues) can serve as an motivation to improve resilience, equity and planning, across the board. That might well be the most important climate impact of all.
A happier new year to you all.
by Stefan
Established understanding of the AMOC (sometimes popularly called Gulf Stream System) says that a weaker AMOC leads to a slightly cooler global mean surface temperature due to changes in ocean heat storage. But now, a new paper in Nature claims the opposite and even predicts a phase of rapid global warming. What’s the story?
By Stefan Rahmstorf and Michael Mann
In 1751, the captain of an English slave-trading ship made a historic discovery. While sailing at latitude 25°N in the subtropical North Atlantic Ocean, Captain Henry Ellis lowered a “bucket sea-gauge” down through the warm surface waters into the deep. By means of a long rope and a system of valves, water from various depths could be brought up to the deck, where its temperature was read from a built-in thermometer. To his surprise Captain Ellis found that the deep water was icy cold.
These were the first ever recorded temperature measurements of the deep ocean. And they revealed what is now known to be a fundamental feature of all the world oceans: deep water is always cold. The warm waters of the tropics and subtropics are confined to a thin layer at the surface; the heat of the sun does not slowly warm up the depths as might be expected. Ellis wrote:
“This experiment, which seem’d at first but mere food for curiosity, became in the interim very useful to us. By its means we supplied our cold bath, and cooled our wines or water at pleasure; which is vastly agreeable to us in this burning climate.”
[Read more…] about Does a slow AMOC increase the rate of global warming?
by Stefan
2017 is set to be one of warmest years on record. Gavin has been making regular forecasts of where 2017 will end up, and it is now set to be #2 or #3 in the list of hottest years:
With update thru September, ~80% chance of 2017 being 2nd warmest yr in the GISTEMP analysis (~20% for 3rd warmest). pic.twitter.com/k3CEM9rGHY
— Gavin Schmidt (@ClimateOfGavin) October 17, 2017
In either case it will be the warmest year on record that was not boosted by El Niño. I’ve been asked several times whether that is surprising. After all, the El Niño event, which pushed up the 2016 temperature, is well behind us. El Niño conditions prevailed in the tropical Pacific from October 2014 throughout 2015 and in the first half of 2016, giving way to a cold La Niña event in the latter half of 2016. (Note that global temperature lags El Niño variations by several months so this La Niña should have cooled 2017.) [Read more…] about El Niño and the record years 1998 and 2016
by group
Guest Commentary by Scott Denning
The Orbiting Carbon Observatory (OCO-2) was launched in 2014 to make fine-scale measurements of the total column concentration of CO2 in the atmosphere. As luck would have it, the initial couple of years of data from OCO-2 documented a period with the fastest rate of CO2 increase ever measured, more than 3 ppm per year (Jacobson et al, 2016;Wang et al, 2017) during a huge El Niño event that also saw global temperatures spike to record levels.
As part of a series of OCO-2 papers being published this week, a new Science paper by Junjie Liu and colleagues used NASA’s comprehensive Carbon Monitoring System to analyze millions of measurements from OCO-2 and other satellites to map the impact of the 2015-16 El Niño on sources and sinks of CO2, providing insight into the mechanisms controlling carbon-climate feedback.
[Read more…] about O Say Can You CO2…
by Gavin
I have a post at Nate Silver’s 538 site on how we can predict annual surface temperature anomalies based on El Niño and persistence – including a (by now unsurprising) prediction for a new record in 2016 and a slightly cooler, but still very warm, 2017.
[Read more…] about Predicting annual temperatures a year ahead
by Gavin
Some of you that follow my twitter account will have already seen this, but there was a particularly amusing episode of Q&A on Australian TV that pitted Prof. Brian Cox against a newly-elected politician who is known for his somewhat fringe climate ‘contrarian’ views. The resulting exchanges were fun:
[Read more…] about Australian silliness and July temperature records
1,363 posts
11 pages
242,796 comments