Guest post from Drew Shindell, NASA GISS
Our recent paper “Climate response to regional radiative forcing during the twentieth century”, has generated some interesting discussion (some of it very ‘interesting’ indeed). So this post is an attempt to give a better context to the methods and implications of the study.
[Read more…] about Yet more aerosols: Comment on Shindell and Faluvegi
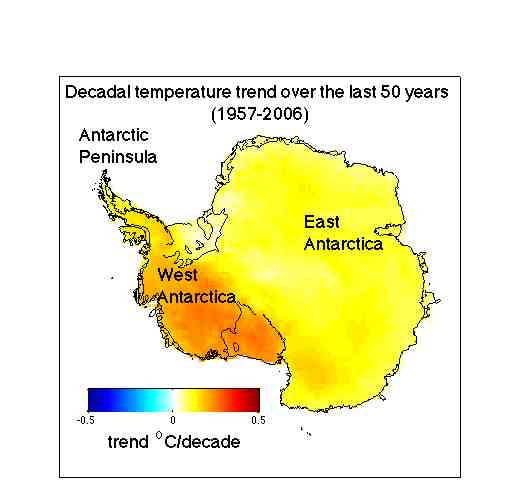 The paper shows that Antarctica has been warming for the last 50 years, and that it has been warming especially in West Antarctica (see the figure). The results are based on a statistical blending of satellite data and temperature data from weather stations. The results don’t depend on the statistics alone. They are backed up by independent data from automatic weather stations, as shown in our paper as well as in updated work by Bromwich, Monaghan and others (see their AGU abstract,