Along with David’s online class a number of new climate science Massive Online Open Courses (MOOCs) are now coming online.
Climate modelling
A Bit More Sensitive…
by Michael E. Mann and Gavin Schmidt
This time last year we gave an overview of what different methods of assessing climate sensitivity were giving in the most recent analyses. We discussed the three general methods that can be used:
The first is to focus on a time in the past when the climate was different and in quasi-equilibrium, and estimate the relationship between the relevant forcings and temperature response (paleo-constraints). The second is to find a metric in the present day climate that we think is coupled to the sensitivity and for which we have some empirical data (climatological constraints). Finally, there are constraints based on changes in forcing and response over the recent past (transient constraints).
All three constraints need to be reconciled to get a robust idea what the sensitivity really is.
A new paper using the second ‘climatological’ approach by Steve Sherwood and colleagues was just published in Nature and like Fasullo and Trenberth (2012) (discussed here) suggests that models with an equilibrium climate sensitivity (ECS) of less than 3ºC do much worse at fitting the observations than other models.
[Read more…] about A Bit More Sensitive…
References
- S.C. Sherwood, S. Bony, and J. Dufresne, "Spread in model climate sensitivity traced to atmospheric convective mixing", Nature, vol. 505, pp. 37-42, 2014. http://dx.doi.org/10.1038/nature12829
- J.T. Fasullo, and K.E. Trenberth, "A Less Cloudy Future: The Role of Subtropical Subsidence in Climate Sensitivity", Science, vol. 338, pp. 792-794, 2012. http://dx.doi.org/10.1126/science.1227465
The global temperature jigsaw
Since 1998 the global temperature has risen more slowly than before. Given the many explanations for colder temperatures discussed in the media and scientific literature (La Niña, heat uptake of the oceans, arctic data gap, etc.) one could jokingly ask why no new ice age is here yet. This fails to recognize, however, that the various ingredients are small and not simply additive. Here is a small overview and attempt to explain how the different pieces of the puzzle fit together.
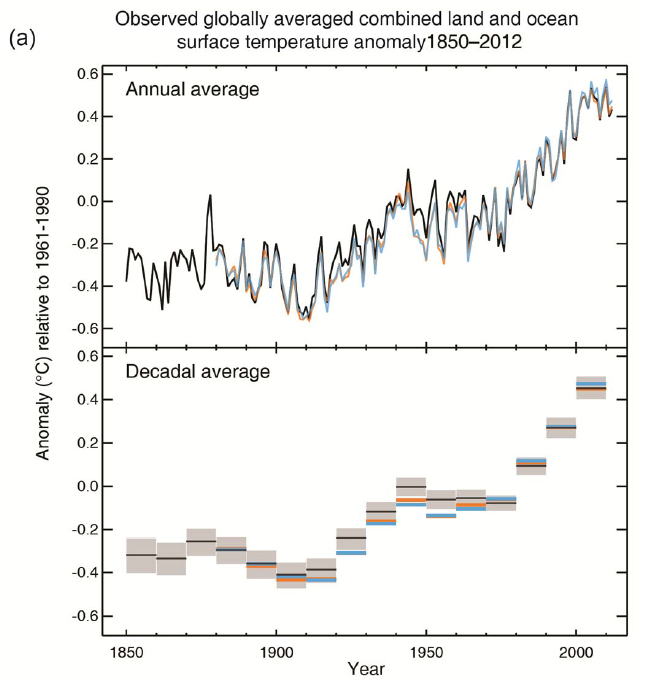
Figure 1 The global near-surface temperatures (annual values at the top, decadal means at the bottom) in the three standard data sets HadCRUT4 (black), NOAA (orange) and NASA GISS (light blue). Graph: IPCC 2013. [Read more…] about The global temperature jigsaw
Simple physics and climate
No doubt, our climate system is complex and messy. Still, we can sometimes make some inferences about it based on well-known physical principles. Indeed, the beauty of physics is that a complex systems can be reduced into simple terms that can be quantified, and the essential aspects understood.
A recent paper by Sloan and Wolfendale (2013) provides an example where they derive a simple conceptual model of how the greenhouse effect works from first principles. They show the story behind the expression saying that a doubling in CO2 should increase the forcing by a factor of 1+log|2|/log|CO2|. I have a fondness for such simple conceptual models (e.g. I’ve made my own attempt posted at arXiv) because they provide a general picture of the essence – of course their precision is limited by their simplicity.
[Read more…] about Simple physics and climate
References
- T. Sloan, and A.W. Wolfendale, "Cosmic rays, solar activity and the climate", Environmental Research Letters, vol. 8, pp. 045022, 2013. http://dx.doi.org/10.1088/1748-9326/8/4/045022
From global climate change to local consequences
Some will be luckier than others when it comes to climate change. The effects of a climate change on me will depend on where I live. In some regions, changes may not be as noticeable as in others. So what are the impacts in my region?
![]()
[Read more…] about From global climate change to local consequences
The IPCC AR5 attribution statement
Last year I discussed the basis of the AR4 attribution statement:
Most of the observed increase in global average temperatures since the mid-20th century is very likely due to the observed increase in anthropogenic greenhouse gas concentrations.
In the new AR5 SPM (pdf), there is an analogous statement:
It is extremely likely that more than half of the observed increase in global average surface temperature from 1951 to 2010 was caused by the anthropogenic increase in greenhouse gas concentrations and other anthropogenic forcings together. The best estimate of the human-induced contribution to warming is similar to the observed warming over this period.
This includes differences in the likelihood statement, drivers and a new statement on the most likely amount of anthropogenic warming.
The new IPCC climate report
The time has come: the new IPCC report is here! After several years of work by over 800 scientists from around the world, and after days of extensive discussion at the IPCC plenary meeting in Stockholm, the Summary for Policymakers was formally adopted at 5 o’clock this morning. Congratulations to all the colleagues who were there and worked night shifts. The full text of the report will be available online beginning of next week. Realclimate summarizes the key findings and shows the most interesting graphs.
Update 29 Sept: Full (un-copyedited) report available here.
Global warming
It is now considered even more certain (> 95%) that human influence has been the dominant cause of the observed warming since the mid-20th century. Natural internal variability and natural external forcings (eg the sun) have contributed virtually nothing to the warming since 1950 – the share of these factors was narrowed down by IPCC to ± 0.1 degrees. The measured temperature evolution is shown in the following graph.

Figure 1 The measured global temperature curve from several data sets. Top: annual values. Bottom: averaged values over a decade.
[Read more…] about The new IPCC climate report
What ocean heating reveals about global warming
The heat content of the oceans is growing and growing. That means that the greenhouse effect has not taken a pause and the cold sun is not noticeably slowing global warming.
NOAA posts regularly updated measurements of the amount of heat stored in the bulk of the oceans. For the upper 2000 m (deeper than that not much happens) it looks like this:
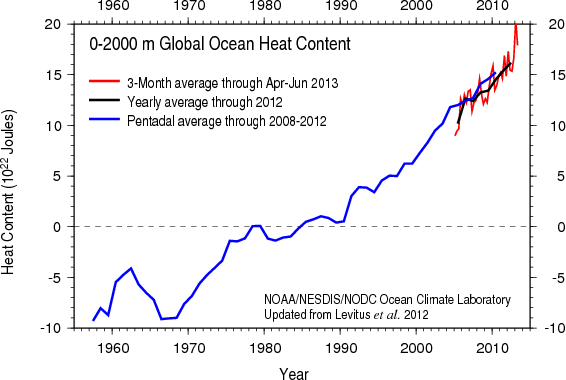
Change in the heat content in the upper 2000 m of the world’s oceans. Source: NOAA
[Read more…] about What ocean heating reveals about global warming
On mismatches between models and observations
It is a truism that all models are wrong. Just as no map can capture the real landscape and no portrait the true self, numerical models by necessity have to contain approximations to the complexity of the real world and so can never be perfect replications of reality. Similarly, any specific observations are only partial reflections of what is actually happening and have multiple sources of error. It is therefore to be expected that there will be discrepancies between models and observations. However, why these arise and what one should conclude from them are interesting and more subtle than most people realise. Indeed, such discrepancies are the classic way we learn something new – and it often isn’t what people first thought of.
[Read more…] about On mismatches between models and observations
The answer is blowing in the wind: The warming went into the deep end
There has been an unusual surge of interest in the climate sensitivity based on the last decade’s worth of temperature measurements, and a lengthy story in the Economist tries to argue that the climate sensitivity may be lower than previously estimated. I think its conclusion is somewhat misguided because it missed some important pieces of information (also see skepticalscience’s take on this story here).

While the Economist referred to some unpublished work, it missed a new paper by Balmaseda et al. (2013) which provides a more in-depth insight. Balmaseda et al suggest that the recent years may not have much effect on the climate sensitivity after all, and according to their analysis, it is the winds blowing over the oceans that may be responsible for the ‘slow-down’ presented in the Economist.
[Read more…] about The answer is blowing in the wind: The warming went into the deep end
References
- M.A. Balmaseda, K.E. Trenberth, and E. Källén, "Distinctive climate signals in reanalysis of global ocean heat content", Geophysical Research Letters, vol. 40, pp. 1754-1759, 2013. http://dx.doi.org/10.1002/grl.50382