As previewed last weekend, I spent most of last week at a workshop on Climate Sensitivity hosted by the Max Planck Institute at Schloss Ringberg. It was undoubtedly one of the better workshops I’ve attended – it was focussed, deep and with much new information to digest (some feel for the discussion can be seen from the #ringberg15 tweets). I’ll give a brief overview of my impressions below.
Climate modelling
Climate Sensitivity Week
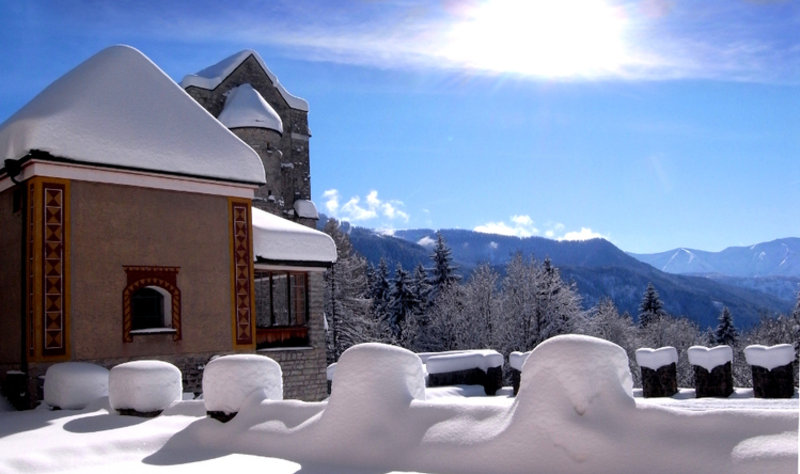 Some of you will be aware that there is a workshop on Climate Sensitivity this week at Schloss Ringberg in southern Germany. The topics to be covered include how sensitivity is defined (and whether it is even meaningful (Spoiler, yes it is)), what it means, how it can be constrained, what the different flavours signify etc. There is an impressive list of attendees with a very diverse range of views on just about everything, and so I am looking forward to very stimulating discussions.
The Soon fallacy
As many will have read, there were a number of press reports (NYT, Guardian, InsideClimate) about the non-disclosure of Willie Soon’s corporate funding (from Southern Company (an energy utility), Koch Industries, etc.) when publishing results in journals that require such disclosures. There are certainly some interesting questions to be asked (by the OIG!) about adherence to the Smithsonian’s ethics policies, and the propriety of Smithsonian managers accepting soft money with non-disclosure clauses attached.
However, a valid question is whether the science that arose from these funds is any good? It’s certainly conceivable that Soon’s work was too radical for standard federal research programs and that these energy companies were really taking a chance on blue-sky high risk research that might have the potential to shake things up. In such a case, someone might be tempted to overlook the ethical lapses and conflicts of interest for the sake of scientific advancement (though far too many similar post-hoc justifications have been used to excuse horrific unethical practices for this to be remotely defendable).
Unfortunately, the evidence from the emails and the work itself completely undermines that argument because the work and the motivation behind it are based on a scientific fallacy.
[Read more…] about The Soon fallacy
Absolute temperatures and relative anomalies
Most of the images showing the transient changes in global mean temperatures (GMT) over the 20th Century and projections out to the 21st C, show temperature anomalies. An anomaly is the change in temperature relative to a baseline which usually the pre-industrial period, or a more recent climatology (1951-1980, or 1980-1999 etc.). With very few exceptions the changes are almost never shown in terms of absolute temperatures. So why is that?
[Read more…] about Absolute temperatures and relative anomalies
Climate response estimates from Lewis & Curry
Guest commentary from Richard Millar (U. Oxford)
The recent Lewis and Curry study of climate sensitivity estimated from the transient surface temperature record is being lauded as something of a game-changer – but how much of a game-changer is it really?
[Read more…] about Climate response estimates from Lewis & Curry
References
- N. Lewis, and J.A. Curry, "The implications for climate sensitivity of AR5 forcing and heat uptake estimates", Climate Dynamics, vol. 45, pp. 1009-1023, 2014. http://dx.doi.org/10.1007/s00382-014-2342-y
IPCC attribution statements redux: A response to Judith Curry
I have written a number of times about the procedure used to attribute recent climate change (here in 2010, in 2012 (about the AR4 statement), and again in 2013 after AR5 was released). For people who want a summary of what the attribution problem is, how we think about the human contributions and why the IPCC reaches the conclusions it does, read those posts instead of this one.
The bottom line is that multiple studies indicate with very strong confidence that human activity is the dominant component in the warming of the last 50 to 60 years, and that our best estimates are that pretty much all of the rise is anthropogenic.
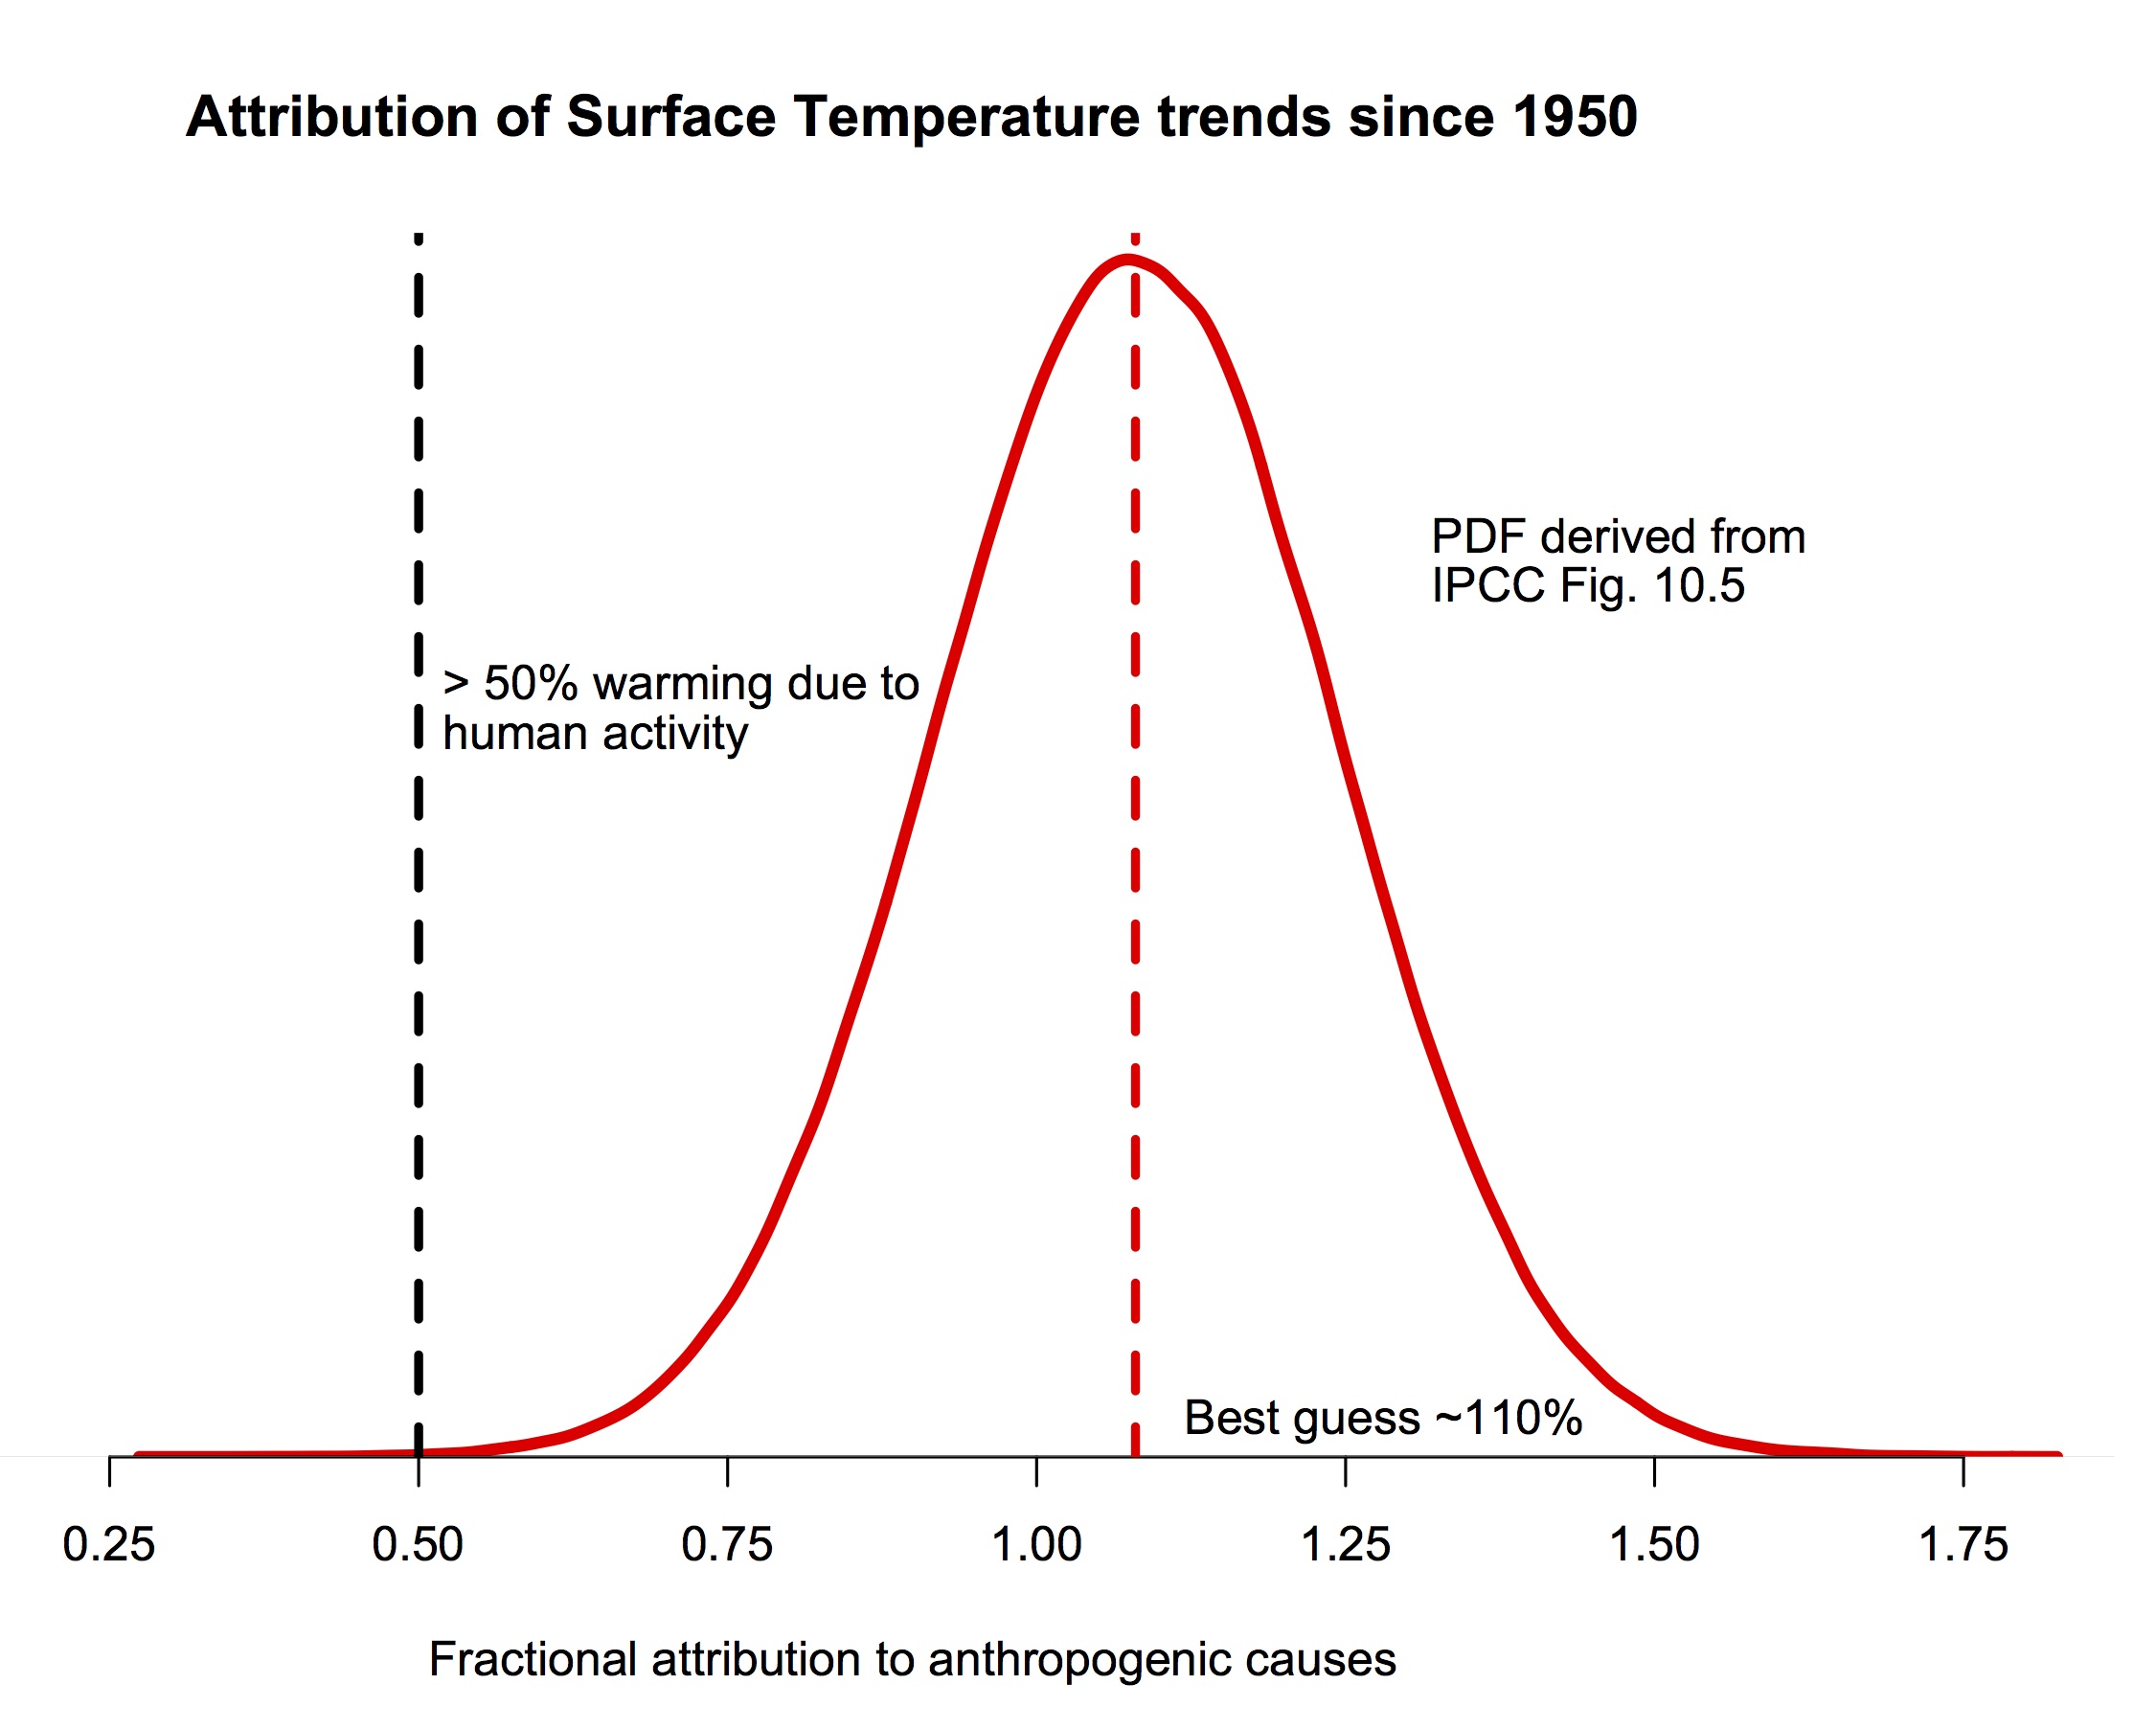
The probability density function for the fraction of warming attributable to human activity (derived from Fig. 10.5 in IPCC AR5). The bulk of the probability is far to the right of the “50%” line, and the peak is around 110%.
If you are still here, I should be clear that this post is focused on a specific claim Judith Curry has recently blogged about supporting a “50-50” attribution (i.e. that trends since the middle of the 20th Century are 50% human-caused, and 50% natural, a position that would center her pdf at 0.5 in the figure above). She also commented about her puzzlement about why other scientists don’t agree with her. Reading over her arguments in detail, I find very little to recommend them, and perhaps the reasoning for this will be interesting for readers. So, here follows a line-by-line commentary on her recent post. Please excuse the length.
[Read more…] about IPCC attribution statements redux: A response to Judith Curry
Labels for climate data
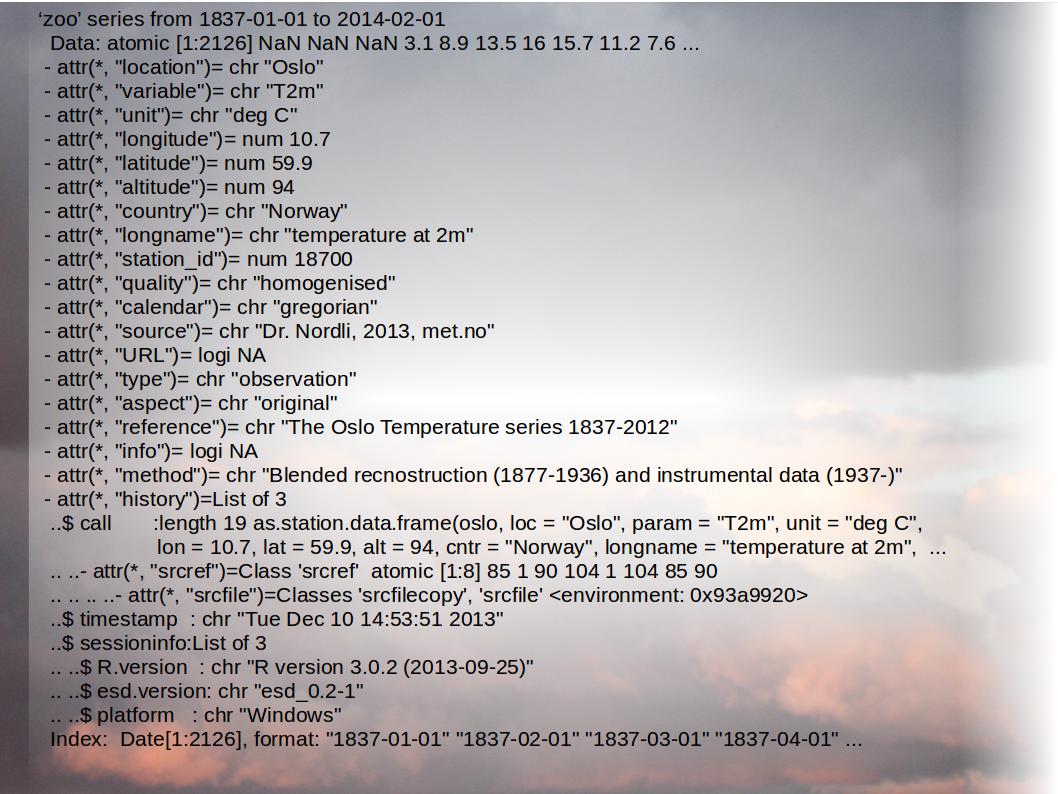 “These results are quite strange”, my colleague told me. He analysed some of the recent climate model results from an experiment known by the cryptic name ‘CMIP5‘. It turned out that the results were ok, but we had made an error when reading and processing the model output. The particular climate model that initially gave the strange results had used a different calendar set-up to the previous models we had examined.
Shindell: On constraining the Transient Climate Response
Guest commentary from Drew Shindell
There has been a lot of discussion of my recent paper in Nature Climate Change (Shindell, 2014). That study addressed a puzzle, namely that recent studies using the observed changes in Earth’s surface temperature suggested climate sensitivity is likely towards the lower end of the estimated range. However, studies evaluating model performance on key observed processes and paleoclimate evidence suggest that the higher end of sensitivity is more likely, partially conflicting with the studies based on the recent transient observed warming. The new study shows that climate sensitivity to historical changes in the abundance of aerosol particles in the atmosphere is larger than the sensitivity to CO2, primarily because the aerosols are largely located near industrialized areas in the Northern Hemisphere middle and high latitudes where they trigger more rapid land responses and strong snow & ice feedbacks. Therefore studies based on observed warming have underestimated climate sensitivity as they did not account for the greater response to aerosol forcing, and multiple lines of evidence are now consistent in showing that climate sensitivity is in fact very unlikely to be at the low end of the range in recent estimates.
[Read more…] about Shindell: On constraining the Transient Climate Response
References
- D.T. Shindell, "Inhomogeneous forcing and transient climate sensitivity", Nature Climate Change, vol. 4, pp. 274-277, 2014. http://dx.doi.org/10.1038/nclimate2136
It never rains but it pause
There has been a veritable deluge of new papers this month related to recent trends in surface temperature. There are analyses of the CMIP5 ensemble, new model runs, analyses of complementary observational data, attempts at reconciliation all the way to commentaries on how the topic has been covered in the media and on twitter. We will attempt to bring the highlights together here. As background, it is worth reading our previous discussions, along with pieces by Simon Donner and Tamino to help put in context what is being discussed here.
Going with the wind
A new paper in Nature Climate Change out this week by England and others joins a number of other recent papers seeking to understand the climate dynamics that have led to the so-called “slowdown” in global warming. As we and others have pointed out previously (e.g. here), the fact that global average temperatures can deviate for a decade or longer from the long term trend comes as no surprise. Moreover, it’s not even clear that the deviation has been as large as is commonly assumed (as discussed e.g. in the Cowtan and Way study earlier this year), and has little statistical significance in any case. Nevertheless, it’s still interesting, and there is much to be learned about the climate system from studying the details.
Several studies have shown that much of the excess heating of the planet due to the radiative imbalance from ever-increasing greenhouses gases has gone into the ocean, rather than the atmosphere (see e.g. Foster and Rahmstorf and Balmaseda et al.). In their new paper, England et al. show that this increased ocean heat uptake — which has occurred mostly in the tropical Pacific — is associated with an anomalous strengthening of the trade winds. Stronger trade winds push warm surface water towards the west, and bring cold deeper waters to the surface to replace them. This raises the thermocline (boundary between warm surface water and cold deep water), and increases the amount of heat stored in the upper few hundred meters of the ocean. Indeed, this is what happens every time there is a major La Niña event, which is why it is globally cooler during La Niña years. One could think of the last ~15 years or so as a long term “La-Niña-like” anomaly (punctuated, of course, by actual El Niño (like the exceptionally warm years 1998, 2005) and La Niña events (like the relatively cool 2011).
A very consistent understanding is thus emerging of the coupled ocean and atmosphere dynamics that have caused the recent decadal-scale departure from the longer-term global warming trend. That understanding suggests that the “slowdown” in warming is unlikely to continue, as England explains in his guest post, below. –Eric Steig
Guest commentary by Matthew England (UNSW)
For a long time now climatologists have been tracking the global average air temperature as a measure of planetary climate variability and trends, even though this metric reflects just a tiny fraction of Earth’s net energy or heat content. But it’s used widely because it’s the metric that enjoys the densest array of in situ observations. The problem of course is that this quantity has so many bumps and kinks, pauses and accelerations that predicting its year-to-year path is a big challenge. Over the last century, no single forcing agent is clearer than anthropogenic greenhouse gases, yet zooming into years or decades, modes of variability become the signal, not the noise. Yet despite these basics of climate physics, any slowdown in the overall temperature trend sees lobby groups falsely claim that global warming is over. Never mind that the globe – our planet – spans the oceans, atmosphere, land and ice systems in their entirety.
This was one of the motivations for our study out this week in Nature Climate Change (England et al., 2014) With the global-average surface air temperature (SAT) more-or-less steady since 2001, scientists have been seeking to explain the climate mechanics of the slowdown in warming seen in the observations during 2001-2013. One simple way to address this is to examine what is different about the recent decade compared to the preceding decade when the global-mean SAT metric accelerated. This can be quantified via decade-mean differences, or via multi-decadal trends, which are roughly equivalent if the trends are more-or-less linear, or if the focus is on the low frequency changes.
[Read more…] about Going with the wind
References
- G. Foster, and S. Rahmstorf, "Global temperature evolution 1979–2010", Environmental Research Letters, vol. 6, pp. 044022, 2011. http://dx.doi.org/10.1088/1748-9326/6/4/044022
- M.A. Balmaseda, K.E. Trenberth, and E. Källén, "Distinctive climate signals in reanalysis of global ocean heat content", Geophysical Research Letters, vol. 40, pp. 1754-1759, 2013. http://dx.doi.org/10.1002/grl.50382
- M.H. England, S. McGregor, P. Spence, G.A. Meehl, A. Timmermann, W. Cai, A.S. Gupta, M.J. McPhaden, A. Purich, and A. Santoso, "Recent intensification of wind-driven circulation in the Pacific and the ongoing warming hiatus", Nature Climate Change, vol. 4, pp. 222-227, 2014. http://dx.doi.org/10.1038/nclimate2106