There has been a veritable deluge of new papers this month related to recent trends in surface temperature. There are analyses of the CMIP5 ensemble, new model runs, analyses of complementary observational data, attempts at reconciliation all the way to commentaries on how the topic has been covered in the media and on twitter. We will attempt to bring the highlights together here. As background, it is worth reading our previous discussions, along with pieces by Simon Donner and Tamino to help put in context what is being discussed here.
Climate modelling
Going with the wind
A new paper in Nature Climate Change out this week by England and others joins a number of other recent papers seeking to understand the climate dynamics that have led to the so-called “slowdown” in global warming. As we and others have pointed out previously (e.g. here), the fact that global average temperatures can deviate for a decade or longer from the long term trend comes as no surprise. Moreover, it’s not even clear that the deviation has been as large as is commonly assumed (as discussed e.g. in the Cowtan and Way study earlier this year), and has little statistical significance in any case. Nevertheless, it’s still interesting, and there is much to be learned about the climate system from studying the details.
Several studies have shown that much of the excess heating of the planet due to the radiative imbalance from ever-increasing greenhouses gases has gone into the ocean, rather than the atmosphere (see e.g. Foster and Rahmstorf and Balmaseda et al.). In their new paper, England et al. show that this increased ocean heat uptake — which has occurred mostly in the tropical Pacific — is associated with an anomalous strengthening of the trade winds. Stronger trade winds push warm surface water towards the west, and bring cold deeper waters to the surface to replace them. This raises the thermocline (boundary between warm surface water and cold deep water), and increases the amount of heat stored in the upper few hundred meters of the ocean. Indeed, this is what happens every time there is a major La Niña event, which is why it is globally cooler during La Niña years. One could think of the last ~15 years or so as a long term “La-Niña-like” anomaly (punctuated, of course, by actual El Niño (like the exceptionally warm years 1998, 2005) and La Niña events (like the relatively cool 2011).
A very consistent understanding is thus emerging of the coupled ocean and atmosphere dynamics that have caused the recent decadal-scale departure from the longer-term global warming trend. That understanding suggests that the “slowdown” in warming is unlikely to continue, as England explains in his guest post, below. –Eric Steig
Guest commentary by Matthew England (UNSW)
For a long time now climatologists have been tracking the global average air temperature as a measure of planetary climate variability and trends, even though this metric reflects just a tiny fraction of Earth’s net energy or heat content. But it’s used widely because it’s the metric that enjoys the densest array of in situ observations. The problem of course is that this quantity has so many bumps and kinks, pauses and accelerations that predicting its year-to-year path is a big challenge. Over the last century, no single forcing agent is clearer than anthropogenic greenhouse gases, yet zooming into years or decades, modes of variability become the signal, not the noise. Yet despite these basics of climate physics, any slowdown in the overall temperature trend sees lobby groups falsely claim that global warming is over. Never mind that the globe – our planet – spans the oceans, atmosphere, land and ice systems in their entirety.
This was one of the motivations for our study out this week in Nature Climate Change (England et al., 2014) With the global-average surface air temperature (SAT) more-or-less steady since 2001, scientists have been seeking to explain the climate mechanics of the slowdown in warming seen in the observations during 2001-2013. One simple way to address this is to examine what is different about the recent decade compared to the preceding decade when the global-mean SAT metric accelerated. This can be quantified via decade-mean differences, or via multi-decadal trends, which are roughly equivalent if the trends are more-or-less linear, or if the focus is on the low frequency changes.
[Read more…] about Going with the wind
References
- G. Foster, and S. Rahmstorf, "Global temperature evolution 1979–2010", Environmental Research Letters, vol. 6, pp. 044022, 2011. http://dx.doi.org/10.1088/1748-9326/6/4/044022
- M.A. Balmaseda, K.E. Trenberth, and E. Källén, "Distinctive climate signals in reanalysis of global ocean heat content", Geophysical Research Letters, vol. 40, pp. 1754-1759, 2013. http://dx.doi.org/10.1002/grl.50382
- M.H. England, S. McGregor, P. Spence, G.A. Meehl, A. Timmermann, W. Cai, A.S. Gupta, M.J. McPhaden, A. Purich, and A. Santoso, "Recent intensification of wind-driven circulation in the Pacific and the ongoing warming hiatus", Nature Climate Change, vol. 4, pp. 222-227, 2014. http://dx.doi.org/10.1038/nclimate2106
New climate science MOOCs
Along with David’s online class a number of new climate science Massive Online Open Courses (MOOCs) are now coming online.
A Bit More Sensitive…
by Michael E. Mann and Gavin Schmidt
This time last year we gave an overview of what different methods of assessing climate sensitivity were giving in the most recent analyses. We discussed the three general methods that can be used:
The first is to focus on a time in the past when the climate was different and in quasi-equilibrium, and estimate the relationship between the relevant forcings and temperature response (paleo-constraints). The second is to find a metric in the present day climate that we think is coupled to the sensitivity and for which we have some empirical data (climatological constraints). Finally, there are constraints based on changes in forcing and response over the recent past (transient constraints).
All three constraints need to be reconciled to get a robust idea what the sensitivity really is.
A new paper using the second ‘climatological’ approach by Steve Sherwood and colleagues was just published in Nature and like Fasullo and Trenberth (2012) (discussed here) suggests that models with an equilibrium climate sensitivity (ECS) of less than 3ºC do much worse at fitting the observations than other models.
[Read more…] about A Bit More Sensitive…
References
- S.C. Sherwood, S. Bony, and J. Dufresne, "Spread in model climate sensitivity traced to atmospheric convective mixing", Nature, vol. 505, pp. 37-42, 2014. http://dx.doi.org/10.1038/nature12829
- J.T. Fasullo, and K.E. Trenberth, "A Less Cloudy Future: The Role of Subtropical Subsidence in Climate Sensitivity", Science, vol. 338, pp. 792-794, 2012. http://dx.doi.org/10.1126/science.1227465
The global temperature jigsaw
Since 1998 the global temperature has risen more slowly than before. Given the many explanations for colder temperatures discussed in the media and scientific literature (La Niña, heat uptake of the oceans, arctic data gap, etc.) one could jokingly ask why no new ice age is here yet. This fails to recognize, however, that the various ingredients are small and not simply additive. Here is a small overview and attempt to explain how the different pieces of the puzzle fit together.
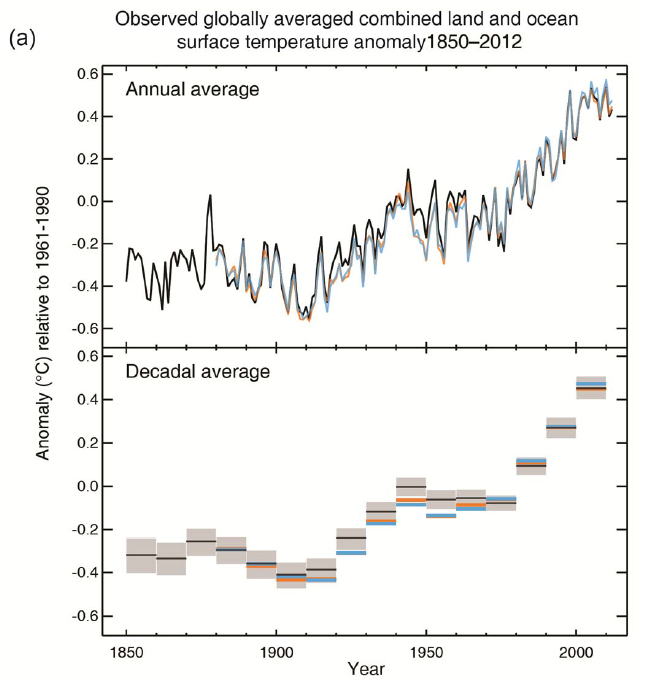
Figure 1 The global near-surface temperatures (annual values at the top, decadal means at the bottom) in the three standard data sets HadCRUT4 (black), NOAA (orange) and NASA GISS (light blue). Graph: IPCC 2013. [Read more…] about The global temperature jigsaw
Simple physics and climate
No doubt, our climate system is complex and messy. Still, we can sometimes make some inferences about it based on well-known physical principles. Indeed, the beauty of physics is that a complex systems can be reduced into simple terms that can be quantified, and the essential aspects understood.
A recent paper by Sloan and Wolfendale (2013) provides an example where they derive a simple conceptual model of how the greenhouse effect works from first principles. They show the story behind the expression saying that a doubling in CO2 should increase the forcing by a factor of 1+log|2|/log|CO2|. I have a fondness for such simple conceptual models (e.g. I’ve made my own attempt posted at arXiv) because they provide a general picture of the essence – of course their precision is limited by their simplicity.
[Read more…] about Simple physics and climate
References
- T. Sloan, and A.W. Wolfendale, "Cosmic rays, solar activity and the climate", Environmental Research Letters, vol. 8, pp. 045022, 2013. http://dx.doi.org/10.1088/1748-9326/8/4/045022
From global climate change to local consequences
Some will be luckier than others when it comes to climate change. The effects of a climate change on me will depend on where I live. In some regions, changes may not be as noticeable as in others. So what are the impacts in my region?
![]()
[Read more…] about From global climate change to local consequences
The IPCC AR5 attribution statement
Last year I discussed the basis of the AR4 attribution statement:
Most of the observed increase in global average temperatures since the mid-20th century is very likely due to the observed increase in anthropogenic greenhouse gas concentrations.
In the new AR5 SPM (pdf), there is an analogous statement:
It is extremely likely that more than half of the observed increase in global average surface temperature from 1951 to 2010 was caused by the anthropogenic increase in greenhouse gas concentrations and other anthropogenic forcings together. The best estimate of the human-induced contribution to warming is similar to the observed warming over this period.
This includes differences in the likelihood statement, drivers and a new statement on the most likely amount of anthropogenic warming.
The new IPCC climate report
 ) (
) ( )
) The time has come: the new IPCC report is here! After several years of work by over 800 scientists from around the world, and after days of extensive discussion at the IPCC plenary meeting in Stockholm, the Summary for Policymakers was formally adopted at 5 o’clock this morning. Congratulations to all the colleagues who were there and worked night shifts. The full text of the report will be available online beginning of next week. Realclimate summarizes the key findings and shows the most interesting graphs.
Update 29 Sept: Full (un-copyedited) report available here.
Global warming
It is now considered even more certain (> 95%) that human influence has been the dominant cause of the observed warming since the mid-20th century. Natural internal variability and natural external forcings (eg the sun) have contributed virtually nothing to the warming since 1950 – the share of these factors was narrowed down by IPCC to ± 0.1 degrees. The measured temperature evolution is shown in the following graph.

Figure 1 The measured global temperature curve from several data sets. Top: annual values. Bottom: averaged values over a decade.
[Read more…] about The new IPCC climate report
What ocean heating reveals about global warming
The heat content of the oceans is growing and growing. That means that the greenhouse effect has not taken a pause and the cold sun is not noticeably slowing global warming.
NOAA posts regularly updated measurements of the amount of heat stored in the bulk of the oceans. For the upper 2000 m (deeper than that not much happens) it looks like this:
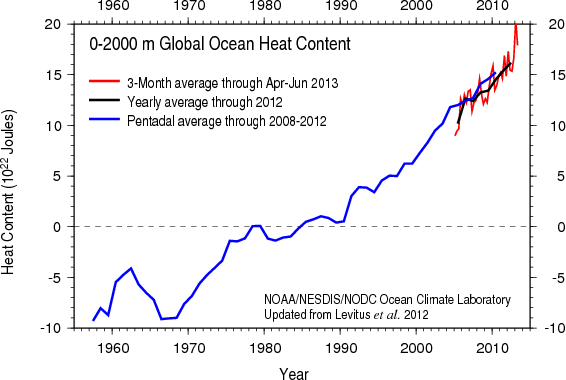
Change in the heat content in the upper 2000 m of the world’s oceans. Source: NOAA
[Read more…] about What ocean heating reveals about global warming