The mystery of why the last million or so years of glacial variability are so different to what came before just got more mysterious…
[Read more…] about The Puzzling PleistoceneCarbon cycle
Climate Scientists response to DOE report
As we’ve mentioned, Andrew Dessler and Robert Kopp have been coordinating a scientific peer review of the DOW ‘CWG’ Critique of Climate Science. It is now out.
[Read more…] about Climate Scientists response to DOE reportAre direct water vapor emissions endangering anyone?
In the EPA EF reconsideration document there is a section on p62 where they attempt to make the argument that the CO2 endangerment finding would also apply to direct water vapor emissions to the atmosphere, which is (according to them) obviously absurd. But both claims are bogus.
[Read more…] about Are direct water vapor emissions endangering anyone?Oh My, Oh Miocene!
A recent paper suggested that ‘climate sensitivity’ derived from a new paleo-CO2 record is around 7.2ºC (for equilibrium climate sensitivity ECS) and ~13.9ºC (Earth System Sensitivity – ESS) for a doubling of CO2. Some press has suggested that this means that “Earth’s Temperature Could Increase by 25 Degrees” (F). Huge if true! Fortunately these numbers should not be taken at face value, but we need to dig into the subtleties to see why.
[Read more…] about Oh My, Oh Miocene!Net Zero/Not Zero
At the COP26 gathering last week much of the discussion related to “Net-Zero” goals. This concept derives from important physical science results highlighted in the Special Report on 1.5ºC and more thoroughly in the last IPCC report that future warming is tied to future emissions, and that warming will effectively cease only once anthropogenic CO2 emissions are balanced by anthropogenic CO2 removals. But some activists have (rightly) pointed out that large-scale CO2 removals are as yet untested, and so reliance on them to any significant extent to balance out emissions is akin not really committing to net zero at all. Their point is that “net-zero” is not zero and hence will serve as a smokescreen for insufficient climate action. To help sort this out some background might be helpful.
[Read more…] about Net Zero/Not ZeroA deep dive into the IPCC’s updated carbon budget numbers
Guest post by Joeri Rogelj (Twitter: @joerirogelj)
Since temperature targets became international climate goals, we have been trying to understand and quantify the implications for our global emissions. Carbon budgets play an important role in this translation.
Carbon budgets tell us how much CO2 we can emit while keeping warming below specific limits. We can estimate the total carbon budget consistent with staying below a given temperature limit. If we subtract the CO2 emissions that we emitted over the past two centuries, we get an estimate of the remaining carbon budget.
I have been involved in the estimation of carbon budgets since the IPCC Fifth Assessment Report in the early 2010s. And since the first IPCC estimates published in 2013, we have learned a lot and have gotten much better at estimating remaining carbon budgets. In the 2018 IPCC Special Report on Global Warming of 1.5°C (SR1.5), the latest insights were integrated in a simple framework that allowed to estimate, track, and understand updates to these carbon budgets.
The most recent Working Group 1 Report of the IPCC Sixth Assessment Cycle (WG1 AR6) provides an updated assessment of the remaining carbon budget. Here’s an insider’s view providing a deep dive into how they differ from previous reports.
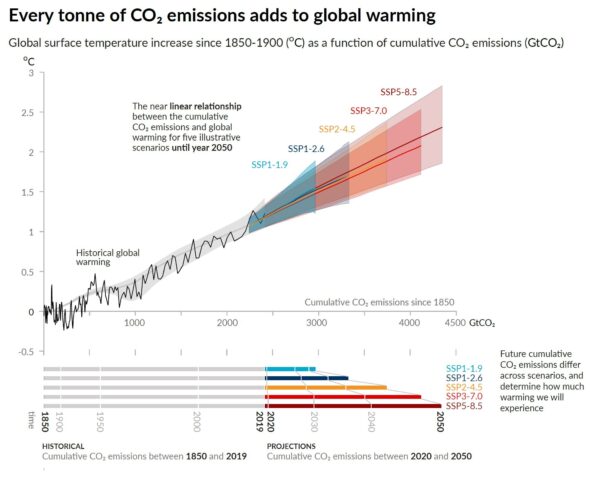
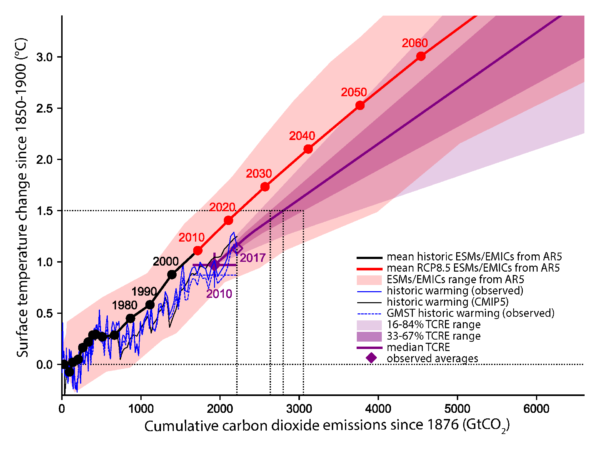
The scientific basis underlying a carbon budget is our robust scientific understanding that global warming is near-linearly proportional to the total amount of CO2 we ever emit as a society. This is illustrated in Fig. SPM10 of the WG1 AR6 report, both for the past and for future projections.
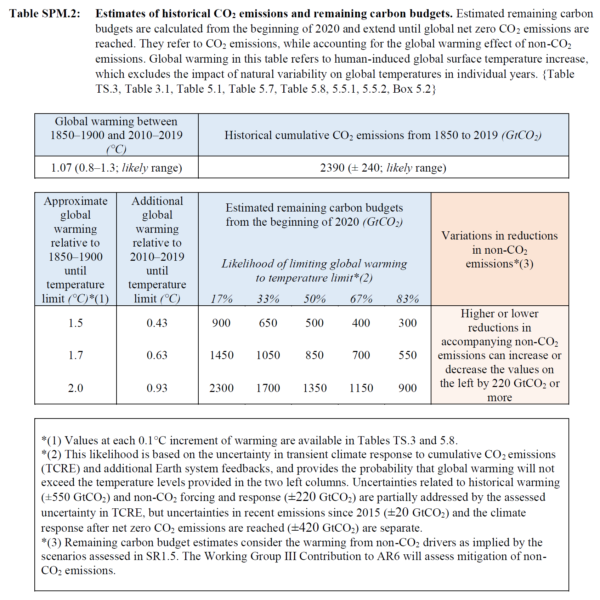
The estimates of remaining carbon budgets also made it into the Summary for Policymakers – the most prominent place that can be given for any finding of the report. Table SPM.2 gives an overview of the latest estimates, for different temperature limits and different probability levels.
How have these estimates changed since previous reports?
IPCC reported carbon budgets for the first time in 2013. And since, important advances have been made in how we estimate these. Five puzzle pieces combine to give carbon budget estimates, and allow us now to understand subsequent updates.
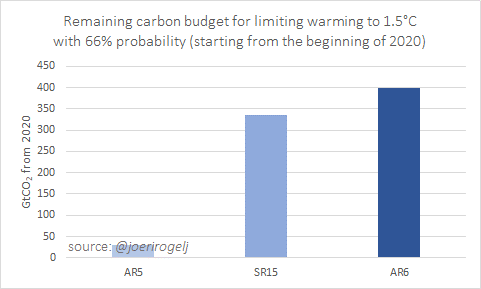
Starting with the key message of the AR6 carbon budget update: carbon budget estimates in AR6 are very similar to those published in the SR1.5 in 2018, but they represent a significant update since AR5 in 2013.
When adjusting for the emissions since AR5 and SR1.5, AR6 remaining carbon budget for limiting warming to 1.5C with 50% chance is about 300 GtCO2 larger than in AR5, but virtually the same as in SR1.5.
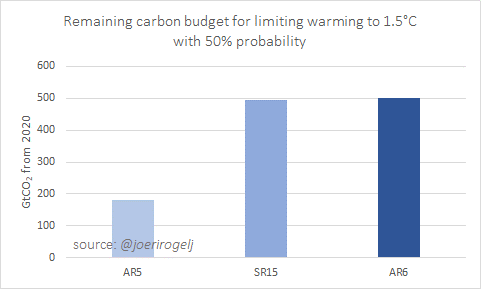
For 66% probability, the AR6 budget is about 60 GtCO2 larger than in SR1.5.
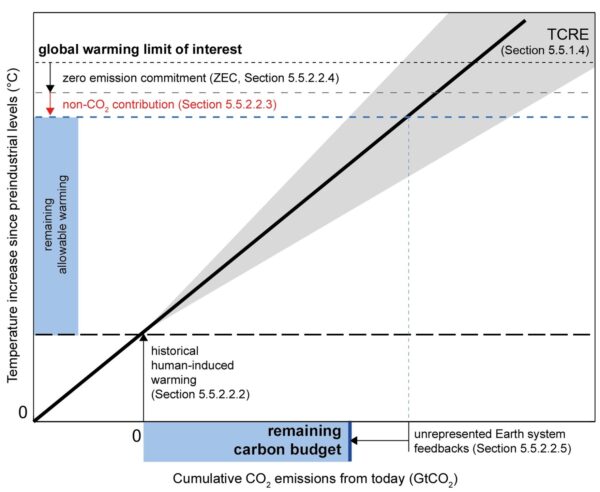
The budget is so much larger than in AR5, because since 2013 more accurate methods have been published that ensure that model uncertainties over the historical period are not accumulated into the future. This is best illustrated by this technical figure from SR1.5.
Between SR1.5 and AR6 every piece of the carbon budget was reassessed:
- warming to date
- how much warming we expect to get per tonne of CO2
- how much warming would still occur once we reach net zero CO2
- how much non-CO2 warming we can expect
- Earth system feedback otherwise not covered
Let’s dive into each piece of this puzzle to understand what has changed between SR1.5 and AR6.
Warming to date – SR1.5 used a 0.97°C warming estimate between 1850-1900 and 2006-2015. This estimate already included corrections for the incomplete global coverage of observations and the different ways in which global surface temperature can be estimated. The AR6, based on a full reassessment of all available data, assesses 0.94°C of global surface temperature increase for the same period.
In isolation, this update results in central estimates being about 65 GtCO2 larger in AR6 than in SR15. For the 33% and 67% estimates that’s about 110 and 50 GtCO2 higher, respectively.
Warming per tonne of CO2 – The next piece of the puzzle is the warming we project per tonne of CO2. SR1.5 used an estimate of 0.8-2.5°C per 1000 GtC (=3664 GtCO2). AR6 assessed this quantity, also known as the Transient Climate Response to Cumulative Emissions of CO2 (or TCRE), to fall in the 1.0-2.3°C range.
Having the same central estimate, the update in TCRE causes no shift in 50% estimates, but the higher and lower percentiles are narrowed. For a 67% chance, AR6 estimates are about 50 and 100 GtCO2 larger compared to SR1.5 for 1.5°C and 2°C of global warming, respectively.
Warming after net zero CO2 – The third piece of the puzzle is the how much warming is expected to still occur once global CO2 emissions reach (and remain at) net zero. This is known as the Zero Emissions Commitment to emissions of CO2 (or ZEC).
The AR6 estimate confirms the SR1.5 estimate of no further CO2-induced warming or cooling once global CO2 emissions reach and stay at next zero. The uncertainty surrounding this value are reported separately. ZEC therefore causes no changes between SR1.5 and AR6.
Non-CO2 warming contribution – The fourth puzzle piece is the projected warming from non-CO2 emissions. As SR1.5, AR6 uses deep mitigation pathways assessed by SR1.5 (Rogelj et al, 2018; Huppmann et al, 2018), but with climate projections updated entirely with dedicated climate emulators that integrate the scientific information across chapter.
By coincidence (and it is really coincidence), the updates in radiative forcing from tens of different gases, climate sensitivity, and carbon-cycle uncertainties result in no net shift in the estimate of non-CO2 warming for the remaining carbon budget.
Pure luck, given the many updated pieces of scientific knowledge that were integrated in AR6, but convenient for explaining differences in carbon budget estimates.
Updated non-CO2 warming estimates lead to no change in remaining carbon budget estimates compares to SR1.5.
Other Earth system feedbacks – The last piece is to account for Earth system feedbacks that would otherwise not be covered. SR1.5 assumed an additional blanket reduction of 100 GtCO2 for this century for these feedbacks. This was a crude estimate and therefore not included as a central part of the remaining carbon budget numbers in SR1.5 AR6 updates this assessment entirely and includes this contribution in its main estimates.
Taking into account not only permafrost thaw, but also a host of other biogeochemical and atmospheric feedbacks, the AR6 estimates to appropriately include the effect of all these feedbacks, remaining carbon budgets have to be reduced by 26 ± 97 GtCO2 per degree Celsius of additional warming.
Altogether these updates mean AR6 remaining carbon budget estimates are very similar compared to SR1.5, while they additionally include the effect of Earth system feedbacks that would otherwise not be covered.
Selecting a remaining carbon budget requires two normative choices as a minimum: the global warming level that is to be avoided, and the likelihood or chance with which this is achieved. Further choices involve how deeply non-CO2 emissions can be reduced.
In addition to updates to science underlying carbon budget estimates, the AR6 also provides a larger set of likelihood levels for its remaining carbon budget estimates (see Table SPM.2 above). As in previous reports, AR6 provides remaining carbon budget estimates for a 33%, 50%, and 67% chance of keeping warming to a given temperature limit. In addition, however, the AR6 also provides the bracketing percentiles for the central 66% range (the range covered between 17% and 83%), so that the uncertainty of the central estimate can be adequately understood.
These values can be used in a variety of ways. For example, the central estimate for the remaining carbon budget for keeping warming to 1.5°C is now 500 GtCO2 starting from the beginning of 2020, with a 66% uncertainty range of 300–900 GtCO2.
Designing a policy for limiting warming to 1.5°C with this global 500 GtCO2 number in mind means that in 1-out-of-2 cases warming will end up below and in 1-out-of-2 cases it will end up above 1.5°C. Alternatively, it can also be understood to mean that in 1-out-of-2 cases policy measures will have to be sharpened beyond the policies consistent with a 500 GtCO2 budget over the coming decades if warming is effectively to be kept to 1.5°C. Similar examples can be given for 1.7°C or other levels (see Table 5.8 in the underlying chapter; Canadell et al (2021)).
A last item affecting the selection of remaining carbon budgets is the expectation of how deeply non-CO2 emissions can be reduced. All remaining carbon budget estimates in AR6 assume that non-CO2 emissions such as methane are reduced consistent with a deep decarbonisation pathway that reaches net zero CO2 emissions. Depending on how effectively these non-CO2 emissions can be reduced, the remaining carbon budgets can vary by 220 GtCO2 or more.
Bottom line of this technical explanation remains, however, that these budgets are small, our current annual global CO2 emissions of about 40 GtCO2/yr are reducing them rapidly, and all budgets require CO2 to decline to net zero while global emissions have not yet shown to decline.
It’s nice to have remaining carbon budgets, but now we need to get on with it and make sure that global CO2 emissions start to decline.
If you would like to know all the ins and outs of AR6 remaining carbon budgets have a look at Section 5.5 in Canadell et al (2021). The entire section describes the assessment of TCRE and remaining carbon budgets, while Box 5.2 presents a more technical comparison with carbon budget estimates from previous reports.
Joeri Rogelj is Director of Research, Grantham Institute Climate Change & Environment, Imperial College London, UK, and Senior Research Scholar, International Institute for Applied Systems Analysis (IIASA), Laxenburg, Austria
Parts of this post have been published earlier as a twitter thread.
References
Huppmann, D., Rogelj, J., Kriegler, E., Krey, V., et al. (2018) A new scenario resource for integrated 1.5 °C research. Nature Climate Change. [Online] 8 (12), 1027–1030. Available from: doi:10.1038/s41558-018-0317-4.
Josep G. Canadell, J. G., P. M.S. Monteiro, M. H. Costa, L. Cotrim da Cunha, P. M. Cox, A. V. Eliseev, S. Henson, M. Ishii, S. Jaccard, C. Koven, A. Lohila, P. K. Patra, S. Piao, J. Rogelj, S. Syampungani, S. Zaehle, K. Zickfeld, 2021, Global Carbon and other Biogeochemical Cycles and Feedbacks. In: Climate Change 2021: The Physical Science Basis. Contribution of Working Group I to the Sixth Assessment Report of the Intergovernmental Panel on Climate Change [Masson-Delmotte, V., P. Zhai, A. Pirani, S. L. Connors, C. Péan, S. Berger, N. Caud, Y. Chen, L. Goldfarb, M. I. Gomis, M. Huang, K. Leitzell, E. Lonnoy, J. B. R. Matthews, T. K. Maycock, T. Waterfield, O. Yelekçi, R. Yu and B. Zhou (eds.)]. Cambridge University Press. In Press.
IPCC (2014) Climate Change 2014: Synthesis Report. Contribution of Working Groups I, II and III to the Fifth Assessment Report of the Intergovernmental Panel on Climate Change.
IPCC, 2021: Summary for Policymakers. In: Climate Change 2021: The Physical Science Basis. Contribution of Working Group I to the Sixth Assessment Report of the Intergovernmental Panel on Climate Change [MassonDelmotte, V., P. Zhai, A. Pirani, S. L. Connors, C. Péan, S. Berger, N. Caud, Y. Chen, L. Goldfarb, M. I. Gomis, M. Huang, K. Leitzell, E. Lonnoy, J. B. R. Matthews, T. K. Maycock, T. Waterfield, O. Yelekçi, R. Yu and B. Zhou (eds.)]. Cambridge University Press. In Press
Rogelj, J., Shindell, D., Jiang, K., Fifita, S., et al. (2018) Mitigation pathways compatible with 1.5°C in the context of sustainable development. In: Greg Flato, Jan Fuglestvedt, Rachid Mrabet, & Roberto Schaeffer (eds.). Global Warming of 1.5 °C: an IPCC special report on the impacts of global warming of 1.5 °C above pre-industrial levels and related global greenhouse gas emission pathways, in the context of strengthening the global response to the threat of climate change, sustainable development, and efforts to eradicate poverty. [Online]. Geneva, Switzerland, IPCC/WMO. pp. 93–174. Available from: http://www.ipcc.ch/report/sr15/.
Surprised by the shallows – again
Guest commentary from Jim Acker (GSFC/Adnet)
Research on the ocean carbonate cycle published in 2019 supports results from the 1980s – in contrast to many papers published since then.
During my graduate school education and research program in the 1980s, conducted at the Department of Marine Science (now the College of Oceanography) of the University of South Florida in St. Petersburg, I participated in research on the production (biogenic calcification) and fate of calcium carbonate (CaCO3) in the open waters of the northern Pacific ocean. There were two primary aspects of this research: one, to measure the sinking flux of biogenic materials in the water column of the Pacific Ocean, and two, to measure the dissolution rates of aragonite, a CaCO3 crystal structure (polymorph) formed by pteropods, under in situ conditions of temperature, pressure, and seawater chemistry.

IPCC Special Report on Land
Thread for discussions of the new special report. [Boosting a comment from alan2102].
Climate Change and Land
An IPCC special report on climate change, desertification, land degradation, sustainable land management, food security, and greenhouse gas fluxes in terrestrial ecosystems
Land degradation accelerates global climate change. Al Jazeera English
Published on Aug 8, 2019 New UN report highlights vicious cycle of climate change, land degradation. CNA
Published on Aug 8, 2019 New IPCC Report Warns of Vicious Cycle Between Soil Degradation and Climate Change. The Real News Network
Published on Aug 8, 2019
First successful model simulation of the past 3 million years of climate change
Guest post by Matteo Willeit, Potsdam Institute for Climate Impact Research
A new study published in Science Advances shows that the main features of natural climate variability over the last 3 million years can be reproduced with an efficient model of the Earth system.
The Quaternary is the most recent geological Period, covering the past ~2.6 million years. It is defined by the presence of glacial-interglacial cycles associated with the cyclic growth and decay of continental ice sheets in the Northern Hemisphere. Climate variations during the Quaternary are best seen in oxygen isotopes measured in deep-sea sediment cores, which represent variations in global ice volume and ocean temperature. These data show clearly that there has been a general trend towards larger ice sheets and cooler temperatures over the last 3 million years, accompanied by an increase in the amplitude of glacial-interglacial variations and a transition from mostly symmetry cycles with a periodicity of 40,000 years to strongly asymmetric 100,000-year cycles at around 1 million years ago. However, the ultimate causes of these transitions in glacial cycle dynamics remain debated.
[Read more…] about First successful model simulation of the past 3 million years of climate changeResplandy et al. correction and response
Guest commentary from Ralph Keeling (UCSD)
I, with the other co-authors of Resplandy et al (2018), want to address two problems that came to our attention since publication of our paper in Nature last week. These problems do not invalidate the methodology or the new insights into ocean biogeochemistry on which it is based, but they do influence the mean rate of warming we infer, and more importantly, the uncertainties of that calculation.
[Read more…] about Resplandy et al. correction and response
References
- L. Resplandy, R.F. Keeling, Y. Eddebbar, M.K. Brooks, R. Wang, L. Bopp, M.C. Long, J.P. Dunne, W. Koeve, and A. Oschlies, "Quantification of ocean heat uptake from changes in atmospheric O2 and CO2 composition", Nature, vol. 563, pp. 105-108, 2018. http://dx.doi.org/10.1038/s41586-018-0651-8