• Skip to primary navigation
  • Skip to main content
  • Skip to primary sidebar
  • Skip to footer

RealClimate

Climate science from climate scientists...

  • Start here
  • Model-Observation Comparisons
  • Miscellaneous Climate Graphics
  • Surface temperature graphics
You are here: Home / Archives for Stefan

Stefan

Sealevelgate

11 Mar 2010 by Stefan

Translations: (Italian) (English)

Imagine this. In its latest report, the IPCC has predicted up to 3 meters of sea level rise by the end of this century. But “climate sceptics” websites were quick to reveal a few problems (or “tricks”, as they called it).

First, although the temperature scenarios of IPCC project a maximum warming of 6.4 ºC (Table SPM3), the upper limit of sea level rise has been computed assuming a warming of 7.6 ºC. Second, the IPCC chose to compute sea level rise up to the year 2105 rather than 2100 – just to add that extra bit of alarmism. Worse, the IPCC report shows that over the past 40 years, sea level has in fact risen 50% less than predicted by its models – yet these same models are used uncorrected to predict the future! And finally, the future projections assume a massive ice sheet decay which is rather at odds with past ice sheet behaviour.

Some scientists within IPCC warned early that all this could lead to a credibility problem, but the IPCC decided to go ahead anyway.

Now, the blogosphere and their great media amplifiers are up in arms. Heads must roll!

[Read more…] about Sealevelgate
Filed Under: Communicating Climate, IPCC, Oceans, Reporting on climate

A warming pause?

6 Oct 2009 by Stefan

Translations: (Español) (English)

The blogosphere (and not only that) has been full of the “global warming is taking a break” meme lately. Although we have discussed this topic repeatedly, it is perhaps worthwhile reiterating two key points about the alleged pause here.

(1) This discussion focuses on just a short time period – starting 1998 or later – covering at most 11 years. Even under conditions of anthropogenic global warming (which would contribute a temperature rise of about 0.2 ºC over this period) a flat period or even cooling trend over such a short time span is nothing special and has happened repeatedly before (see 1987-1996). That simply is due to the fact that short-term natural variability has a similar magnitude (i.e. ~0.2 ºC) and can thus compensate for the anthropogenic effects. Of course, the warming trend keeps going up whilst natural variability just oscillates irregularly up and down, so over longer periods the warming trend wins and natural variability cancels out.

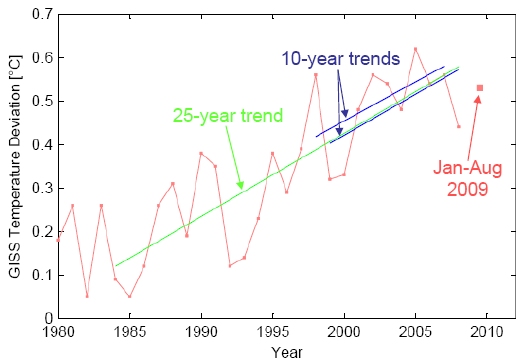
(2) It is highly questionable whether this “pause” is even real. It does show up to some extent (no cooling, but reduced 10-year warming trend) in the Hadley Center data, but it does not show in the GISS data, see Figure 1. There, the past ten 10-year trends (i.e. 1990-1999, 1991-2000 and so on) have all been between 0.17 and 0.34 ºC per decade, close to or above the expected anthropogenic trend, with the most recent one (1999-2008) equal to 0.19 ºC per decade – just as predicted by IPCC as response to anthropogenic forcing.

GISS temperature trends

Figure 1. Global temperature according to NASA GISS data since 1980. The red line shows annual data, the larger red square a preliminary value for 2009, based on January-August. The green line shows the 25-year linear trend (0.19 ºC per decade). The blue lines show the two most recent ten-year trends (0.18 ºC per decade for 1998-2007, 0.19 ºC per decade for 1999-2008) and illustrate that these recent decadal trends are entirely consistent with the long-term trend and IPCC predictions. Even the highly “cherry-picked” 11-year period starting with the warm 1998 and ending with the cold 2008 still shows a warming trend of 0.11 ºC per decade (which may surprise some lay people who tend to connect the end points, rather than include all ten data points into a proper trend calculation).

[Read more…] about A warming pause?

Filed Under: Climate Science, Communicating Climate, Instrumental Record, skeptics

Ups and downs of sea level projections

31 Aug 2009 by Stefan

By Stefan Rahmstorf and Martin Vermeer

The scientific sea level discussion has moved a long way since the last IPCC report was published in 2007 (see our post back then). The Copenhagen Synthesis Report recently concluded that “The updated estimates of the future global mean sea level rise are about double the IPCC projections from 2007″. New Scientist last month ran a nice article on the state of the science, very much in the same vein. But now Mark Siddall, Thomas Stocker and Peter Clark have countered this trend in an article in Nature Geoscience, projecting a global rise of only 7 to 82 cm from 2000 to the end of this century.


Coastal erosion: Like the Dominican Republic, many island nations are particularly vulnerable to sea level rise. (c) S.R.
Coastal erosion: Like the Dominican Republic, many island nations are
particularly vulnerable to sea level rise. (Photo: S.R.)

[Read more…] about Ups and downs of sea level projections

Filed Under: Oceans

A warning from Copenhagen

21 Jun 2009 by Stefan

Translations: (Deutsch) (Español) (English)

A Chinese translation is available here.

Filed Under: Climate Science, Reporting on climate

Sea will rise ‘to levels of last Ice Age’

26 Jan 2009 by Stefan

Translations: (Italian) (English)

A chinese translation of this post is available here

Filed Under: Climate Science

Global Cooling-Wanna Bet?

8 May 2008 by Stefan

Translations: (Español) (Deutsch) (Italian) (English)

By Stefan Rahmstorf, Michael Mann, Ray Bradley, William Connolley, David Archer, and Caspar Ammann

Global cooling appears to be the “flavour of the month”. First, a rather misguided media discussion erupted on whether global warming had stopped, based on the observed temperatures of the past 8 years or so (see our post). Now, an entirely new discussion is capturing the imagination, based on a group of scientists from Germany predicting a pause in global warming last week in the journal Nature (Keenlyside et al. 2008).

Specifically, they make two forecasts for global temperature, as discussed in the last paragraphs of their paper and shown in their Figure 4 (see below). The first forecast concerns the time interval 2000-2010, while the second concerns the interval 2005-2015 (*). For these two 10-year averages, the authors make the following prediction:

“… the initialised prediction indicates a slight cooling relative to 1994-2004 conditions”

Their graph shows this: temperatures in the two forecast intervals (green points shown at 2005 and 2010) are almost the same and are both lower than observed in 1994-2004 (the end of the red line in their graph).

Fig. 4 from <em data-lazy-src=

That this cooling would just be a temporary blip and would change nothing about global warming goes without saying and has been amply discussed elsewhere (e.g. here). But another question has been rarely discussed: will this forecast turn out to be correct?

We think not – and we are prepared to bet serious money on this. We have double-checked with the authors: they say they really mean this as a serious forecast, not just as a methodological experiment. If the authors of the paper really believe that their forecast has a greater than 50% chance of being correct, then they should accept our offer of a bet; it should be easy money for them. If they do not accept our bet, then we must question how much faith they really have in their own forecast.

The bet we propose is very simple and concerns the specific global prediction in their Nature article. If the average temperature 2000-2010 (their first forecast) really turns out to be lower or equal to the average temperature 1994-2004 (*), we will pay them € 2500. If it turns out to be warmer, they pay us € 2500. This bet will be decided by the end of 2010. We offer the same for their second forecast: If 2005-2015 (*) turns out to be colder or equal compared to 1994-2004 (*), we will pay them € 2500 – if it turns out to be warmer, they pay us the same. The basis for the temperature comparison will be the HadCRUT3 global mean surface temperature data set used by the authors in their paper.

To be fair, the bet needs an escape clause in case a big volcano erupts or a big meteorite hits the Earth and causes cooling below the 1994-2004 level. In this eventuality, the forecast of Keenlyside et al. could not be verified any more, and the bet is off.

The bet would also need a neutral arbiter – we propose, for example, the director of the Hadley Centre, home of the data used by Keenlyside et al., or a committee of neutral colleagues. This neutral arbiter would also decide whether a volcano or meteorite impact event is large enough as to make the bet obsolete.

We will discuss the scientific reasons for our assessment here another time – first we want to hear from Keenlyside et al. whether they accept our bet. Our friendly challenge is out – we hope they will accept it in good sportsmanship.

(*) We adopt here the definition of the 10-year intervals as in their paper, which is from 1 November of the first year to 31 October of the last year. I.e.: 2000-2010 means 1 November 2000 until 31 October 2010.

Update: We have now published part 2 of this bet with our scientific arguments.

_______________________
Update: Andy Revkin has weighed in at “dot earth”.

Update 5/11/08: so has Anna Barnett at Nature’s ‘climate feedback’ blog

Filed Under: Climate modelling, Climate Science

Model-data-comparison, Lesson 2

10 Apr 2008 by Stefan

In January, we presented Lesson 1 in model-data comparison: if you are comparing noisy data to a model trend, make sure you have enough data for them to show a statistically significant trend. This was in response to a graph by Roger Pielke Jr. presented in the New York Times Tierney Lab Blog that compared observations to IPCC projections over an 8-year period. We showed that this period is too short for a meaningful trend comparison.

This week, the story has taken a curious new twist. In a letter published in Nature Geoscience, Pielke presents such a comparison for a longer period, 1990-2007 (see Figure). Lesson 1 learned – 17 years is sufficient. In fact, the very first figure of last year’s IPCC report presents almost the same comparison (see second Figure).
[Read more…] about Model-data-comparison, Lesson 2

Filed Under: Climate Science

Sustainability: A Nobel Cause

9 Oct 2007 by Stefan

I would like to share with you some impressions from a remarkable event taking place today and tomorrow in Potsdam: 15 Nobel laureates are meeting with top climate and energy experts and politicians to discuss global sustainability. You can follow the event with its presentations here, with a couple of hours of delay. [Read more…] about Sustainability: A Nobel Cause

Filed Under: Climate Science

Curve manipulation: lesson 2

14 Jun 2007 by Stefan

Two weeks ago, we published the first lesson in curve manipulation taught by German school teacher and would-be scientist E.G. Beck: How to make it appear as if the Medieval times were warmer than today, even if all scientific studies come to the opposite conclusion. Today we publish curve manipulation, lesson 2: How to make it appear as if 20th Century warming fits into a 1500-year cycle. This gem is again brought to us by E.G. Beck. In a recent article (in German), he published the following graph:

Notice how temperature goes up and down in beautifully regular cycles since 800 B.C.? At the bottom, they are labelled “Dansgaard-Oeschger cycles” – this refers to the Dansgaard-Oeschger events found in Greenland ice cores during the last Ice Age (but not during the last 10,000 years), about which there is a serious scientific discussion whether they are paced by a 1500-year cycle (see my paper in GRL). Beck’s curve shows a warm phase 400 BC and the next one 1200 AD – that’s 1600 years difference, so it just about fits. (I’m not endorsing his curve, by the way, I have no idea where it comes from – I’m just playing along with it for the sake of the argument). So the next warm phase should be in the year – oooops… 2700 or 2800? Hang on, how come it looks like the current warmth fits so nicely into the cycle? Shouldn’t we be right in the coldest phase? Now I see it… two little lines across the x-axis indicate that the axis has been broken there – tick-marks after the break are in 200-year intervals and before the break in 400-year intervals, and there’s also a gap of 200 missing years there. So that’s how we make the current global warming fit past climate cycles – it’s so easy!

p.s. Beck appeared on German TV last Monday, after the “Swindle” film was shown, and he is announced to appear on the program “Report München” in the first channel of public German TV next Monday (18 June), to educate the viewers about another of his fantasy graphs, namely his CO2 curve. It promises to be a must-see for friends of the unintentionally farcical.

Filed Under: Climate Science

G8 summit declaration

8 Jun 2007 by Stefan

We assume that many of our readers will be interested in the declaration of the G8 summit in Heiligendamm (Germany), which was agreed yesterday by the leaders of the G8 countries. We therefore document the key passages on climate change below. As usual we refrain from a political analysis, but as scientists we note that it is rewarding to see that the results of climate science are fully acknowledged by the heads of state.

The declaration states:

CLIMATE CHANGE

48. We take note of and are concerned about the recent UN Intergovernmental Panel on Climate Change (IPCC) reports. The most recent report concluded both, that global temperatures are rising, that this is caused largely by human activities and, in addition,that for increases in global average temperature, there are projected to be major changes in ecosystem structure and function with predominantly negative consequences for biodiversity and ecosystems, e.g. water and food supply.

Fighting Climate Change

49. We are therefore committed to taking strong and early action to tackle climate change in order to stabilize greenhouse gas concentrations at a level that would prevent dangerous anthropogenic interference with the climate system. Taking into account the scientific knowledge as represented in the recent IPCC reports, global greenhouse gas emissions must stop rising, followed by substantial global emission reductions. In setting a global goal for emissions reductions in the process we have agreed today involving all major emitters, we will consider seriously the decisions made by the European Union, Canada and Japan which include at least a halving of global emissions by 2050. We commit to achieving these goals and invite the major emerging economies to join us in this endeavour.

[Read more…] about G8 summit declaration

Filed Under: Climate Science

  • « Go to Previous Page
  • Page 1
  • Interim pages omitted …
  • Page 7
  • Page 8
  • Page 9
  • Page 10
  • Go to Next Page »

Primary Sidebar

Search

Search for:

Email Notification

get new posts sent to you automatically (free)
Loading

Recent Posts

  • High-resolution ‘fingerprint’ images reveal a weakening Atlantic Ocean circulation (AMOC)
  • Unforced variations: Oct 2025
  • “But you said the ice was going to disappear in 10 years!”
  • Time and Tide Gauges wait for no Voortman
  • Lil’ NAS Express
  • DOE CWG Report “Moot”?

Our Books

Book covers
This list of books since 2005 (in reverse chronological order) that we have been involved in, accompanied by the publisher’s official description, and some comments of independent reviewers of the work.
All Books >>

Recent Comments

  • Tomáš Kalisz on Unforced variations: Oct 2025
  • Ray Ladbury on “But you said the ice was going to disappear in 10 years!”
  • Ray Ladbury on “But you said the ice was going to disappear in 10 years!”
  • zebra on Unforced variations: Oct 2025
  • MA Rodger on Unforced variations: Oct 2025
  • DavidD on High-resolution ‘fingerprint’ images reveal a weakening Atlantic Ocean circulation (AMOC)
  • zebra on High-resolution ‘fingerprint’ images reveal a weakening Atlantic Ocean circulation (AMOC)
  • Barton Paul Levenson on Unforced variations: Oct 2025
  • Barton Paul Levenson on “But you said the ice was going to disappear in 10 years!”
  • Ken Towe on High-resolution ‘fingerprint’ images reveal a weakening Atlantic Ocean circulation (AMOC)
  • Killian on Unforced variations: Oct 2025
  • elia on High-resolution ‘fingerprint’ images reveal a weakening Atlantic Ocean circulation (AMOC)
  • Annie Leymarie on High-resolution ‘fingerprint’ images reveal a weakening Atlantic Ocean circulation (AMOC)
  • Barry E Finch on Unforced variations: Oct 2025
  • Karsten V. Johansen on High-resolution ‘fingerprint’ images reveal a weakening Atlantic Ocean circulation (AMOC)
  • Mo Hummus on Unforced variations: Oct 2025
  • Keith Woollard on “But you said the ice was going to disappear in 10 years!”
  • Keith Woollard on “But you said the ice was going to disappear in 10 years!”
  • Mo Yunus on Unforced variations: Oct 2025
  • Jean-Pierre Demol on High-resolution ‘fingerprint’ images reveal a weakening Atlantic Ocean circulation (AMOC)
  • Bart on Unforced variations: Oct 2025
  • Mo Yunus on Unforced variations: Oct 2025
  • John Mashey on High-resolution ‘fingerprint’ images reveal a weakening Atlantic Ocean circulation (AMOC)
  • Keith Woollard on “But you said the ice was going to disappear in 10 years!”
  • Keith Woollard on “But you said the ice was going to disappear in 10 years!”
  • Piotr on Unforced variations: Oct 2025
  • Ken Towe on High-resolution ‘fingerprint’ images reveal a weakening Atlantic Ocean circulation (AMOC)
  • Mo Yunus on High-resolution ‘fingerprint’ images reveal a weakening Atlantic Ocean circulation (AMOC)
  • Mo Yunus on High-resolution ‘fingerprint’ images reveal a weakening Atlantic Ocean circulation (AMOC)
  • Kevin Trenberth on High-resolution ‘fingerprint’ images reveal a weakening Atlantic Ocean circulation (AMOC)

Footer

ABOUT

  • About
  • Translations
  • Privacy Policy
  • Contact Page
  • Login

DATA AND GRAPHICS

  • Data Sources
  • Model-Observation Comparisons
  • Surface temperature graphics
  • Miscellaneous Climate Graphics

INDEX

  • Acronym index
  • Index
  • Archives
  • Contributors

Realclimate Stats

1,384 posts

11 pages

247,576 comments

Copyright © 2025 · RealClimate is a commentary site on climate science by working climate scientists for the interested public and journalists.