As I’ve done for a few years, here is the updated graph for the Nenana Ice Classic competition, which tracks the break up of ice on the Tanana River near Nenana in Alaska. It is now a 101-year time series tracking the winter/spring conditions in that part of Alaska, and shows clearly the long term trend towards earlier break up, and overall warming.
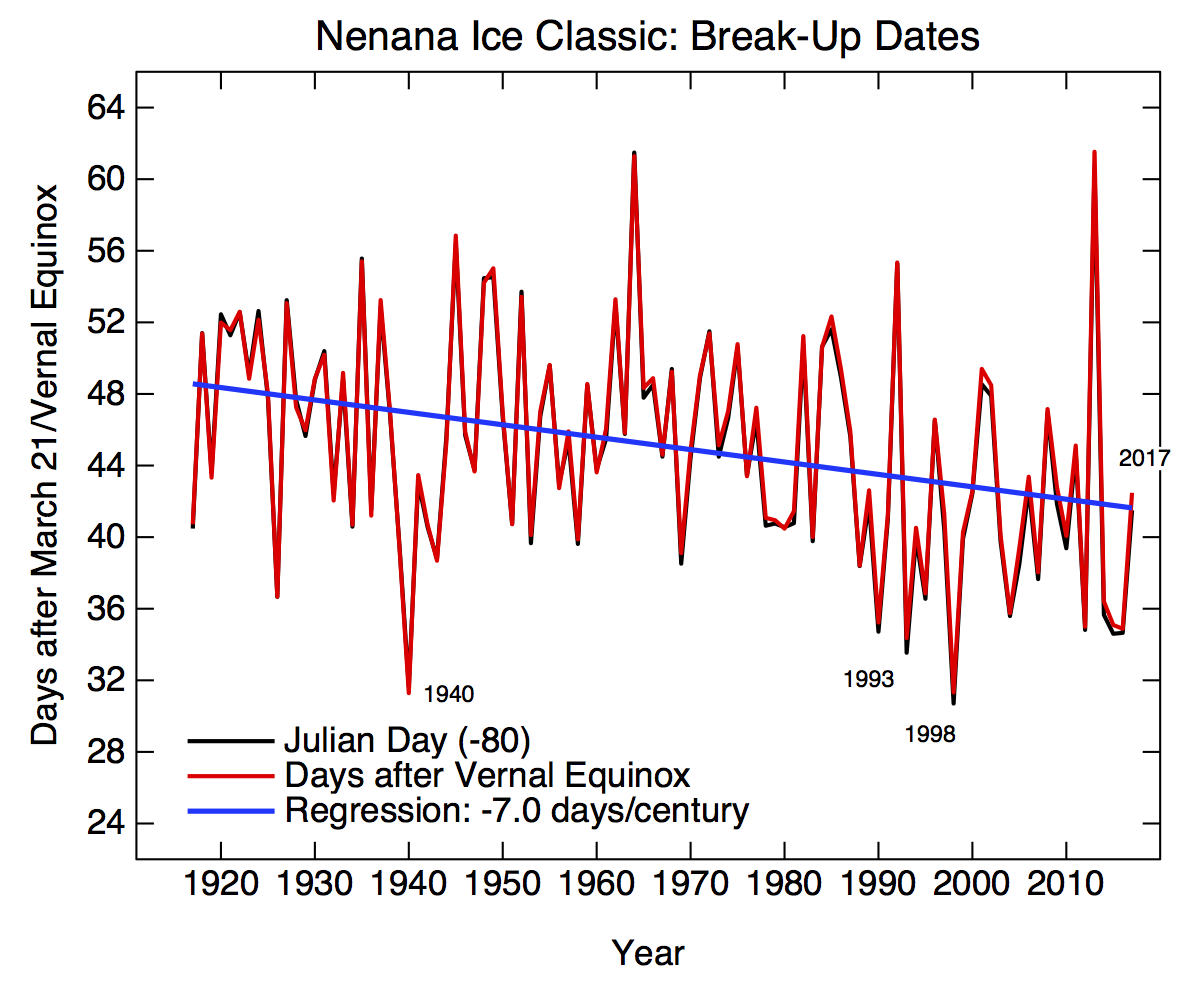
2017 was almost exactly on trend – roughly one week earlier than the average break up date a century ago. There was a short NPR piece on the significance again this week, but most of the commentary from last year and earlier is of course still valid.
My shadow bet on whether any climate contrarian site will mention this dataset remains in play (none have since 2013 which was an record late year).