The Paris Agreement temperature limits are a little ambiguous and knowing where we are is tricky.
The desire to keep global temperature rises since the pre-industrial, ideally below 1.5ºC and definitely below 2.0ºC, is a little bit complicated by the lack of definition in what constitutes the pre-industrial, uncertainties in what the temperature was in the pre-industrial, and an ambiguity in what counts as exceeding these limits.
These are old questions that were tackled in prior IPCC reports (SR15 and AR6), but there are new elements that have come in to the equation since then and, of course, the real world has got closer to exceeding 1.5ºC and so there is additional salience. There is a big collective effort going on to provide some clarity on these broader questions (Update: preprint available here), but I thought it would be interesting to review some of the more technical questions here.
First off, when is the ‘pre-industrial’? It’s not really definable from history without going back to periods when we didn’t have any (or much) instrumental data, and as we’ve discussed, anthropogenic impacts on climate might date back to the dawn of agriculture. So, for practical reasons, people have settled on the 19th Century as ‘close enough’. But even there, we have issues. The early 19th C was abnormally cold because of a series of big volcanoes (incl. Tambora in 1815), so that shouldn’t be included if you want to highlight anthropogenic changes. In any case, the instrumental data sets for temperature are mostly only good for the global mean (with some relevant uncertainties) from 1850 onward (though there are some good efforts to push this back further e.g. Lundstad et al. (2025)). And since you need a few decades to smooth out the internal variability, people have been using various multi-decadal averages around then. While there are still a few holdouts, most folks have followed the IPCC lead and are now using 1850-1900 as the baseline for ‘pre-industrial’ in practice.
There are now at least four data sets that are regularly maintained and that go back to at least 1850: HadCRUT (currently v5.1), NOAA (v6), Berkeley Earth and, a relatively new effort, DCENT. They use different (though overlapping) raw data, different methods, and different interpolations, and thus (unsurprisingly) give different magnitudes of change since 1850-1900. With respect to their own baselines, 2024 was 1.45-1.65ºC above 1850-1900. If they are aligned in the modern period (when the differences between the methods/data are minimal), there is clearly a variation in both inferred interannual variability and mean change in the ‘pre-industrial’ period (see fig. 1). How should this be interpreted? It’s not the full structural uncertainty (since we are not really sampling all of the issues – particularly in the SST products), but it is perhaps a lower bound on that uncertainty. Ensembles that sample the methodological uncertainty are also useful, of course.
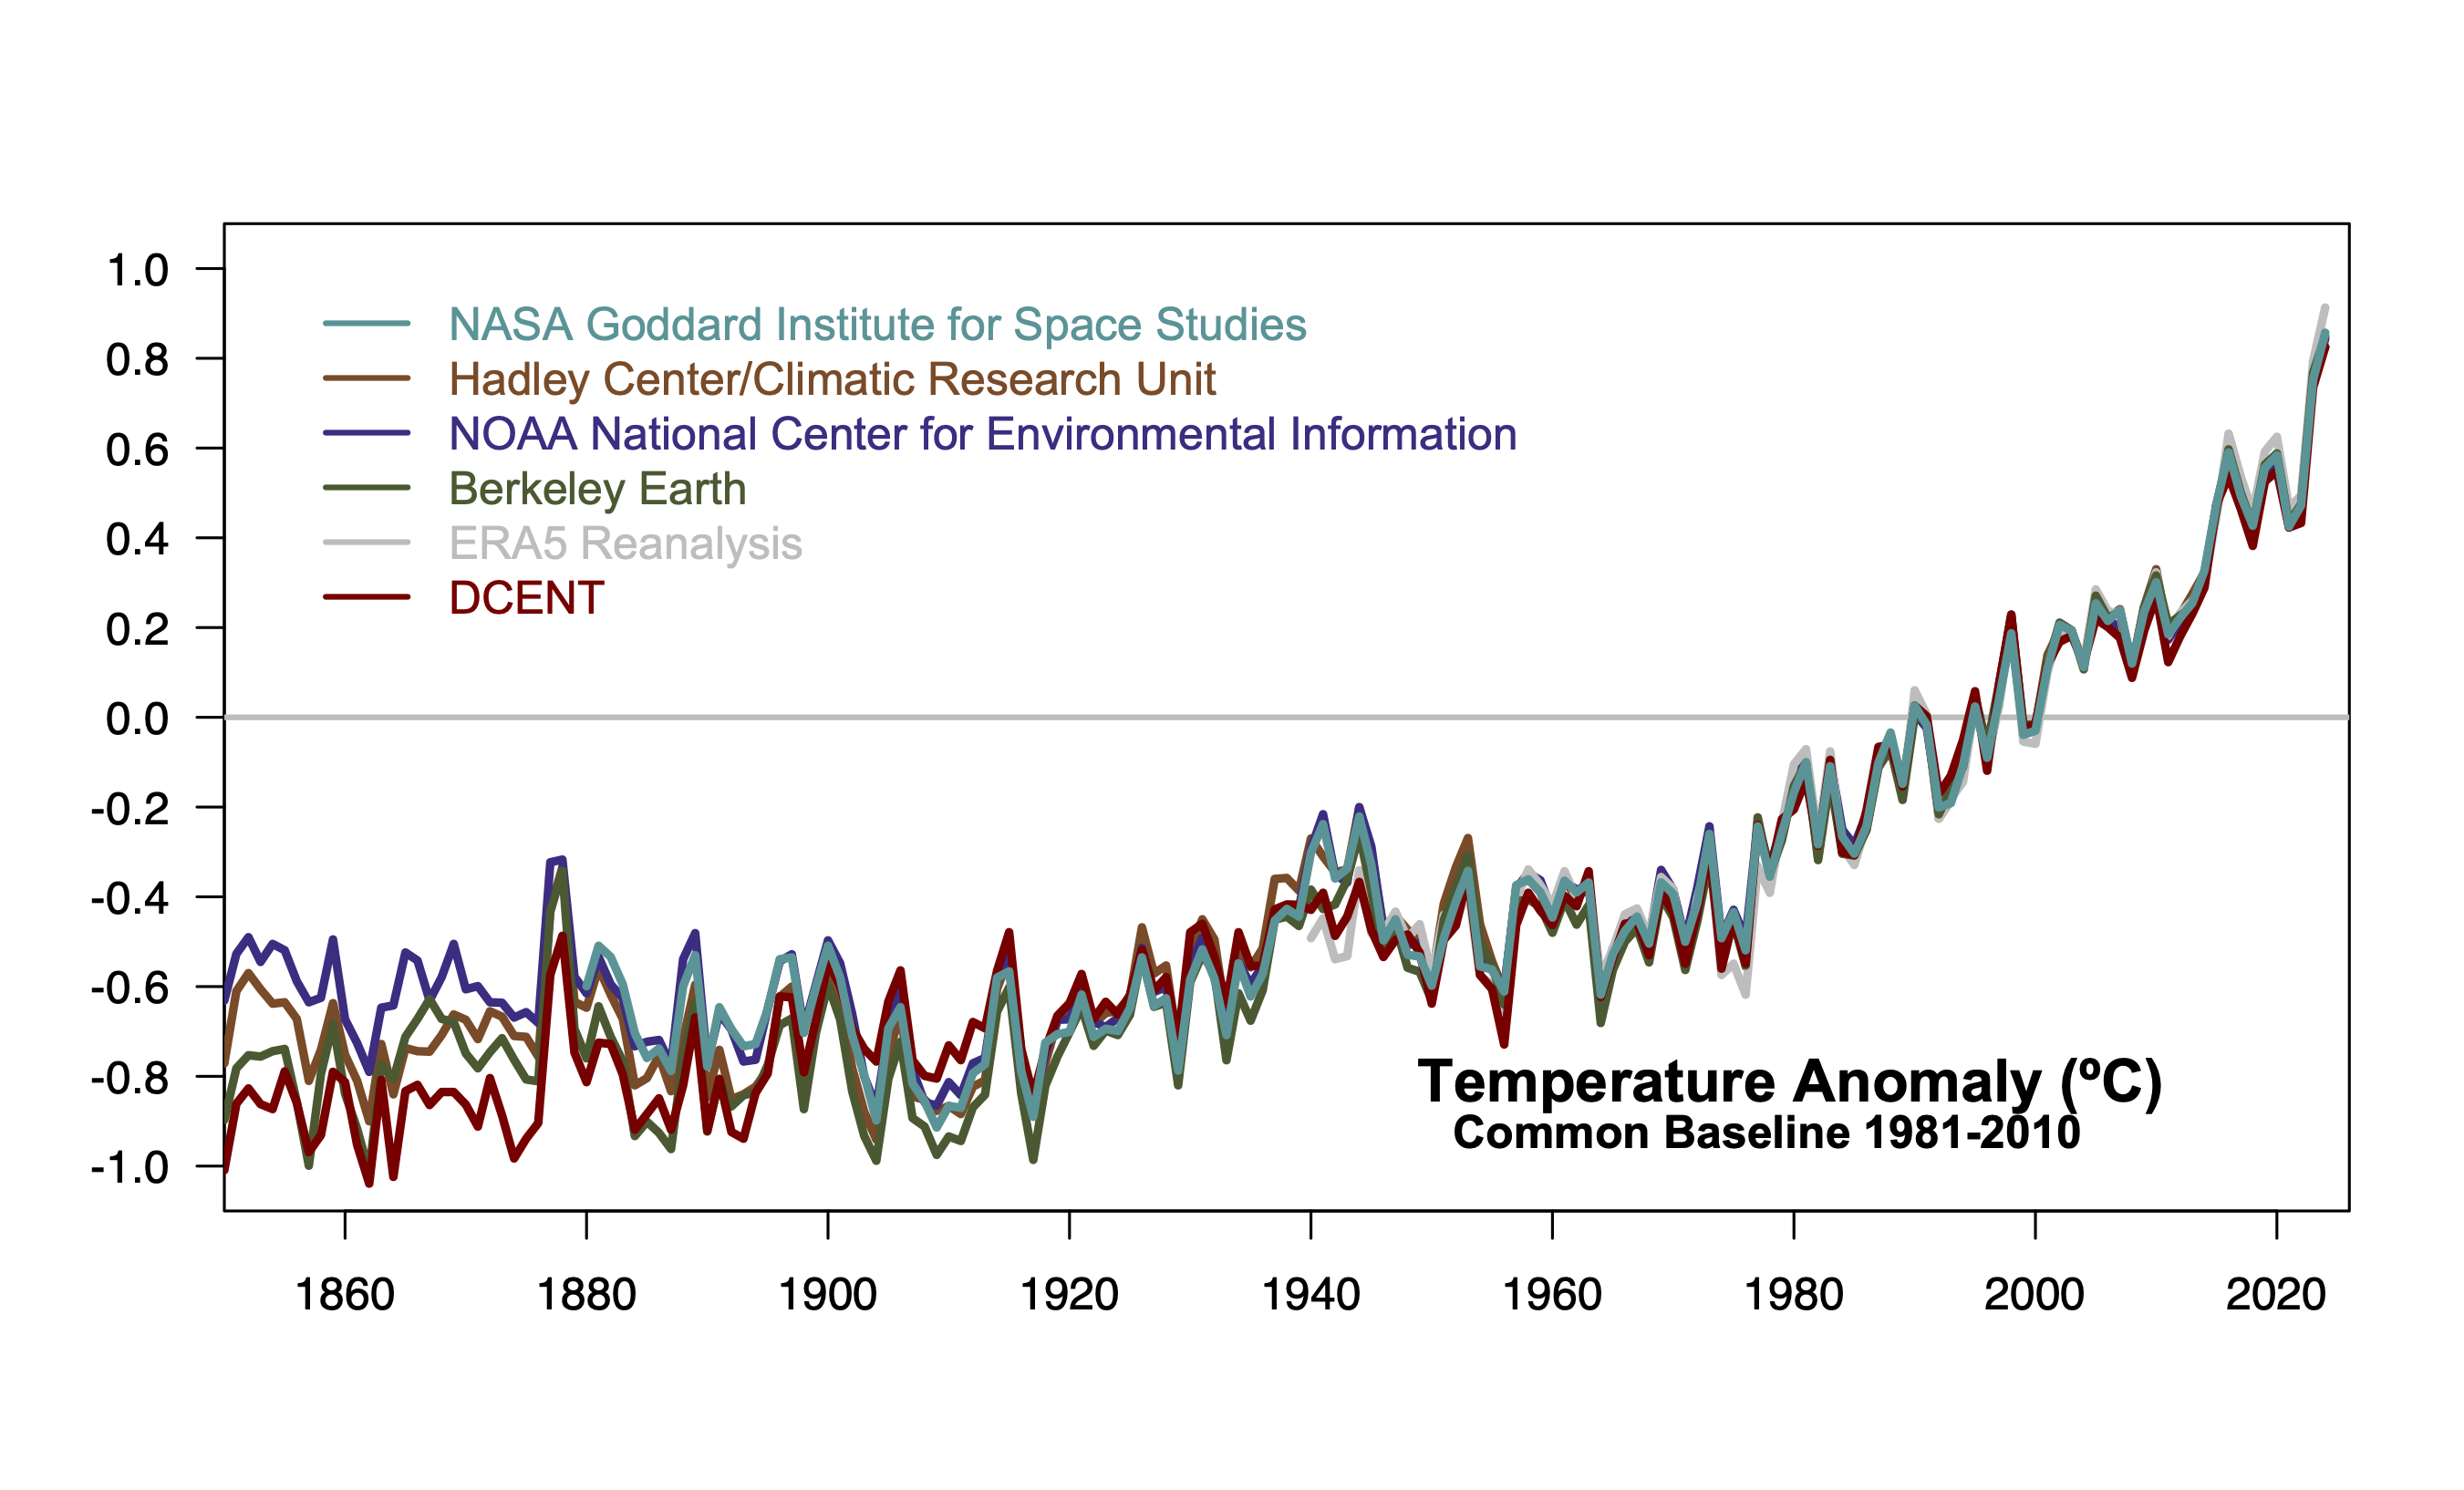
Other datasets such as GISTEMP or JMA, or the more modern reanalyses (ERA5, JRA-3Q etc.) that don’t extend that far back, can still be useful because they add to our understanding of the structural uncertainty in the periods where they overlap. The WMO uses a mix of these records (in 2024 it used an average of HadCRUT, NOAA, Berkeley, GISTEMP, JMA-3Q, and ERA5) when they are available to create a composite record. But how do we get the change since the pre-industrial?
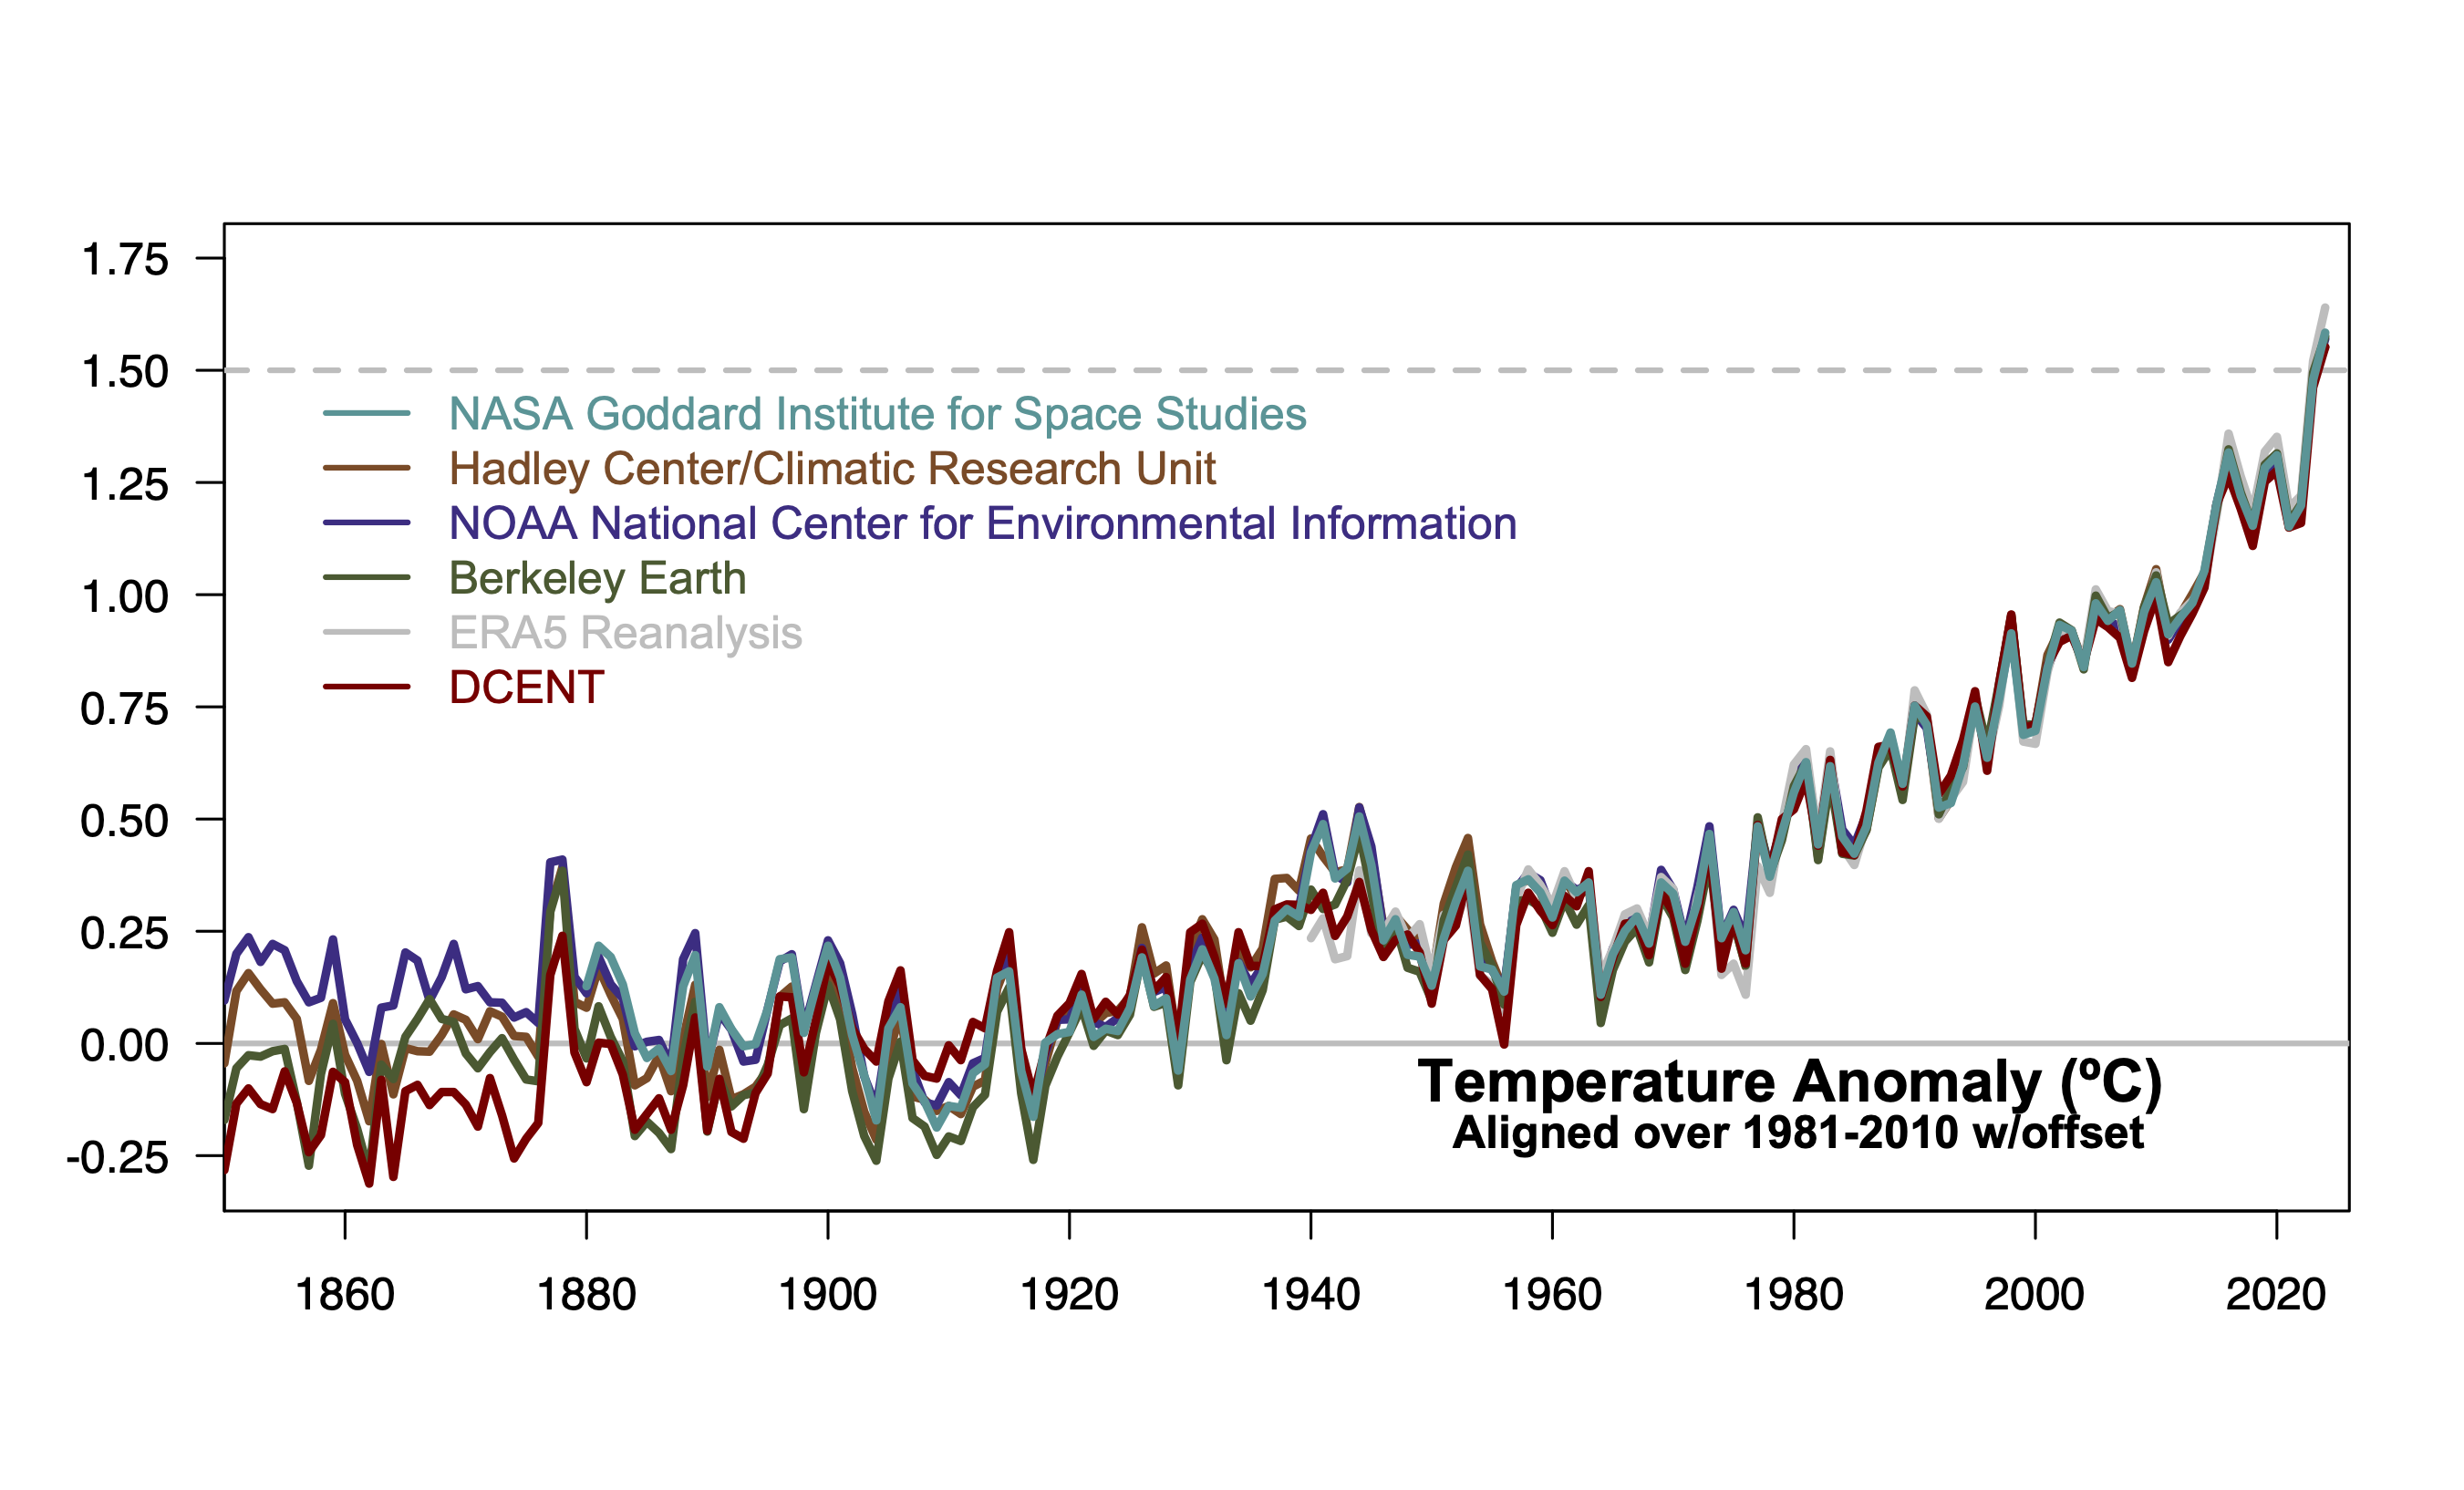
As we discussed earlier this year, one way would be to baseline each long record to their own 1850-1900 data, and then add in the shorter records by tying them to one master record (but which one?) or an average of the longer ones. However, if you plot this out it gives the impression that all the uncertainty is in the modern period. Using a modern period to cross calibrate the different records (as in figure 1) but then imposing a constant offset to translate from the modern to the pre-industrial allows the uncertainty to be clearly associated with the past (not the present) (as in figure 2). But how should the offset be calculated? We could either assume that the average of the four long records should be zero over the pre-industrial period or that the WMO average should be zero (or even something else entirely).
How much does this matter?
First, the baseline issue. With respect to 1850-1900, using an average of the 4 records mentioned above, 1880-1900 is 0.01ºC cooler and 1880-1920 (which Jim Hansen uses) is ~0.02ºC cooler. These are small numbers on average, but the spread across the 4 records is large (±0.08ºC) indicating that this is not very robust and could change in future. Second, the difference between setting the WMO average, or the average of the 4 long records, or the average of the records that were used in AR6 to zero, can make a ~0.04ºC difference.
For individual months, there is a secondary issue – should you adjust the climatological baseline on an annual basis or on a monthly basis? Different months have warmed differently since the 19th Century (Jan/Feb/Mar have warmed by about 0.17ºC more than Jul/Aug/Sep). That is, do you consider the anomaly for Oct to relative to the climatological Oct (which seems sensible) or to the climatological annual mean? (which is slightly easier). For Berkeley Earth, October 2025 was at 1.52º above pre-industrial Octobers, or 1.57ºC above if baselined annually. Winter months are affected oppositely. Depending on the month it is an effect of ±0.08ºC. Note this is only an issue for the monthly anomalies w.r.t. to a different baseline than the native baseline (usually modern) for any particular product.
Finally, given that all of these approaches rely on moving targets (which records are being maintained, raw data being added through data rescue efforts, updates to method versions etc.), one has the choice of either updating these calculations every year (which means you need to explain why things might change from previous years), or sticking to a canonical calculation (such as the one in AR6) for consistency. The best estimate of the annual offset from 1981-2010 to the 1850-1900 period was estimated as 0.69ºC in AR6, but following an analogous recipe now would give 0.73ºC (mainly because DCENT has a colder 19th C than the older products, and updates to HadCRUT and Berkeley Earth have shifted things slightly).
The offset to tie the shorter records to the longer ones also varies over time if you keep the same method. For GISTEMP, I’ve been calibrating to the other records over the 1880-1900 period. Last year, that gave an offset of -0.028ºC to go from 1880-1900 to 1850-1900, but this year (with the addition of DCENT and minor updates to the raw data), it gives an offset of -0.01ºC. Copernicus uses a fixed 0.88ºC offset (from AR6) to go from a 1991-2020 baseline in ERA5 to 1850-1900, but following an analogous recipe and adding in DCENT, you’d end up with 0.92ºC.
Last year was the first in which we “likely” exceeded 1.5ºC in the annual average (the WMO average was 1.55ºC), and the assessed uncertainty in this (arising from all the mentioned issues) is about ±0.13ºC (90% CI). With updates to the records, the WMO average would now be 1.54ºC. But if you added an offset to the 1981-2010 baselined data so that the average of the four long records was zero, 2024 would be at 1.58ºC. Adding an offset so that the WMO average was zero over the baseline takes you back to 1.54ºC.
On a monthly basis we have been exceeding 1.5ºC in the individual records (briefly) since the El Niño event of 2016 (maybe 2017 and 2019, and then again in 2020). Since 2023, we have exceeded it on a monthly basis more often and that has been sustained in 2024 and 2025 (figure 3).

Knowing when we’ve exceeded the limit with respect to a longer term average is trickier again except in hindsight. If we want to know if we’ve gone past the mid-point of the first twenty year period above the threshold, that involves some forecasting for the next ten years – which adds to the uncertainties. We have many forecasts – from CMIP, initialized projections, statistical fits, even machine learning – but there are many uncertainties (in the projected forcings, the structure of the fit, the appropriateness of training data). So this too will be something that is subject to (annual?) revision, and the precise answer might not be available for a while. Whether it matters if it turns out (in a decade or so) to have been 2028 or 2030 or another year is not obvious to me.
Summary
There are some irreducible uncertainties in defining where we are with respect to the pre-industrial at any one moment (day, month, year, decade), and so one shouldn’t expect to know this precisely, and one can expect a bit of ‘jitter’ in the assessments. Right now, while we are hovering around the 1.5ºC level, differences in method can move the value slightly above or below the threshold, but it should be understood that these jitters are not scientifically meaningful. The long term trends are.
References
- E. Lundstad, Y. Brugnara, D. Pappert, J. Kopp, E. Samakinwa, A. Hürzeler, A. Andersson, B. Chimani, R. Cornes, G. Demarée, J. Filipiak, L. Gates, G.L. Ives, J.M. Jones, S. Jourdain, A. Kiss, S.E. Nicholson, R. Przybylak, P. Jones, D. Rousseau, B. Tinz, F.S. Rodrigo, S. Grab, F. Domínguez-Castro, V. Slonosky, J. Cooper, M. Brunet, and S. Brönnimann, "The global historical climate database HCLIM", Scientific Data, vol. 10, 2023. http://dx.doi.org/10.1038/s41597-022-01919-w
This is a non-problem. The +1.5 °C crossing is fully measurable — the apparent fuzziness exists only because the baseline, datasets, smoothing, and crossing definition were never formally specified. Once these parameters are fixed, the crossing year is unique, empirically determinable, and mathematically straightforward:
\text{Crossing year} = \min \{ t : GMST(t) > \text{baseline mean} + 1.5\,^\circ\text{C (according to defined parameters)} \}
Since SR15 and the Paris Agreement, it has been possible to define these parameters and compute a single crossing year.
Data the issue is a non problem in a technical sense, but to get everyone to agree on formally specifying those parameters might be quite a large problem!
This post is really, really good. Thanks to all who worked on it.
Thank you, Gavin! Very precise and good overview regarding this subject. I think especially fig. 2 makes it clear, that different leaders in the last COP giving the impression that there’s still plenty of time to avoid crossing the 1,5-degree limit globally, are simply denying the facts. They are spreading big illusions, and there’s absolutely no reasonable doubt about why they are doing this: they are simply trying to deny that global heating has become dangerous, they are buying time for fossil capital by greenwashing the facts, as they have been doing all along. The result of this tactic is exactly what we can see: *the whole COP-process runs contrary to it’s official goals, and it does that more effectively than the open deniers like Trump, Putin, Bin Salman etc. alone are able to*. The majority in COP is in a rather subtle way functioning as their trojan horse, whether intended or not. Nothing implies that the crossing of the 1,5-degree limit in the years 2016, 2017, 2020, 2023 and 2024-25 should be seen as accidental outliers in the high end, meaning that the world soon will return to mean temperatures a bit below 1,5 degrees C above “preindustrial” – whether defined so or so.
Clearly the Earth doesn’t care what its temperature was in 1860. I know, there are lingering effects of heat or cold periods; but if we are wandering into conditions where positive feedbacks have started to dominate the climate, how we got here will matter a whole lot less than current rates-of-change. Except for “How do we argue with people who want to destabilize the climate for their own profit and comfort, who will deny any facts that threaten their energy-habit?”
Here is a GIFT link to the NYTimes flooding article linked to the final word “are” above. It’s a good series.
New York Is Going to Flood. Here’s What the City Can Do to Survive. It may have to throw every solution available at a worsening situation.
https://www.nytimes.com/interactive/2025/10/15/nyregion/new-york-climate-flooding-solutions.html?unlocked_article_code=1.AVA.PX_R.f5cdOhOi0zH0&smid=url-share
[graphical visualizations are very fine. Friends have told me you have to push though some advertising material to get to these links: please ignore them. Scroll to the end for links to resources used in article, like this one -> https://www.arcgis.com/apps/webappviewer/index.html?id=1c37d271fba14163bbb520517153d6d5
A slightly different analysis working backwards from today’s values?
“Earth’s average surface temperature in 2024 was the warmest on record, according to an analysis led by NASA scientists. Global temperatures in 2024 were 2.30 degrees Fahrenheit (1.28 degrees Celsius) above the agency’s 20th-century baseline (1951-1980), which tops the record set in 2023..”
Baseline (1951-1980)..January 1996: New York Times:
“One of the scientists, Dr. James E. Hansen of the National Aeronautics and Space Administration’s Institute for Space Studies in Manhattan, said he used the 30-year period 1950-1980, when the average global temperature was 59 degrees Fahrenheit, as a base to determine temperature variations. He said his readings showed that the average global temperature rose about as much since the base period as it did from the 1880’s to the base period – about half a degree in both cases. He stressed that these were estimates and that it would take millions of measurements to reach an accurate global average.”
Thus.. 2.3°F above 59°F = 61.3°F., 16.3°C.
Subtracting the Paris 1.5°C threshold is 14.8°C. That’s only 0.8°C above NOAA’s 20th century average of 14°C.
Ken Towes calculation is wrong because he has mixed up numbers using different baselines, including NASA’s 1951–1980 baseline, NOAA’s 1901–2000 average, and the Paris numbers based on the pre‑industrial baseline. Maybe some other things wrong as well. And I don’t believe it’s a mistake as such. Its more likely carefully crafted dishonest deliberate manipulation to get the numbers he wants.
Folks have repeatedly explained to this denialist crowd why temperature anomalies are preferable to absolute temperatures. They just refuse to honestly listen. It’s Towe’s usual reflexive contrarianism and disinformation. Folks familiar with his posts know that what he’s going to say on climate change or climate policy will be as honest and insightful as what Eric Dubay’s going to say on Earth’s shape.
Examples of what I meant:
Towe is just another persistent denier looking to disinform people:
Honestly. I’m not sure what he thinks the point is. Why would you even think that the NOAA 20th-century average should differ greatly from the NASA 2024 average minus 1.5C? Is the point that this cobbled-together sequence makes it appear that post-1950 warming isn’t very significant? Even if we take things as given, that’s 100 years for 0.7C, or 0.007C /yr, versus 75 years for 0.8C, which is 0.011/yr.–more than 50% more rapid. It hardly seems worth the convolutions, if that’s the idea.
In response to Atomsk and Kevin’s replies, I would like to point out that for a layman there is one serious advantage to absolute temperatures rather than anomalies, namely that they provide a single point of comparison.
This is especially valid if the size and significance of the anomalies are subject to amendment from continuing research, because any such amendment is weaponised by the denialists.
I know that in my own case I look regularly (and with considerable alarm) at NOAA’s CO2 numbers from Mauna Loa. I read many years ago that the world should aim to keep this under 350ppm, and while this stays as the consensus target I can see at a glance that the current number is too high and still going up!
If COP produced a similar consensus target for the annual average temperature required to avoid long term deleterious effects, this would be a number comprehensible by innumerate politicians/general public. They might or might not accept the number, but either way Climate Research would now not have any political implications unless it changed the target.
ozajh,
“If COP produced a similar consensus target for the annual average temperature required to avoid long term deleterious effects,”
The problem is that we don’t have any consensus on quantifying “deleterious effects” and how they are related to GMST. And getting one is hardly likely, given that folks (certainly here) only seem interested in quibbling about tiny variations in GMST itself.
I’ve offered this statement several times as an illustration, inviting anyone to disagree:
“I say that it is quite possible that we could reach 2.5C and the AMOC would slow significantly, but that it is equally possible that we could reach 2.7C and the AMOC would keep going with little effect on European temps.”
And I’ve predicted correctly that nobody will even attempt to offer any scientific contradiction. But similar uncertainties exist about many of the main negative consequences of increasing the energy in the climate system.
So I would suggest that more qualitative information, with more localized focus, would be a better choice than continuing to quibble about GMST, a not very important metric (however it is expressed), if the goal is to educate the public and make the trolling at least a bit more difficult.
RC, Gavin, et al.:
How do you assess Nerem et al., 2018, concerning satellite SLR data collected and assessed since 1993?
Because temperature data analyses continue to be subject to dispute (in no small measure because of the time lags in collecting, assessing, and modeling data, apart from questions on reliability of 19th century and early 20th century data, etc.), I put the question to one of the LLMs whether SLR data are “less contestable”. With the expected caveats, the LLM allowed that the data treated by Nerem, et al., indicate global SLR since 1993 and also account for the rate of acceleration of SLR across the two decades or quarter-century worth of data.
Apparently, with those data in hand, proper attributions accounting for documented SLR can (and must) be made (that is, no one is arguing that water is seeping voluminously into our oceans from vast reservoirs in the Earth’s mantle or crust). Volumes of ice mass loss (Greenland, Antarctica, mountain glaciers worldwide) may still be disputed, but the losses themselves are known, as is thermal expansion within our oceans.
If in fact the LLM can be trusted almost as well as the available data, why do we not use SLR data as the “bedrock” of arguments concerning the increasing likelihood that Technogenic Climate Change has already emerged and threatens to erupt in cascading self-amplifying feedback loops sooner rather than later?
My biggest fear remains that, by whatever date we can claim to have incontestable temperature data of climate tipping points being reached and/or exceeded, any and all subsequent mitigation efforts will be of far less utility and efficacy, should they possess any such values at all.
The UNEP Emissions Gap Report 2025 delivers a blunt assessment: despite a decade of the Paris Agreement, global climate action remains grossly insufficient. Emissions are still rising, updated national climate pledges barely budge projected warming, and world policies are steering the planet toward nearly 3°C of warming – far above agreed goals. Incremental progress on renewables and pledges cannot mask the core reality: collective inaction persists, and without immediate, deep, and credible mitigation commitments, the 1.5°C target will be missed and climate risks will escalate sharply.
The 1,5 degree “target” has already been missed. As every thinking person knew already when this new red herring was presented. Remember? James Hansen said it in late november 2015: “The Paris agreement is pure, unadultered bullshit”. By now it’s evident that he was coreect. You could easily see that from the very beginning: this was just the next trick in the greenwashing pantomime, the symbolic “policy”making theatre, which has the main aim of almost all politics in the mediotic age: the “leaders” want to be *seen* ***as if*** they were doing something. They are making simulacra. And behind this depressingly monotonous scenery oiligarchic business as extrremely usual just goes on and on and on until the bitter end.
Already the word “target” lets the cat out of the bag, and it was of course not chosen by accident. The better expression would have been “limit”, if you really wanted to do what they just wanted to simulate they wanted to do. The people making all these smoke and mirrors up aren’t at all concerned about anything but again and again setting new imaginary “target”s – *which they know will be missed* – which again gives them the excellent opportunity to set up new “target”s – which they know will be missed – and so on and so forth, until kingdom come.
Imagine for a moment if our dear warmongering oligarchs were using this “climate” policy method in defence, instead of what they always do… Fx.: if any politician like the ones we now have almost everywhere: Netanyahu, Biden, Trump, Putin, Xi etc. etc. this newyears moring would say in his speech to his nation: “My goal is to use 1,5 trillion dollars more on armament in 2040. I deeply feel the urge to strengthen our defences. I begin this enormous effort, the likes of which have never been seen before in the history of our great nation, by proudly reducing the amount of money used on defence by one billion dollars pro year until 2035. Me and my fellow leaders urgently need those funds just to keep thinking about how great this nation really is. If you personally want to use more on defence, nothing is better than that, just send me personally or my and your government the money.”
Of course anyone sane who heard this, would still be laughing in 2040.
But nonetheless, defence experts would then endlessly deliberate about if the funds for diasarmament this or that year really had been reduced enough to guarantee that “we” would hit the “target” of one trillion more spent on armament in 2040.
Why is this so obviously absurd and laughable, but not the “climate” policy, which uses exactly this method?
Just think about it.
Reminds me of the very corporate friendly New Zealand government lead by Chris Luxon who says he’s “firmly committed to net zero by 2050”. Only problem is he has no convincing climate policies and has cancelled almost every single policy the previous government had for cutting emissions. I don’t know if the man is lying or really believes his own BS. Either way is all Orwellian doublespeak.
No, the 1.5 °C target has not “already been missed.”
While the Paris agreement is silent on methodology, the scientific convention, developed primarily by the IPCC, assesses 1.5 °C above pre-industrial using ~20-year running means, not a single year. Short-term excursions (single years or a few years above 1.5 °C) are not considered a formal breach of the Paris goal.
A multi-decadal mean is intended to filter out internal variability, and reflects the non-linear, probabilistic nature of climate risk.
Global Mean Surface Temperature is not a policy input chosen directly by governments, like your defense spending analogy suggests. It’s an emergent system outcome, resulting from cumulative emissions, inertia, feedbacks, and internal variability.
The IPCC SR15 explicitly uses 30-year averages, not ~20-year.
The key principle — short-term fluctuations don’t count — is correct. But the formal definition is precise:
Global warming: The estimated increase in GMST averaged over a 30-year period, or the 30-year period centred on a particular year or decade, expressed relative to pre-industrial levels unless otherwise specified.
For 30-year periods that span past and future years, the current multi-decadal warming trend is assumed to continue. {1.2.1}
https://www.ipcc.ch/sr15/chapter/spm/spm-core-concepts/
In AR6, when discussing the time of crossing a temperature level (e.g., 1.5 °C), they use the 20-year running mean as a convention for determining when a sustained exceedance occurs. More specifically, it represents the first 20-year period whose averaged temperature exceeds the threshold.
In your link to SR15 they use the 30-year averaging period for determining warming.
Both approaches aim to filter out short-term variability and focus on long-term trends.
The difference is in the context. SR15’s 30-year averaging emphasizes historical and present warming estimates, whereas AR6’s 20-year criterion is used to define the crossing time of future projections.
Reply to Crusty Caballero
4 Jan 2026 at 9:47 AM
Crusty’s claim that AR6’s 20-year running mean “explains” SR15’s methodology is simply wrong.
As I described above, SR15 explicitly defines global warming as the GMST averaged over a 30-year period, centered on the year or decade of interest, to quantify when thresholds like +1.5 °C are crossed. This is the framework used to interpret the Paris Agreement goals.
AR6’s 20-year mean, by contrast, applies to future projection scenarios and was not even finalized when SR15 was produced. By collapsing these two distinct methods, Crusty commits a category error: historical/observed warming estimates are not interchangeable with scenario-based projections.
The 30-year SR15 convention is the definitive basis for calculating threshold crossings — nothing else, unless and until the IPCC revises its definitions by scientific consensus.
No, I never claimed that “AR6’s 20-year running mean “explains” SR15’s methodology.”
Please read my post again, and respond to what I wrote rather than what you think I wrote.
I’m simply saying that the IPCC uses the 20-year running mean as a criterion to define the crossing time of future projections.
Quoting from AR6 – Chapter 4, Future Global Climate: Scenario-based Projections and Near-term Information, page 555:
Crusty Caballero says
5 Jan 2026 at 6:39 AM
My point was — and remains — that this is irrelevant to SR15’s Paris-mandated 30-year GMST definition. Repeating AR6 scenario conventions does not address that point.
FYI, Crusty Caballero:
‘Data’ is a sockpuppet account of someone who’s trolled this forum for years under various sockpuppet accounts. Your point on the 20-year running mean has been explained to them multiple times, with supporting evidence. They just never honestly admit when evidence shows they’re wrong; it’s one of the tropes of their accounts. It’s one of the reasons many people on here have taken to ignoring their spam.
https://www.realclimate.org/index.php/archives/2025/12/unforced-variations-dec-2025/#comment-843341
What does evidence look like?
AR6 SSP framed scenarios dependent on a range of emissions levels, and the 20-year running mean, have nothing to do with the Paris Agreement nor a SR15 1.5C “crossing point”. Or this article published by Gavin.
In support of Crusty Caballero’s point about the 20-year mean being used for the Paris Agreement targets, and 1.5°C not being reached yet for those targets:
Re: “AR6 SSP framed scenarios dependent on a range of emissions levels, and the 20-year running mean, have nothing to do with the Paris Agreement nor a SR15 1.5C “crossing point”. Or this article published by Gavin.“
Incorrect, sockpuppet account. The Paris Agreement limits are based on the value at the middle of the 20-year mean. That necessitates making a projection for the future (i.e. a projected scenario), as covered in Dr. Gavin Schmidt’s article that you neither read nor understood:
I doubt you’ll honestly admit you were wrong on this, anymore than you admitted it the numerous other times you’ve been shown to be wrong across your sockpuppet accounts.
https://www.realclimate.org/index.php/archives/2026/01/unforced-variations-jan-2026/#comment-843479
Atomsk’s Sanakan
Yes, he’s clearly trolling, refusing to address the subject of my sub-thread.
So far he’s tried a straw man, a red herring, and a gish gallop. What will he try next!
What counts as evidence here is the relevant IPCC assessment commissioned under the Paris Agreement, not later summaries, dashboards, images or individual papers.
From IPCC SR15, Summary for Policymakers, Box SPM.1 (Core Concepts):
Global warming:
“The estimated increase in GMST averaged over a 30-year period, or the 30-year period centred on a particular year or decade, expressed relative to pre-industrial levels unless otherwise specified. For 30-year periods that span past and future years, the current multi-decadal warming trend is assumed to continue.” {1.2.1}
https://www.ipcc.ch/sr15/chapter/spm/spm-core-concepts/
SR15 explicitly defines global warming for Paris target assessment using a 30-year GMST average (SPM Box 1.2.1). That definition was adopted precisely to standardise how threshold crossings like 1.5 °C are assessed.
Later uses of 20-year means in AR6 scenario projections, WMO summaries, or individual studies and snapshots do not retroactively redefine SR15. They serve different purposes and operate in different contexts beyond the IPCC.
Citing secondary sources or post-hoc conventions does not alter the IPCC SR15 methodological basis for defining the Paris 1.5 °C ‘crossing point.’
Crusty Caballero says
6 Jan 2026 at 1:12 PM
Everyone chooses what they will believe. It’s not my role to hold their hand, say it’s OK or prove they’re wrong.
Re: “Yes, he’s clearly trolling“
Yup, as illustrated in his blatant self-contradiction about the Forster 2025 paper. That paper confirms your point about how the Paris Agreement thresholds are based on the long-term 20-year value. So they troll about it.
I really struggle with scientists who waste energy talking about how to split up things into neat divisions. How many continents are there? How many oceans? Or seas? Is Pluto a planet? These are all human constructs.
Here you are talking about an arbitrary increase from an arbitrary baseline in an arbitrary year. You waste all this brain power trying to compare now with some mythical perfect average planetary temperature in 1850 (or was it 1800? or 1780?). Typically (other than with climate science) the industrial revolution started in 1760, why not use that date? Or would it be more appropriate to base it on when humans first started large scale land clearing? Which of these dates had the perfect climate?
“Right now, while we are hovering around the 1.5ºC level” – Under which metric are we worse off than 1850?
And the single most important question to consider – which year in human history had the “best” temperature?
Happy New Year all
We want to see the trend, Keith. That means we have to compute a global baseline temperature for some period and then compute a global average temperature for each year after that. Then we draw a graph of all the yearly points and we include the baseline. We connect the dots and we can see the trend, up and to the right.
You’re correct that we can use any baseline we want, but we need temperature data to compute the baseline, and before 1850 there wasn’t enough. Also, the period from 1850 to 1900 was when the *US, and a lot of the world, changed from burning wood for energy, which does not add to the greenhouse effect, to burning coal for energy, which does add to the greenhouse effect.. So it makes sense to use that period as the baseline.
in Re to Martin Smith, 31 Dec 2025 at 4:37 AM,
https://www.realclimate.org/index.php/archives/2025/12/1-5oc-and-all-that/#comment-843296
and Keith Woollard, 29 Dec 2025 at 10:21 PM,
https://www.realclimate.org/index.php/archives/2025/12/1-5oc-and-all-that/#comment-843296
Dear Martin,
I understand the idea to put the baseline as a trade-off between sufficient certainty with respect to data availability and quality on one hand and minimal fossil fuel consumption on the other hand.
I only somewhat doubt about your statement “burning wood .. does not add to the greenhouse effect”.
So far, it was my understanding that this assumption applies only if the carbon pool existing in form of biomass remains constant. I thought that if it shrinked due to accelerated oxidation to carbon dioxide by biomass burning (irrespective whether it is for energy or in forest fires), it would contribute to the rise of atmospheric CO2 concentration (and thus to the rise of its greenhouse effect) as well. Am I wrong?
Dear Keith,
I understand your objection that disputing the “right” baseline for a trend may look as hair splitting, especially when it is already quite clear that there is indeed a temperature increase (irrespective whether we put the baseline to any time span between, let say, 18OO and 1900) and that more relevant for practical purposes than estimation of the most suitable baseline might be estimation of the right slope. On the other hand, as a layman, I can imagine that both tasks may not be easily separable from each other and that it can be the reason why climate scientists still dispute both.
Thank you, Martin and Keith, for your contributions, and all the best for the next year!
Greetings from Prague
Tomáš
You’re right about deforestation, TK, which is what was happening back then and is still happening today, but my point is that living trees are in the carbon cycle, so if you cut down a tree and burn it, you are returning CO2 to the atmosphere that was recently removed. That’s quite different from burning coal, which returns CO2 to the atmosphere that was removed from the carbon cycle during the Carboniferous geologic period.
Keith Woollard: “ Under which metric are we worse off than 1850?”
Sure – nothing to see, all is for the best in this best of all possible worlds, prof. Pangloss.
Keith Woollard – “Which of these dates had the perfect climate”
How many angels can dance on the head of a pin? Your question is poorly formulated (perfect for whom – colonial powers in Europe? nomadic tribes in central Asia? bushmen in Africa?), has no objective metric to judge higher or lower “perfectness”, and even if they had – provides no valuable insight – you can’t step into the same river twice – much less into a completely different river – what may have been “perfect” for the preindustrial Earth of a few 100 million of people may not be perfect for the 8 billion plus in the modern technological world.
Therefore, science asks question it can quantitatively answer – in this thread – what was the baseline temperature before significant CO2 emissions and the climate was in approximate
long-term equilibrium. And unlike yours – this question provides a valuable insight – allows us to see how far baseline climate we are being today and how further we will be under different emission scenarios in the future.
P: I haven’t actually seen the “when was the climate ‘perfect’ ?” argument for about a decade now. But like any good zombie, it appears to reassemble and arise from time to time.
KW: Hint. Climate “perfection” in any sort of the abstract is a ridiculous concept. Especially in any global sense. On the other hand, “survivable”, “supports economically productive agriculture”, “livable w/o 1st world economies”, etc. are not ridiculous concepts at all.
Piotr and jgnfld,
Perhaps I shouldn’t have used the word “perfect”, but the implication of this post and COP21 is that pre-industrial was “better” than now. I would strongly dispute that.
and jgnfld… you honestly believe early 19th century climate was more survivable or livable than now?
Keith Woollard: “ Piotr and jgnfld, Perhaps I shouldn’t have used the word “perfect”, but the implication of this post and COP21 is that pre-industrial was “better” than now. ”
Let’s test it – see if it makes any difference: ;-)
====
“How many angels can dance on the head of a pin? Your question is poorly formulated (“better” for whom – colonial powers in Europe? nomadic tribes in central Asia? bushmen in Africa?), has no objective metric to judge higher or lower “betterness”, and even if they had – provides no valuable insight – you can’t step into the same river twice – much less into a completely different river – what may have been “” for the preindustrial Earth of a few 100 million of people may not be better for the 8 billion plus in the modern technological world.
Therefore, science asks question it can quantitatively answer – in this thread – what was the baseline temperature before significant CO2 emissions and the climate was in approximate long-term equilibrium. And unlike yours – this question provides a valuable insight – allows us to see how far baseline climate we are being today and how further we will be under different emission scenarios in the future.”
====
So which of these arguments no longer holds?
KW: Do YOU believe on the basis of present knowledge that we are heading toward one MORE survivable to an average human out in the open than the 19th century climate, or LESS? Or are you planning for your kids to try farming on the Canadian shield when its climate is “perfect”?
Upon what, exactly, do you base your “belief”? Be specific.
You overlook the effects of more extreme weather. Also, the effects of rising sea levels, and rising ocean acidity levels. All of these will have a damaging effect on humans. I’m very much an amateur as far as climate science is concerned, but even I can see the flaws in your argument.
Sam Carana and I have gone back to include the Iron and Bronze age emissions, and we have the planet at 2.29C
Why ignore emissions from two epochs whose names indicate industrial processes!
https://kevinhester.live/2024/12/18/the-influence-of-climatic-change-on-the-late-bronze-age-collapse-and-the-greek-dark-ages/
in Re to kevin Heter, 30 Dec 2025 at 2:48 PM,
https://www.realclimate.org/index.php/archives/2025/12/1-5oc-and-all-that/#comment-843270
Dear Kevin,
If you are identical with Kevin Hester whose website you are referring to, please consider correcting your nick accordingly. And, if this website is indeed yours, I have a question to you:
If you do understand how Mr. Carana at https://arctic-news.blogspot.com/ arrived at setting the pre-industrial temperature (and perhaps also atmospheric CO2 concentration??) baseline to the year 3480 BC, could you explain? To me, his website cited by you seems to be somewhat messy.
Best regards
Tomáš
2.29 C is way off. The planet was approximately 14 C for many millenia. Even in the depths of an ice age the mean global annual temperature was 9 C.
Kevin Hetter: Why ignore emissions from two epochs (the Iron and Bronze age). whose names indicate industrial processes!”
Where is evidence for their effect on the global climate? The only plausible mechanism – via increasing atm CO2, would require sustained and significant increase in atm. CO2 starting in Bronze or Iron age and continuing to XIX century. Can you show it, and attribute it to their technologies?
Of course he can’t, because he evidently thinks that scale is irrelevant.
Keith Woollard: And the single most important question to consider – which year in human history had the “best” temperature?
Oh, for the love of dog! Keith, the single most important question isn’t about the temperature on a scale from 0 to 100, it’s the rate of change in temperature over time! We’re threatened by a comparatively high rate of change! Do you honestly need to be spoon fed this? It’s high school level analytic geometry!
If you must: the year that had the best temperature is the one with the annual temperature nearest the average of the last 5000 years. That’s when all of written history was made, during which GMST varied less than one degree from the average for the entire holocene (https://www.nature.com/articles/s41597-020-0530-7.pdf). We’ve now exceeded that range, and the rate of change in GMST may be accelerating!
IOW: It’s the trend, you incorrigible fool! I, for one, would have a happier New Year if you got that through your head!
Oh, I am so sorry Mal (and Martin and Tomáš), I read the article as though ” ideally below 1.5ºC and definitely below 2.0ºC” were scalars, I didn’t realise there was a time component involved.
It’s weird, if the COP21 attendees and Gavin meant it to be a rate it’s odd that wasn’t given.
….. but you would know best
Trend, Keith, the trend. Not rate. “The trend is your friend,” is what they say down at the stock market. Not so much here. Here the trend shows the global average temperature is increasing and the increase since the beginning of the fossil fuel age is well within the range predicted by models of the physics of the greenhouse effect. But you’re right, the rate of increase is important to, especially if the rate is also increasing, which the graph can also show..
So choosing a baseline is important. It doesn’t have to be the exact correct year. You just have to pick one that makes sense, and then stick with it.
Martin Smith: Trend, Keith, the trend. Not rate.
“The first rule of tautology club is the first rule of tautology club.” (R. Munroe).
“The first rule of tautology club is the first rule of tautology club.” (R. Munroe).
BPL: I’m stealing that.
Mal,
But Mal, when you and almost everyone else here spends all their bandwidth going on and on about small (and meaningless) variations in GMST, you open yourselves to exactly this kind of trolling.
And when I suggest, as I have for a long time now, that this narrow focus is poor communication/education for the hypothetical unbiased reader, the response is “well yeah, but someone just did a video saying it’s 1.6C by 2035 not 1.5, so we need to clear that up!”.
If you want to “correct” something, how about this:
I say that it is quite possible that we could reach 2.5C and the AMOC would slow significantly, but that it is equally possible that we could reach 2.7C and the AMOC would keep going with little effect on European temps.
I’m predicting that neither the actual experts nor the wannabees will want to explain the science of why that isn’t a reasonable statement.
Zebra: “But Mal, when you and almost everyone else here spends all their bandwidth going on and on about small (and meaningless) variations in GMST, you open yourselves to exactly this kind of trolling. […]And when I suggest, as I have for a long time now, that this narrow focus is poor communication/education for the hypothetical unbiased reader, the response is “well yeah, but someone just did a video saying it’s 1.6C by 2035 not 1.5, so we need to clear ”.
Not really – the response to you was a) that EEI is not a substitute for GMST, b) that it is EEI that is more, not less, vulnerable to misrepresentation and trolling, c) that we have many orders of magnitude fewer measurements of EEI than we have of T, d) that T is more relevant to many? most? of climate change impacts, and finally e) that in the context of communication/education – T is intuitively understandable/relatable by everybody, while your EEI – not so much.
This has been pointed out to you many times – your response was to either skirt the argument, or ignore it completely, and then repeat your long-standing narrative as if it has never been challenged. lecturing us again how GMST are “meaningless”, and how using T instead of your EEI is a “poor communication/education”. In short: EEI good, GMST bad! EEI good, GMST bad! EEI good, GMST bad!
==== A more detailed case against the supposed EEI superiority in climate science and its communication =====
Unlike EEI, T is intuitively understood by anyone who have ever seen a thermometer; is a variable that is easy to measure with a high precision thus has been measured countless of times all over the world over last 1.5 century, Yet Zebra chastises climate scientists for using GMST instead EEI in their work, and particularly in their education/ communication to the lay people. He insists that instead of GMST we must use EEI – a variable that lay people do not now it is being measured, a variable for which we have many orders of magnitude FEWER measurement than for T, and these that we have are from the last years? decades?, with nothing for the most of the period of human CO2 emissions, and no data in the preindustrial/geological past – since unlike T – there no icecore, sediment or microfossil proxies for EEI.
Further, EEI, unlike T, has hardly any clear connection to the effects of AGW that science and/or the public cares most:
1. it is T (with abs. humidity), not EEI, that determines air density and relative humidity – thus the vertical transport of heat in the atmosphere – and the altitude/temperature from which energy is radiated toward the space (flux of this energy is proportional to the fourth power of T+273.15K, not to the fourth power of EEI).
2. it is T that determines air-sea exchanges of heat, including the uptake of most of EEI by the oceans.
3. it is T (with salinity), not EEI, that determines water density, and therefore the rate of formation of deep water – therefore the strength of the very same AMOC that zebra have just used to lecture us on the superiority of EEI.
4. it is T, not EEI, that directly influence the capacity of the ocean to take anthropogenic CO2
(solubility of Co2 in seawater is a strong function of T),
5. it is the strong positive feedback between T and water cycle that strongly amplifies warming by human GHGs (7% higher water vapour saturation per deg. of T => AGW by higher absolute conc. of WV and/or fewer/higher clouds)
6. it is T, not EEI, that is directly linked to many ecological influences of AGW: metabolic rate, heat stress, protein denaturation, bacterial decomposition rates, lower oxygen availability in water – are all functions of T, not of EEI.
===================
zebra: you open yourselves to exactly this kind of trolling.
Sigh. We all open ourselves to trolling whenever we post here, z. Hell, trolls can make their own openings. Thankfully, some of us refrain from trolling better than others.
Mal: +++++
Additional compliments to Crusty C for: “So far he’s tried a straw man, a red herring, and a gish gallop. What will he try next!”
—
Also, trying to identify exactly what kind of troll is not a useful activity. We can hope Gavin Schmidt will take a look and get rid of a few more ringers.
Everyone chooses what they will believe. It’s not my role to hold their hand, say it’s OK or prove they’re wrong.
Brandolini’s Law, states that the amount of energy needed to refute bullshit is an order of magnitude bigger than that needed to produce it.
https://modelthinkers.com/mental-model/bullshit-asymmetry-principle
Hot air rises as do lightweights.
Data said: “It’s not my role to hold their hand, say it’s OK or prove they’re wrong.”
Then why do spend so much time on this website trying to prove people wrong?
Nigelj says
8 Jan 2026 at 1:16 PM
Then why do spend so much time on this website trying to prove people wrong?
Unfortunately, you are directing that question to the wrong person. Wrong target, yet again. Persisting in it doesn’t improve the argument nor your subjective opinion.
Now run along. Come back when you have something of real value to contribute.
D: Now run along. Come back when you have something of real value to contribute.
BPL: I’m sure you can be more condescending if you really try. Make an effort!
Data @ 8 Jan 2026 at 8:23 PM
Data: Everyone chooses what they will believe. It’s not my role to hold their hand, say it’s OK or prove they’re wrong.
Nigelj : Then why do you spend so much time on this website trying to prove people wrong?
Data: Unfortunately, you are directing that question to the wrong person. Wrong target, yet again. Persisting in it doesn’t improve the argument nor your subjective opinion.
Nigel: I think I have exactly the right target. You are the only person around here making the claim “Everyone chooses what they will believe. It’s not my role to hold their hand, say it’s OK or prove they’re wrong.. While spending a whole lot of time trying to prove people wrong.So answer the question and stop evading and deflecting.
Data: Now run along. Come back when you have something of real value to contribute.
Nigel: Patronising insult. The usual resort of people who cant prove their point. And very ironic given the huge volume of waffly rhetoric you post.
I have nothing the prove. Nothing to evade. My comments stand on their own. Everyone chooses what they will believe. It’s not my role to hold their hand, say it’s OK or prove they’re wrong.
D: It’s not my role to hold their hand, say it’s OK or prove they’re wrong.
BPL: This is the fourth time you’ve posted the exact same wording. Are we talking to a program?
Not clear what you were trying to say there, Mal.
The trolling happens.
You respond to it.
Only then does it go on and on.
I’ve often described this as a form of co-dependency. Are the trolls the addicts, or the people who go on and on and on responding, or are they both addicted to trolling?
(I know you like to get philosophical from time to time, so feel free to sort that out for us.)
zebra says
2 Jan 2026 at 6:41 AM
Mal,………….., you open yourselves to exactly this kind of trolling.
Keith Woolard is not a ‘troll’ nor is he ‘trolling’ this forum. The same goes for others, even Mr Know It All. Yes ‘trolling’ happens here but it is rarely if ever performed by what might be considered ‘climate science deniers’ on this forum. Rather the opposite is what regularly happens here.
Disagreement and Differing Opinions ≠ Trolling Performed by a Troll
zebra says
8 Jan 2026 at 6:20 AM
I’ve often described this as a form of co-dependency. Are the trolls the addicts, or the people who go on and on and on responding, or are they both addicted to trolling?
That is a much better question to explore in a quieter objective space. Not here.
Data says: “Keith Woolard is not a ‘troll’ nor is he ‘trolling’ this forum. The same goes for others, even Mr Know It All. Yes ‘trolling’ happens here but it is rarely if ever performed by what might be considered ‘climate science deniers’ on this forum. Rather the opposite is what regularly happens here. Disagreement and Differing Opinions ≠ Trolling Performed by a Troll”
Of course Woolard and KIA troll this forum. They both make inflammatory or offensive statements clearly to annoy people. That is the dictionary definition of trolling: making inflammatory or offensive statements to annoy the group.
Woolard does it by repeating his denier slogans. For example: “And the single most important question to consider – which year in human history had the “best” temperature?” This is annoying and obviously designed to be provocative. He does however make some constructive criticisms, so he isn’t constantly trolling.
KIA trolls virtually all the time for example with his climate posts about some snowstorm somewhere etcetera. In this forum that sort of rhetoric is inflammatory and annoying. He does it with frequent political posts virtually all of which are inflammatory and lies. KIA is a perfect example of a troll. You could put his photo in a dictionary definition on trolling.
Obviously not all deniers are trolls – some are polite and make reasoned and constructive criticisms. But many repeat stupid slogans and false accusations which are inflammatory so they are trolling in a climate forum setting. It’s obvious.
Nigelj,
The entire focus of this post is about the definition and measurement of pre-industrial global temperature so that we can keep within a predefined scalar of that.
Surely asking what value we should be aiming for is absolutely central to this quest? I am not asking to be inflammatory, and if you are genuinely offended I am sorry for you
It sounds to me like you are suggesting that the IPCC and CoP21 have made an edict that cannot be questioned.
No, Keith Woollard, it’s just trolling that commits the nirvana fallacy / the perfect solution fallacy. Someone doesn’t need to tell you what their ideal house is for them to say they were prefer a house without termites vs. a house with termites. Similarly, someone doesn’t need to tell you what their ideal global temperature is for them to tell you they prefer it below 1.5 degrees above 1850-1900 vs. at least 1.5 degrees above 1859-1900. You like making the perfect the enemy of the good to suit your policy bias.
And it’s also fallacious trolling to ask ‘under which metric are we worse off than 1850?’. That commits the single cause fallacy. Many factors contributed to us being better off than in 1850, such as better sanitation, vaccines, GMOs, etc. That does not prevent anthropogenic climate change (ACC) from having a negative effect. The impact of ACC is determined with vs. without ACC, not by comparing now to 1850 without accounting for many other confounders that differ between now vs. 1850. To say otherwise is as ridiculous as saying machine guns don’t harm people now, by saying we’re better off now than in 1500 when there were no machine guns, while willfully ignoring the other confounders that changed between 1500 vs. now.
Folks have corrected on you on this for months (if not years), but you persist anyway, as per trolling. No doubt you’ll continue with this in the future, acting like no one has ever debunked your script. That’s how persistent denialism works.
Keith Woolard, I dont find anything you write offensive. That label applies to KIA. I dont have nothing more to add because AS reply suffices perfectly well.
You completely misrepresent what I have said Atomsk’s Sanakan. I am asking which is the best climate? That is the metric I am after.
You say below 1.5 is better than above……Why?
There’s that bad faith again, Keith Woollard. I didn’t say below 1.5 degrees is better. I said saying that does not commit one to answering your malformed question on what the ideal temperature is. Let me when you can finally honestly admit that, and when you finally decide to stop committing the nirvana fallacy.
“The nirvana fallacy is the informal fallacy of comparing actual things with unrealistic, idealized alternatives.”
https://en.wikipedia.org/wiki/Nirvana_fallacy
KW: . I am asking which is the best climate?
BPL: The climate as close as possible to the one all our agriculture and civilization grew up under. For that, mean global annual surface temperature should be close to 287 K.
Atomsk’s Sanakan says
12 Jan 2026 at 12:06 PM
No, Keith Woollard, it’s just trolling that commits the nirvana fallacy / the perfect solution fallacy.
Keith Woollard says
12 Jan 2026 at 10:35 PM
You completely misrepresent what I have said Atomsk’s Sanakan. I am asking which is the best climate? That is the metric I am after.
Atomsk’s Sanakan completely misrepresents what everyone says here, all the time.
But no one seems to care in the least about that. He keeps on lying and trolling disrupting the entire forum. A late comer to these parts all his other pastures must have dried up.
BUt if this the kind of patron Real Climate seeks, then so be it. It’s on them, no one else.
Killian reminded everyone what this place is like for decades. Atomsk’s Sanakan makes it ten times worse then ever; while Piotr destroys any semblance of decency and equanimity as well. His forte. Atomsk’s Sanakan knows nothing about climate science and has no skills in it. He’s just a well read Lawyer prosecuting a case. His own. That he lies and distorts everything so much kind of proves that analogy might even be true.
They’d be better off rid of him. Buy you can’t put wise heads on young shoulders.
Unfortunately, I am traveling, so y’all are victim to the tiny cell phone keyboard and my fat fingers.
Many people who pose the question “But what’s the best climate,” are in fact trolling. However, let us give KW benefit of the doubt.
There is in fact economic data looking at the effect of temperature on economic growth, and this data does in fact suggest there is an optimal temperature range for GDP growth. Unsurprisingly it is the range found in latitudes 40-60 deg. Moreover, warmer temperatures decrease growth significantly (been a while since I looked, but I’m remembering ~1 percentage point per degree of average temp). Salubrious and pestilential climates do exist.
Wow, Atomsk, that’s really being pedantic. You are correct, you didn’t say that below 1.5 is better than above, so I will address my question to the mythical person that has said that (i.e. the vast majority of the people reading this, and the 45,000 attendees at CoP21)
Why?
BPL,
Really? So you’re saying the historical natural climate is preferable?
That’s odd, considering that for at least the last couple of millennia we’ve been actively trying to modify it. Should we tell farmers to stop using greenhouses? (obviously I won’t mention CO2 being pumped in) That orchards should never use frost protection? Or that people shouldn’t live in artificially heated homes?
Perhaps you should also inform the WHO that they’re mistaken—that 13.9°C is optimal, rather than the 18°C minimum they recommend, or the 20°C advised for vulnerable people.
Deniers, Doomers – bedfellows strange no more. Both try to discredit IPCC and climate science, both attack renewables, DAC and net zero, both use the all-or-nothing fallacy to dismiss the sense of mitigation of AGW, both disparage using existing technologies, market mechanisms and policies reducing the AGW. For fundamentalists there is nothing worse than a moderate, and that’s why Data vigorously defends his opposite – the long-term denier Keith Woollard., and before defended denier Ken Towe. The enemy of my moderate enemy is my friend:
Data, in defence of Keith Woollard: Atomsk’s Sanakan completely misrepresents what everyone says here, all the time.
The latest example of Data’s projections of his actions onto his opponents, confirmation bias, triumph of ego over values (defending one’s ego at the cost of aligning oneself with the people from the opposite extreme). That and thrown in for a good measure, a Freudian slip later in the thread. Data – a walking, talking, psychological cliche ! ;-)
P.S. What and your Woollard try to disparage as “misrepresentation” – is drawing a falsifiable logical conclusion that neither Woollard nor you, were able to to counter with a MORE plausible counter-explanation.
Keith Woollard, you’re deflecting from the fact that your nirvana fallacy has been exposed. You’re likely doing that so you can resort to that fallacy later, as you’ve done on Real Climate for months, if not years.
Again: your questions on ‘best’ or ‘perfect’ climate/temperature are malformed and commit the nirvana fallacy. No one is under any obligation to answer them, anymore than someone is required to explain their ‘best’ or ‘perfect’ house when they explain to an exterminator that they want a house without termites vs. with termites. One can say ‘X is better than Y’ without explaining an idealized Z that’s best or perfect.
So these are malformed questions meant to troll people:
I wanted you to see this RC, Gavin:
Hickey, J. (2025). Artificial stepwise increases in homogenized surface air temperature data invalidate published climate warming claims for Canada. Zenodo. https://doi.org/10.5281/zenodo.18039553
[Response: Classic case of confirmation bias. Let’s posit that Eastern Canada had some systematic artifact in operating methods/equipment or recording protocols in 1998. What would one expect? You would expect that this would not be seen in neighbouring stations in the US, or Greenland, or elsewhere in the Northern Hemisphere. Unfortunately for this thesis, pre-1998 and post 1998 changes are actually comparable across all these places. The fact is that 1998 was an exceptional year in terms of temperature anomalies, mainly due to the impacts of the 1997/8 super El Niño event (something oddly not mentioned in this document). It is clear in the raw data as well as the homogeneised data, but it sits in the context of a global trend. It is very easy to pretend that there is no trend by cherry picking periods for a linear analysis – indeed, the ‘escalator’ graphic made by Skeptical Science has been lampooning this for years, but basing conclusions on what is essentially just a vibe is not particularly sensible. Sorry – there is nothing here. – gavin]
OK, thanks Gavin.
Still without that 1998 step the trend is not statistically distinguished from zero for 1948-2018 in Canada.
This would mean that the surface temperature is not determined by changing radiation balance from increasing CO2, but rather predominantly determined by ocean-atmosphere dynamics mainly believed to be the result of variations in solar irradiance.
This is my paper on radiation balance: Rancourt, D. G. (2011). Radiation physics constraints on global warming: CO2 increase has little effect (1.1). Zenodo. https://doi.org/10.5281/zenodo.17202570
[Response: There is no time series (trend + noise) that you couldn’t play this game with and convince yourself there is no trend. It’s numerological pseudo-science. – gavin]
in Re to Denis Rancourt, 2 Jan 2026 at 11:11 AM,
https://www.realclimate.org/index.php/archives/2025/12/1-5oc-and-all-that/#comment-843392
Dear Dr. Rancourt,
Different from Dr. Schmidt who addressed solely your opinion regarding the alleged absence of a temperature trend in Canada during the last several decades, I would like to ask a question to your 2011 article.
It appears that based on your assumption that the energy fluxes through Earth atmosphere and surface as reported in literature are incorrect, you inferred a significantly higher IR opacity of the atmosphere than commonly assumed, and therefrom you construe your conclusions that CO2 absorption bands are almost completely saturated and that changes in the atmospheric CO2 concentration must have much smaller influence on Earth radiative (im)balance than generally assumed. Am I right?
If so, my question reads:
Are you sure that the mainstream climate science derived all the values of the energy fluxes (and/or the (allegedly too low) infrared atmospheric opacity / incomplete saturation in CO2 absorption bands) solely (and improperly) from Earth albedo observations (as you seem to suggest), instead e.g. from independent spectroscopic laboratory studies of greenhouse gases, their detailed validation by theoretical quantum mechanical computations, and from detailed knowledge of the height profile of their atmospheric concentration?
Thank you in advance for a comment and best regards
Tomáš
Denis Rancourt “ Still without that 1998 step the trend is not statistically distinguished from zero for 1948-2018 in Canada.”
Explain then why Zhang et al. (2019): Changes in Temperature and Precipitation Across Canada; Chapter 4 in Bush, E. and Lemmen, D.S. (Eds.) Canada’s Changing Climate Report. Government of Canada, Ottawa, Ontario, pp 112-193.
for practically the same data range – found the opposite:
“Between 1948 and 2016, the best estimate of mean annual temperature increase is 1.7ºC for Canada as a whole and 2.3ºC for northern Canada.”
And here is a graph for it: https://changingclimate.ca/CCCR2019/chapter/4-0/ In this graph, there are TWO variables plotted: blue are annual temp anomalies, and black are 11-year running average anomalies: To illustrate the difference in the variability of each = here are data for T anomalies for several years:
yr 1949 1950 1951 1952
blue -0.02 -1.96 +0.65 -0,79 std. dev=0.385
black -0,24 -0.13 -0.13 -0.17 std. dev=0.035
As expected. the black variable, being 11-year avg., has MUCH smaller standard deviation.
In the graph we see why the trend of the black line is significantly different than zero, the warming trend is strong compared to the tiny noise (the small fluctuations of the black line)). In contrast. the blue line is very noisy – hence the trend of the blue is small comparing to the very large year to year noise of blue line.
Of those two – ONLY the black line – the 11-running average, is informative of the climate – over long time-scale, the warming trend overpowers the tiny residual fluctuations, left after averaging out the short term variability by the 30 year (climatic) averaging. And it is at this timescale at which CO2 increases enough to have an influence on global T.
In contrast, your analysis of the blue line tells us nothing about climate trends, in fact it is a “negative knowledge” – as it actively misleads us about climate – it claims to have disproven the effect of CO2 on climate, I quote:
Denis Rancourt: “ This would mean that the surface temperature is not determined by changing radiation balance from increasing CO2” and attributes all changes to “ variations in solar irradiance” (no evidence provided).
And to suggest to the reader a scientific rigour, this misinformation uses scientific language:
“the trend is not statistically distinguished from zero for 1948-2018 in Canada” and suggests scientific credibility of the author disporing of the role of CO2 by referring to the professionally looking reference (“Rancourt, D. G. (2011). Radiation physics constraints on global warming: CO2 increase has little effect (1.1). Zenodo”)
I, when proven wrong, change my opinions. What do you do, Mr. Rancourt?
One of the oldest “lying with statistics” methods is to start at a local max and end at a local min and declare “no trend”. The second oldest is to take too short a period and declare “no trend” in absolute defiance of hypothesis testing logic. The third oldest is to use statistical insignificance to assert “to underlying trend” again in defiance of HT logic.
A rather newer method is self-citing non-peer-reviewed work with ZERO recorded citations after now 15 years as meaning anything at all scientifically.
Hey, but he managed to click-bait his paper, at least.
Yup, and he can claim he got a response from Gavin Schmidt, without specifying that the response was dismissive. That counts for sumpin, dunnit?
Thanks for the link to the Hickey 2025 paper. The email correspondence is interesting. Perhaps the work will lead to greater efforts by Environment and Climate Change Canada (formerly Environment Canada) to identify specific dates of change from manual to automated observations within the metadata archives. Facts are better than stats.
Denis, quite interesting to look at the bios your group (https://correlation-canada.org/about/ ) , and the fact that you and your organization seems to have put a lot of effort into churning out preprints denying the harms from the SARS-CoV-2 virus. It seems they didn’t ever make it through any peer review, though.
I see that before you made greenhouse warming disappear, you made the COVID pandemic in Canada vanish.. Miraculous.
“Analysis of all-cause mortality by week in Canada 2010- 2021, by province, age and sex: There was no COVID-19 pandemic, and there is strong evidence of response- caused deaths in the most elderly and in young males.”
August 2021 DOI:10.13140/RG.2.2.14929.45921
Authors: Denis G Rancourt, Marine Baudin, Jérémie Mercier
In a different preprint’s abstract, you claim that there’s no correlation between COVID vaccinations in the USA and changes in death rates from the disease – have you read the peer reviewed studies that compared post-availability death rates from COVID-19 in Ohio and Florida, which noted that deaths dropped off sharply in counties that trended more towards Biden and death rates stayed higher in counties that hewed more to vaccine-denier Trump and DeSantis?
In another of your group’s output the abstract claims:
https://doi.org/10.13140/RG.2.2.11570.32962
It goes on in a way that would be amusing but my brother lost TWO middle-aged in-laws in the same week to COVID. Not seniors, but parents and both listened to nonsensical misinformation that said vaccines weren’t needed and COVID-19 was just like the flu. They weren’t suffering the stress of government public health efforts – they died because they’d believed lies.
Regarding seasonal structure – you might not have spent much time in the US Southeast, which trended anti-precautions during the pandemic, yet also are driven to indoor gatherings when summer temperatures get too much to bear. I’ve been there, I’ve seen it.
I note that ResearchGate states your name as lead author for the COVID pre-prints but that you are not listed in ResearchGate or have not claimed the work – you might want to address that at some time.
I note that the third author has a website where he advertises a liver cleanse and also this:
So you’ve moved on from presenting the global pandemic as a hoax?
Pardon my stating an opinion, but your group appears biased against public health measures and the medical/epidemiological body of evidence, and now might be trying your hand at yet another of the innumerable attempts to pretend a couple hundred years of physics, chemistry, etc. is all wrong.
Many climate denial groups pivoted to denying a global pandemic once the seriousness of it was evident, your team appears at least to have run in the opposite direction. This is just my opinion, but without peer-review, all those pre-prints on COVID are, too.
As a former Cdn academic myself I knew all about but did not mention his rather chequered history of “research” and “teaching” above which is mostly 100% political activism It is easily googled and/or wiki’ed.
He managed to pull off two rather unimaginably difficult Cdn tricks first of getting many of his own colleagues to give up support for his so-called academic freedom so much so the CAUT supported the university’s firing* and second of being convicted in civil court of defamation against a fellow faculty member. I think he may be the only person in Cdn history to manage this particular exacta.
I might add that Sen. Inhofe likes his climate “research”.
As for those who say this is all ad hom, well there is absolutely no actual science to discuss so the “hom” is the only thing in play TO discuss.
______
*Not even Marlene Webber at my own institution managed to do that! We quite rightfully were censured by CAUT for many years for the bad faith actions of the admin.
@jgnfld – thanks for the background, I’d been unaware of him until I started trying to learn the qualifications of the author (also in his organization) of the climate thing. Nonsense about climate change? Not as big an issue at this point since nonsense has already been deeply set in many people’s minds since the oil industry first had valid confirmation of the dangers of continued use of their products. And the solutions to fossil burning are falling into place – too slowly, but the end will happen.
Infectious disease is different since there’s always the next one evolving or encountering humans as we spread into formerly uninhabited areas. We’d been winning many battles – the development of the mRNA vaccines was nearly miraculous, so people trying to deliberately misinform for their own purposes hits me hard.
Long covid ended my mother’s independence when it affected brain, not lungs. My brother’s in-laws lived in two separate states and both died long after vaccines were available – their mom had been released from a month in the hospital the same week they both died. Imagine what that family has been going through, dealing with loved ones who died because they’d been told vaccination was needless, and they fell for the lie..
I and many family members live in northern big cities, and the sound of ambulances was far too common in 2020. A nephew drove an ambulance for a big city hospital – started about a month before the pandemic hit.. And a friend volunteered to do vaccinations in Idaho – she can tell stories of the people slinking in for a shot, with their MAGA shirts or hats, after losing a few too many family members of their own – sometimes watching loved ones die while still denying what it was killing them..
As you said, there’s no science in what I looked at yesterday, but this isn’t an ad hom against people who clearly aren’t doing science when they claim they are – it’s just an informal peer review.
1.5ºC and all that
28 Dec 2025 by Gavin
The Paris Agreement temperature limits are a little ambiguous and knowing where we are is tricky.
The desire to keep global temperature rises since the pre-industrial, ideally below 1.5ºC and definitely below 2.0ºC, is a little bit complicated by the lack of definition in what constitutes the pre-industrial, uncertainties in what the temperature was in the pre-industrial, and an ambiguity in what counts as exceeding these limits.
https://www.realclimate.org/index.php/archives/2025/12/1-5oc-and-all-that/
Data responds: the Paris Agreement temperature limits are explicit and well-defined.
The Paris Agreement temperature limits were explicitly adopted at COP21 in 2015 (Decision 1/CP.21), so the “desire to keep below 1.5 °C” is not ambiguous — it is a clear policy commitment. It’s all already there — in COP21 and SR15. Just add logic and common sense.
To maintain consistency with SR15, the pre-industrial GMST baseline should be defined using the datasets available at the time—HadCRUT4, GISTEMP, Cowtan–Way, and NOAA—covering 1850–1900. For current estimates, the best-practice approach is to use these long-term datasets where available (HadCRUT5, NOAA v6, Berkeley Earth), add reliable datasets such as NASA-GISS and ERA5, adjust them to the same 1850–1900 reference, and calculate a mean across them all. For any 30-year centered period extending into the future, simply extend the recent multi-decadal trend linearly; no speculative projections or alternative datasets are required.
This method ensures continuity with the original SR15 analysis, avoids unnecessary complexity, and transparently identifies when GMST crosses 1.5 °C. Introducing new or untested datasets, such as DCENT, is unnecessary and adds uncertainty without improving comparability. Importantly, the 1.5 °C crossing is primarily a political event—it matters for COP21 Paris Agreement reporting and framing, not for fundamental climate science or calculations.
References:
SR15 Summary for Policymakers
https://www.ipcc.ch/sr15/chapter/spm/
About https://www.ipcc.ch/sr15/about/
Core Concepts Central to this Special Report-Box SPM.1
https://www.ipcc.ch/sr15/chapter/spm/spm-core-concepts/
SR15 Figure SPM.1
https://www.ipcc.ch/site/assets/uploads/sites/2/2019/02/SPM1_figure-final.png
IPCC adopted outline SR15
https://www.ipcc.ch/site/assets/uploads/sites/2/2019/03/l2_adopted_outline_sr15-2.pdf
Adoption of the Paris Agreement-COP21
https://unfccc.int/files/home/application/pdf/decision1cp21.pdf
Being aware of these historical documents should clear up most confusions.
Those eager to shut down all honest information are delighted that we are all quibbling over definitions and detail. Bookburning, forcing educational institutions to give time to lies, extortion, shutting down progress, bullying, massive subsidies and tax breaks to delusional billionaires, these are our reality in the US, rapidly being exported around the world where the wannabe bosses see they only need to get us fighting with each other to ‘win’.
Promises to do something by some specified future date are useless if they are not accompanied by effective action.
Consider the people so angry about Gaza [substitute your preferred issue here] they didn’t bother to vote or voted for pitchforks. Someone rooted in reality would not spend hours on minutiae but get to work doing something useful.
Think of a sand clock. Such a simple thing. We all know what happens every time you turn it upside down.
We can easily have an idea of the size and the shape of the little sand mountain formed and the time it took to travel from one globe to the other.
But if you want to know what happens with each of the sand grains, or when and where little avalanches are going to happen,… good luck.
Denialism has invest huge amounts of money trying to bring science and public to this arena; if you cannot be scientifically sure of what is going to happen to each of the sand grains, you cannot understand and predict what’s going to happen when using the sand clock.
Please, stop wasting time discussing the obvious because we don’t have and answer for all the details in chaos,
There are always very good arguments (apparently) to discuss about the destiny of each sand grains but that knowledge is BS.
https://youtu.be/JxE6XFKOaRM
GW appears to have accelerated significantly according to research by Stefan and Grant.
That pre-print was discussed at length in threads elsewhere:
https://www.realclimate.org/index.php/archives/2025/11/unforced-variations-nov-2025/#comment-842447
The main points are that the pre-print does not show statistically significant acceleration of global warming, but instead shows statistical significant acceleration of the adjusted global temperature trend (i.e. the trend after removing the impact of changes in total solar irradiance, ENSO, and volcanic emissions). Using that adjusted trend to project future global temperature trends, as done in the video you cited from Paul Beckwith, likely overestimates future global warming.
Does it. Got any evidence for that then ?
You were already linked to evidence, and it’s stated in their pre-print. Did you read the pre-print, or only watch Beckwith’s video?
I can’t see what you are saying. Is it warning faster or not. 90% isn’t 95% but 90% is significant !
Is it warning faster or not or we can’t tell because the time lines arnt long enough to know to the 95% confidence level we need and if this is the case then we need to wait another 20 years to know.
There’s a risk of incorrectly claiming the warming rate increased or decreased, when it actually did not. To address that, experts set pre-determined threshold that needs to be reached before claiming the warming rate increased or decreases. That threshold is the 95% confidence level for statistical significance. That threshold was not reached when contrarians claimed there was a post-1998 decrease in the warming rate. So those contrarians jumped the gun. Same point for now claiming a post-2010 increase in the warming rate; the threshold has not been reached. So no, 90% is not enough for statistical significance. That was explained in the other source you cited:
https://www.realclimate.org/index.php/archives/2025/12/1-5oc-and-all-that/#comment-843600
And no, you would not need to wait 20 years. The larger the claimed warming acceleration, the less time that’s needed for statistically significant detection of that warming. The Beaulieu 2024 paper I cited above explains that if warming accelerated to 0.28∘C/decade for 2010-2030, then that would be statistically significant acceleration; i.e. you’d be waiting for 4 years, not 20 years. See figure 4:
https://www.nature.com/articles/s43247-024-01711-1
I also forgot to mention this from pre-print co-author Grant Foster:
“I personally don’t expect the world to continue at such a fast and furious pace, my personal “best guess” is 0.33 °C/decade.”
https://tamino.wordpress.com/2025/06/08/picking-up-speed/
So less than the trend Beckwith uses in that video to project for the future.
So it has accelerated then ? 0.33C is significant as it’s essentially a doubling from 0.18C a decade,
As for Paul Beckwith, you exaggerate to get people’s attention such is the nature of politics in order for people to feel we need to do something about it.
People have made many statements in this regard – snow is a thing of the past. The Arctic will be ice free by 2020-2030 etc – it’s common practise but alas you get it from all sides and hence not much is being done.
Still we are told lots is being done but fir the moment fossil fuels arnt diminishing much
0.33∘C/decade is his guess for the future global temperature trend after removing the impact of changes in total solar irradiance, volcanic emissions, and ENSO. That’s not the same as the global temperature trend without those factors removed.
And ‘significant’ here means ‘statistically significant’. That’s checked for by running statistical tests, not just by comparing two warming rates. I already showed that the pre-print, along with another peer-reviewed paper the pre-print cites, show that there is not yet statistically significant acceleration of the global temperature trend:
https://www.realclimate.org/index.php/archives/2025/12/1-5oc-and-all-that/#comment-843589
An additional issue here which I see PB gets at is to let’s say the rate has been stable at .17 degrees per decade or .017 degrees/year with an annual S.D. about 10x that or about .17 degrees/year. (This is not far from the observed values over recent history depending on which series and specific time period you pick.)
Now let’s posit a step change* where the new future rate is .33./decade. How many additional years must you observe before you will see a significant difference from the .17/decade rate?
Depending on various assumptions (I specifically ignore autocorrelation which would add more years), I get a period of around 18 years or so. So that gives our denial crews here lots of time to continue to deny based on pure trend analysis alone. But there is also physics.
Time series analysis is not easy. Grant Foster has significant publications it in at least 2 specific fields requiring time series analysis of which I am aware: climate and astrometry. I would suggest listening to him rather than any serial mis/disinformer of which we see many here.
_________
*just to make the most extreme case as slower trend changes over time will take longer to see.
Pete Best: “As for Paul Beckwith, you exaggerate to get people’s attention for people to feel we need to do something about it.”
… and when it is show that it is exaggeration – the exaggerator won’t achieve his stated goal (motivate people “to do something”). but the opposite – not only will he has his own credibility shot to pieces, but the deniers will use the exaggerator to discredit by association all those who did not exaggerate, will use your exaggerator as their strawman. “How many times have you been crying wolf already?”
The road to hell is paved with good intentions – by playing straight into the hands of the deniers the exaggerators make “people” not more, but less likely “to feel we need to do something about it”. Or the phrase of Lenin – they are “useful idiots” of the very interests they are supposedly fight. By their fruits, not their good intentions, you shall know them.
Pete Best says
9 Jan 2026 at 4:51 AM
So it has accelerated then ? 0.33C is significant as it’s essentially a doubling from 0.18C a decade, …..
A key point here is to distinguish what a paper is designed to show from what it can actually tell us about the climate system.
Papers optimized for null-hypothesis testing over short windows, like Beaulieu (2024), are methodologically rigorous but not designed to assess system-wide acceleration. They test whether a short-term surface temperature trend crosses an arbitrary statistical threshold — often 95% confidence — which is highly conservative and may not reflect real-world changes.
By contrast, Forster et al. (IGCC 2024/2025) https://essd.copernicus.org/articles/17/2641/2025/ — is a state-of-the-system assessment: it integrates multiple lines of evidence — global surface temperatures, ocean heat content, Earth’s energy imbalance, and human-attributed warming — to provide a reality-facing view of acceleration in the climate system. This is the paper that is fit for purpose if we want to understand whether the rate of warming is truly increasing.
In short: method papers are for testing statistics; system-indicator papers are for assessing actual changes. Both are useful, but only the latter gives the coherent picture that aligns with physics, observed data, and multiple indicators.
The Foster-Rahmstorf paper and his blog commentary actually supports that framing
Global Warming has Accelerated Significantly – See Table 1:
https://assets-eu.researchsquare.com/files/rs-6079807/v1_covered_209e5182-d9a5-4305-a4e0-70204151d2b3.pdf and
https://tamino.wordpress.com/2025/06/08/picking-up-speed/
By contrast, the PubPeer commentary and Beaulieu (2024) do not provide that system-level context, as they are focused on very different methodological questions.
Pete Best. I had to sit with that when I saw it. I assumed others would respond. However, I’m going to slightly distort what you wrote to make my point, to wit:
more or less: Because other people lie, we need to lie. The situation is dire, and that justifies it.
Nope. I don’t believe, in the long run, abandoning scientific integrity will solve anything. [I feel the same way about meeting violence with violence. imnsho, escalating makes things worse.]
Re: “By contrast, Forster et al. (IGCC 2024/2025) https://essd.copernicus.org/articles/17/2641/2025/ — is a state-of-the-system assessment: it integrates multiple lines of evidence — global surface temperatures, ocean heat content, Earth’s energy imbalance, and human-attributed warming — to provide a reality-facing view of acceleration in the climate system. This is the paper that is fit for purpose if we want to understand whether the rate of warming is truly increasing.“
Yet a sockpuppet account pretended that paper was not peer-reviewed, showing themselves to be an untrustworthy disinformer. Oh well.
jgnfld says
9 Jan 2026 at 4:55 PM
https://www.realclimate.org/index.php/archives/2025/12/1-5oc-and-all-that/#comment-843704
Time series analysis is not easy. Grant Foster has significant publications it in at least 2 specific fields requiring time series analysis of which I am aware: climate and astrometry. I would suggest listening to him rather than any serial mis/disinformer of which we see many here.
I must agree with that. I can recognise at least 3 serial mis/dis-informers here but I’m too polite to name them.
Grant Foster gives a good account of himself on his blog. He doesn’t need my approval but people should simply read it for themselves.
Including this https://tamino.wordpress.com/2025/05/28/how-fast-is-the-world-warming/
and https://tamino.wordpress.com/2025/06/08/picking-up-speed/
and the paper in question which covers all the bases and explains exactly their position on the analysis being done.
https://www.researchgate.net/publication/389855619_Global_Warming_has_Accelerated_Significantly
I expect it will pass peer-review with few adjustments.
I’d prefer to get news about Stefan Rahmstorf and Grant Foster from them, not from Paul Beckwith, who is well known for overstatement and exaggeration, which enables fake skeptics to dishonestly attack the field.
He’s citing their paper so he is getting it from them. Geez, this site is so odd.
My point is that since their work is readily available elsewhere, it’s better to avoid less reliable resources. I’m sorry you feel that way. PB dominates searches, and I don’t regard that as helpful.
https://www.researchgate.net/publication/389855619_Global_Warming_has_Accelerated_Significantly
Please don’t blame RC for those of us taking advantage of its lax moderation. I’m just me. FWIW, you are a more respectable resource for real climate science than I am. But I hold a watching brief for denialism and PB enters the chat because of this.
Oops, didn’t notice that PB are your initials as well. I meant Paul B.
No, Susan Anderson is being wise here. This isn’t a peer-reviewed paper; it’s a pre-print. And Beckwith is citing Leon Simons’ extrapolations from the pre-print. One of the pre-print’s co-authors thinks those extrapolations likely overestimate future warming. Yet Beckwith’s warming projection is even higher than that overestimate. Moreover, the pre-print admits it does not show statistically significant acceleration of the global temperature trend. I showed you that above. So the ‘global warming’ in the pre-print’s title “Global warming has accelerated significantly” misleadingly refers not to the global temperature trend, but instead to the global temperature trend after subtracting out the impact of changes in total solar irradiance, volcanic emissions, and ENSO. One would know that by reading the pre-print, not by watching Beckwith’s video.
This illustrates why it’s better to read the pre-print itself and, secondarily, what its authors say outside the pre-print, instead of relying on a video from Beckwith. If you really want a secondary source on the subject, then there’s a PubPeer thread discussing the pre-print and what the pre-print’s authors have said:
https://pubpeer.com/publications/973ABFB81F504E8CB1B50E941CF3F7
Thanks Atomsk, that’s very helpful.
The other point I tried to make is that clicks rather than accuracy bring people forward in searches. A friend suggests using google scholar. I’ve switched to Duckduckgo, and if I have to get stuff they exclude (admirable but not always what I want), I follow it with -ai to avoid getting a chatty bot on top.
Happy to help. I also wanted to ask if you agree this source projects 2°C by approximately 2048, if the current rate of warming continues:
I’m open to answers from anyone else as well. I’m asking to check if I’m misreading that source, given those trolling about it on here.
Reply to Pete Best Please beware. This is misleading info by Paul B.
The Table Data shown the first 5 minutes is not from the FosterRahmstorf paper! That Table is an extrapolation to +4C by Leon Simons with a starting basis using the estimated >> warming rates of the last decade listed in Table 1 and year to cross 1.5◦C, for each data set. <<.
See the link to the paper in more info –
Preprint of Scientific Paper: Global Warming has Accelerated Significantly
Look for Table 1.
https://assets-eu.researchsquare.com/files/rs-6079807/v1_covered_209e5182-d9a5-4305-a4e0-70204151d2b3.pdf
Unfortunately individuals misrepresenting others output has become too common today extending beyond only “climate deniers”.
PS
Unfortunately, misrepresentation of sources — including around IPCC-related thresholds and crossing points — has become increasingly common. It’s important to keep attribution precise.
“Follow the trend”
…until the trend misbehaves.
Unrelated references remain irrelevant, no matter how often they are repeated. If a citation does not address the specific definition or methodological point under discussion, it adds nothing.
addendum
A quick note on statistical thresholds: the “95% confidence” standard is a useful safeguard in scientific methodology, but it can sometimes obscure meaningful trends in the real world. A rate of warming can be physically significant and clearly observable across multiple indicators even if a strict 95% test has not yet been formally passed.
This is why system-level assessments, like Forster et al. (IGCC 2024/2025), complement method-focused papers — they provide a more holistic view that aligns with observed changes in the climate system.
Similarly, Zeke Hausfather’s The great acceleration debate – Why the consilience of evidence points toward acceleration; Jul 01, 2025 does the same.
https://www.theclimatebrink.com/p/the-great-acceleration-debate
As does many of Jim Hansen’s articles offer a much broader holistic approach, such as:
https://jimehansen.substack.com/p/global-temperature-in-2025-2026-2027
and https://www.columbia.edu/~jeh1/mailings/2025/ForestTrees.06August2025.pdf
Re: “This is why system-level assessments, like Forster et al. (IGCC 2024/2025)“
Best for folks not to believe disinforming sockpuppet accounts that pretend papers are not peer reviewed when they actually were peer reviewed. If sockpuppets can’t even get basic facts about a paper right, then they should not be trusted in their evaluation of the paper’s contents.
https://www.theclimatebrink.com/p/the-great-acceleration-debate?utm_campaign=post&utm_medium=web
As mr Beckwith isn’t to anyone liking here (the sentinels of true climate science) I’ll post this instead which still signals an acceleration in decadal warming – 0.25-0.35.
https://www.researchgate.net/publication/389855619_Global_Warming_has_Accelerated_Significantly
I believe this has been discussed here as well as at Tamino’s (aka Grant Foster).
I note the entrance of Kevin Trenberth and recommendations from Andrew Dessler in your link. Good stuff, though when it comes to real science and analysis, I’m an outsider.
Two points.
First, that link contradicts the video you cited from Beckwith, since its warming trend is lower than Beckwith’s.
https://www.realclimate.org/index.php/archives/2025/12/1-5oc-and-all-that/#comment-843524
Second, you’re citing its global surface warming trend, but the link does not show statistically significant acceleration of global surface warming for reasons gone over before (ex: use of broken trends, not correcting for multiple comparisons). It admits this, consistent with what I’ve said before:
The link instead tries to use independent lines of evidence to suggest accelerated warming of the overall climate system (ex: ocean heat content, surface temperatures, energy imbalance, expectations from models). That’s alright to do, but it’s not the same as showing statistically significant acceleration of global surface warming.
I think this was always the wrong choice of threshold. Instead of keeping global warming to a certain amount above pre-industrial, it should have been to keep it within the temperature limits of the Holocene. Global human civilisation knows how to live within this range of climate. I know we’ve already exceeded this range but I think it might have had more urgency in the public’s mind if it had been framed as keeping within (or returning to) the safe range of climate that we know supports global civilisation. That would have been very clear even to people who know nothing about climate science. Anything else carries increasingly uncertain risks and is irresponsible and reckless.
How much warming when FF aerosol cooling is accounted for? I’ve seen estimates of between 0.2 C to 0.9 C more than measured temperatures..
I do think that any pronouncements on global average temperatures should include mention of that caveat as standard practice because the enhanced GH effect for higher temperatures is already locked in place. I urge climate scientists, activist or not, to make that clear,
Stopping the fossil fuel burning won’t stop those higher temperatures but stopping the fossil fuel burning will stop that cooling influence. But – shouldn’t need to say it – keeping the FF’s for the aerosols is a losing game, somewhat reminiscent of Zeno’s Archilles vs the tortoise race.
Posting this separately to avoid being lost in the noise of a long thread of other replies.
Reply to Atomsk’s Sanakan et al 10 Jan 2026 at 5:12 PM
https://www.realclimate.org/index.php/archives/2025/12/1-5oc-and-all-that/#comment-843749
Re: Data says
10 Jan 2026 at 12:10 AM
“By contrast, Forster et al. (IGCC 2024/2025) https://essd.copernicus.org/articles/17/2641/2025/ — is a state-of-the-system assessment: it integrates multiple lines of evidence — global surface temperatures, ocean heat content, Earth’s energy imbalance, and human-attributed warming — to provide a reality-facing view of acceleration in the climate system. This is the paper that is fit for purpose if we want to understand whether the rate of warming is truly increasing.“
https://www.realclimate.org/index.php/archives/2025/12/1-5oc-and-all-that/#comment-843712
A’sS says
“Yet
a sockpuppet accountpretended that paper was not peer-reviewed, showing themselves to be an untrustworthy disinformer. Oh well.About what Data said-way back in the DEC UV thread: “Atomsk offers a mix of non-peer-reviewed “references” — Forster 2025, Copernicus, Carbon Brief, ERA5 —”
Data responds: Reaching. But desperate is as desperate does. The discussion context already proves, beyond all doubt, what is obviously just an accidental TYPO.
Given I specifically above and elsewhere I made discernible separate comments about papers by Forster vs Foster.
” Sorry Guv’nah. No thought crime here to report!”
After never ‘landing a finger’ a wiser person, as opposed to an opportunistic verbose troll, would just give up.
My References:
Data says 1 Jan 2026 at 10:45 PM
Allow me to summarize and hopefully put this to bed once and for all.
Last month, I wrote to Atomsk’s Sanakan: “~2°C by 2045-2050 is blatantly false and unfounded.”
Context here: https://www.realclimate.org/index.php/archives/2025/12/unforced-variations-dec-2025/#comment-843073
and where A’sS said: “Simultaneously, he claims: the German Physical Society (DPG) and the German Meteorological Society (DMG) are cherry-picking a small number of CMIP6 models known to overestimate warming, including up to 2025 — and if those models are too warm in 2025, they will also be too warm for 2050.”
Which is also patently false, unproven and unfounded distortion of that research.
SEE my comment in full: https://www.realclimate.org/index.php/archives/2025/12/unforced-variations-dec-2025/#comment-843357
Again proving that:
1) It is hard to discuss anything with anyone who has not read, or has not understood, what the individual references actually mean beyond the misleading rhetoric that accompanies them.
2) Brandolini’s Law prevails: the amount of energy needed to refute bullshit is an order of magnitude bigger than that needed to produce it.
https://modelthinkers.com/mental-model/bullshit-asymmetry-principle
With the sockpuppet incoherently lashing out after being caught pretending Forster 2025 was not peer-reviewed, it might be interesting to point out other things the sockpuppet pretended about Forster 2025.
Yet they were already shown the projection of 2°C by approximately 2048 given in Forster 2025’s Climate Change Tracker:
No doubt more incoherent lashing out will occur in response to the sockpuppet being caught in another fabrication about Forster 2025.
Right do according to this blog it’s very unlikely CC has accelerated/changed from 0.17C per decade to anything else higher because nothing has been peer reviewed to demonstrate it as yet and the time line hasn’t been long enough.
In addition to this politically exaggerating claims isn’t a good idea because you will be found out and then the skeptics will have a field day. So let’s see what claims from social media climate activists haven’t been born out:
Ice free Arctic by 2010-2020-2030 etc – always a good one
Any others ppl can think of?
One other thing – when do people think carbon emissions will peak globally ?
Pete Best says
12 Jan 2026 at 2:58 AM
Right [SO] according to this blog it’s very unlikely CC has accelerated/changed from 0.17C per decade to anything else higher
D: So you are quitting outright, Submitting, and giving up. Which will further allow the verbose bullying trolls who are presenting false, distorted unscientific data and information here to win over what is supposed to be a climate science based forum and not a Troll Farm of belligerent non-experts.
The scientific data showing a recent acceleration of warming far above 0.17C per decade is massive and undeniable. It is also supported by a huge majority consensus of climate scientists today.
Yet you and the others will allow NON-climate scientist Trolls to say different without a scrap of credible scientific evidence to support them. The real climate science deniers here therefore win the day.
I have no idea what you are talking about. My question is clear, your answer makes no sense to me
Reply to Pete Best
My question is clear, , your answer makes no sense to me
Data:
I did not give an “answer” to your question/s. I ignored them. Is that a clue?
Pete, I spoke to the rest of your comment (and lead up to it), and said what I thought about that, for my own benefit.
If this comment makes no sense either.,, that’s OK too. I come have no expectations. Nor outrage. lol
Data. In your outrage, you appropriated Pete Best’s comment without reading it for sense. Outrage is a great distorter. He seems concerned about understatement, as are you (and I, fwiw).
Reply to Susan Anderson
SA: In your outrage, you appropriated Pete Best’s comment without reading it for sense. Outrage is a great distorter.
D: Check your bearings. Look for the ‘sense’ making. There is outrage coming from me.
LOL
There is NO outrage coming from me.
Only Typos in haste.
Data: “There is outrage coming from me”
Later: “There is NO outrage coming from me. Only Typos in haste.”
If there only was a term about a typo, a slip, so to say, that reveals repressed feelings … ;-)
P.S. And why the haste? 51 posts in 13 days not enough?
I think it was more of a Freudian slip.
Susan: “ Data. In your outrage, you appropriated Pete Best’s comment without reading it”
The poor Multi-troll must be at the end of his rope – exhausted (51 posts in the first 13 days of January), lots of pent-up frustrations of having his ass handed to him by Atomsk, few breaks and only sporadic morale-boosting support from fellow doomers.
So no wonder that he snapped, and lashed out at what in his mind was Pete’s betrayal of the doomer cause:
“Data”: “So you are quitting outright, Submitting, and giving up. Which will further allow the verbose bullying trolls [i.e. non-doomers -P.]] presenting false, distorted unscientific data and information”
Hell hath no fury like a Data scorned.
P.S. That he erupted …. prematurely – probably read too much in the presumed Pete’s capitulation (he isn’t exactly the sharpest knife in a drawer) – makes it more interesting – what does he do now:
1. eats that frog and apologizes to Pete for his attack on him;
2. does not apologize and risk alienating one of the few allies he has left (sock-puppets do not count).
3. takes his oft-used emergency exit – change his name – and then he no longer owes Pete any apology – “It’s not me, it’s some “Data” who wrote it”,
And if somebody point that he is Data – will have Ron R. tell us that it is unfair is to presume, based on the same views and style, that the “new author” is the same old “Data”.
PB: according to this blog it’s very unlikely CC has accelerated/changed from 0.17C per decade to anything else higher because nothing has been peer reviewed to demonstrate it as yet and the time line hasn’t been long enough.
BPL: Didn’t Foster and Rahmstorf have a paper recently that concluded the rate had accelerated to 0.33 K/decade?
But it’s not been peer reviewed according to this blog and hence it’s not valid enough.
That’s the argument here as I read it.
Same as the AMOC won’t collapse/degrade as Stefan has suggested (earlier than generally thought) because well it’s just a video
Reasoning like that really.
Nothing wrong in these assertions but I just wanted people to clarify here that’s how they think it is.
Re: “But it’s not been peer reviewed according to this blog and hence it’s not valid enough.
That’s the argument here as I read it.“
That wasn’t the argument. The argument was that their pre-print said there was not statistically significant acceleration of the global temperature trend. There’s a predetermined threshold of >95%, or p < 0.05, for statistical significance to reduce the chance of prematurely jumping to the conclusion of acceleration (i.e. to reduce the chance of falling for a false positive).
The pre-print said there was instead statistically significant acceleration of the trend that's left over after removing the impact of changes in total solar irradiance, volcanic emissions, and ENSO (i.e. the adjusted trend). That's not the same as saying there's statistically significant global warming acceleration, since those non-anthropogenic factors are as much a part of the global temperature trend as anthropogenic factors are. For example, reduced total solar irradiance has a global cooling effect. So the pre-print's title "Global Warming has Accelerated Significantly” is misleading, as explained in more detail at the pre-print’s PubPeer thread.
You received the evidence you asked for on this. So it’s surprising to see you still mischaracterize the argument in a manner that seemingly disregards the evidence you were cited. Moreover, the argument was affirmed by a Climate Brink article you cited from Dr. Zeke Hausfather, as I pointed out to you.
So again:
Atomsk’s Sanakan 18 Jan 2026 at 4:08 PM states:
(quoting) : The argument was that their pre-print said there was not statistically significant acceleration of the global temperature trend. There’s a predetermined threshold of >95%, or p < 0.05, for statistical significance to reduce the chance of prematurely jumping to the conclusion of acceleration (i.e. to reduce the chance of falling for a false positive).
The pre-print said there was instead statistically significant acceleration of the trend that’s left over after removing the impact of changes in total solar irradiance, volcanic emissions, and ENSO (i.e. the adjusted trend). ………. and
You received the evidence you asked for on this. So it’s surprising to see you still mischaracterize the argument ……. “ plus some repeated references
DATA:
The (non) argument persists only because someone insists on turning statistical caution into a veto on physical inference. That’s not science. That’s performative scepticism inside the tent.
One sentence puts an end to this distortion of real science:
Failure to detect acceleration at an arbitrary confidence threshold over short, noisy windows does not contradict increasing warming rates inferred from physical forcing, trend comparisons, and model-consistent projections.
Doing so does not equate to prematurely jumping to the conclusion of acceleration. This isn’t confusion about “an argument” anymore — it’s bad faith repetition disguised as rigour. This isn’t about “to reduce the chance of falling for a false positive” but rhetoric emphasising “false negatives.”
So the correct framing is not: “Beaulieu and Foster show there is no acceleration” but that: “Beaulieu and Foster shows that acceleration is not detectable at high confidence over a very short, noisy window.”
That’s it. Full stop. No argument. Using these papers as a veto against physical interpretation, projections, or longer-context trend comparisons is simply misuse.
More Context for the Record:
These rhetorical distortions have been coming since November and before:
Atomsk’s Sanakan says (21 Nov 2025 at 11:31 AM): To Geoff Miell
“This isn’t a question of policy. It’s a question of statistical significance in science.”
https://www.realclimate.org/index.php/archives/2025/11/unforced-variations-nov-2025/#comment-842265
A’sS has been treating Foster’s adjusted vs unadjusted trends as a moral issue. When Adjustment is not fraud. It is done when the question is: What is the underlying forced warming rate?
A’sS pretends: adjusted = cherry-picking and unadjusted = reality. That’s not statistics — it’s rhetoric.
For one, it is correct to notice: the numerical difference between the two trends is tiny (order 0.01–0.02 °C/decade over recent windows). So the emotional weight he puts on this is wildly disproportionate to its physical impact.
Then A’sS ongoing Authority shopping is the tell he’s running on rhetorical emotion, not on the guard rails of Science.
A Key point: Removing ENSO, volcanic aerosols, and solar variability does not invent warming — it reduces variance so you can see the underlying signal.
The fact that: adjusted ≈ unadjusted is evidence of robustness, not weakness!
A’sS is treating ‘adjustment’ as if it were an admission of guilt. It’s actually standard signal-to-noise handling within Science and therefore valid and useful.
NEXT Forster’s 2024 climate review position is internally consistent (A’sS just slices it)
I and others are right that Forster’s views, taken as a whole, align with:
Recent warming rates ≈ 0.27–0.30 °C/decade
Likely near-term peaks ≈ 0.33 °C/decade
Strong role of ENSO amplification in 2023–24
No robust detection yet of acceleration at strict CI thresholds
Post-1970 warming rate was ~0.17C-0.19C up to 2010.
There is no contradiction there. To view these repeated assertions as an “irrelevant overstated beat-up” is not dismissive — it’s scientifically accurate.
Because:
The numerical differences are trivial
The methodological choices are standard
The statistical non-detection is expected over the short-term periods used
The physical trend increase (accelerating rate) is evident
The projections are consistent
A defensible description of what is being done here is operating with epistemic rigidity.
He treats statistical thresholds as vetoes
He defends that stance aggressively
He responds to perceived threats to authority
He uses repetition and narrowing tactics
He avoids open engagement where the frame might shift
What a “95% confidence level” actually means (and what it does not mean)
In frequentist statistics (which is what AS is invoking, whether explicitly or not), a 95% confidence interval means:
“If we repeated this exact procedure infinitely many times on data generated by the same process, 95% of the resulting intervals would contain the true parameter value.”
That’s it. It does not mean:
There is a 95% probability the hypothesis is true.
We are 95% confident warming is accelerating.
Nature itself recognizes 95% as a magic boundary.
Because the percentage refers to the procedure, not to reality.
Because it is absolutely true that a CI set at 95% is a human convention, not a statistical law.
So treating “not statistically significant at 95%” as a scientific veto is simply wrong.
Failing a short term 95% CI statistical test does NOT say the warming rate since 2010 has NOT been accelerating. When other credible lines of scientific evidence show beyond doubt the warming rate has been accelerating.
Grant Foster himself confirms this when he projects warming to persist ~0.33C/decade. Significantly above the former 0.17C/decade. Information offered by A’sS and others yet simultaneously minimised in importance and meaning.
Other valid Data and Methods apply to scientifically determine that the Rate of Warming actually is Accelerating post-2010. This is not fringe philosophy — it is standard risk analysis (IPCC WG1 acknowledges this explicitly).
Making misc method choices that are policy-adjacent, especially in high-stakes contexts, is well established in science studies and risk governance. The core conceptual framing I have presented here is solid.
Note:
Richard Feynman’s philosophy of scientific integrity emphasizes that “the first principle is that you must not fool yourself—and you are the easiest person to fool”.
In climate science, this rigor is sometimes compromised by non-scientist activists who, despite supporting pro-climate action, push ideas that misrepresent or go beyond established scientific knowledge and principles.
Additional Information on Richard Feynman and the Difference Between Knowing and Understanding
https://www.realclimate.org/index.php/archives/2025/12/1-5oc-and-all-that/#comment-844113
No need for folks to rely on a sockpuppet account that pretended Forster 2025 wasn’t peer-reviewed.
And whose pretense was meant to avoid acknowledging the projection of 2°C by 2048 in Foster 2025’s Climate Change Tracker.
By now an honest person would have admitted that Foster 2025’s projection of 2°C by 2048 is consistent with “~2°C by 2045-2050“. But honesty isn’t expected of sockpuppet troll accounts.
Atomsk’s Sanakan says 20 Jan 2026 at 7:22 PM
At least the 5th time the same content is being repeated on this page.
A’sS keeps repeating the same claims without addressing the actual evidence I cited.
A’sS has have been repeatedly making false accusations against me–these do not stand because I have refuted every single one made. And will make. The pattern of trolling is obvious and public.
I am not going to continually defend the existence of correct modes of reasoning against people who are indifferent to them.
Ref: “repetition is an essential tool for marketing ideas and propaganda too;”
https://www.realclimate.org/index.php/archives/2026/01/unforced-variations-jan-2026/#comment-844181
Not my fault the sockpuppet disinformed people about global temperature trends and about sources on those trends, while willfully evading rebuttals of their disinformation. Maybe one day they’ll actually give honest, evidence-based answers to the questions they were asked:
1) Is Forster 2025 peer-reviewed?
2) Does Forster 2025’s Climate Change Tracker project 2°C by approximately 2048, if the observed warming trend continues?
3) Is a point projection of 2°C by approximately 2048 consistent with a projection of ~2°C by 2045-2050 based on the observed warming trend?
4) Given the answer to questions 1 through 3, is it wrong to say that it’s “blatantly false and unfounded” to state that extrapolating the observed warming trend supports a projection of ~2°C by 2045-2050?
5) Is a continuation of the observed warming trend from Forster 2025’s Climate Change Tracker consistent with projections of ~1.5°C by around 2030, ~2°C by 2045-2050, ~3°C by 2075-2090, and ~3.5°C by the end of the 21st century for the Paris Agreement’s 20-year mean?
(Hint: the answer to each question is ‘yes’, despite the sockpuppet having repeatedly pretended the answer was ‘no’.)
Pete B: It seems to me you are giving too much weight in some cases and not enough in others. We all do it. It is useful to remember that commenters here are a mixed bag. It seems to me you misread some of the responses about Foster and Rahmstorf and peer review. Taking a broader view, some information is more credible than others, and that paper in particular, it was pointed out, had been misrepresented in the service of exaggeration. This seems fairly straightforward to me and has less to do with the exactitudes of peer review and more to do with the credibility of the unequal elements of the commentariat.
I’d say not giving enough weight considering the past 3 years of what appears to be increased warming. Oh yes it’s not 95% significant only 90% so let’s all forget it until such a time as it’s high enough to be a concern because 90% just us t concerning enough.
Emissions continue to rise and 1.5C comes earlier than predicted. Oh hang on it only just touched 1.5C briefly and only due to an El Niño so it’s not real is it
Pete Best I’d say not giving enough weight considering the past 3 years of what appears to be increased warming.
The post you are responding to was not on “appearances” about but about our use of sources.
And in this thread you seem to cherry pick the information that supports your non-scientific opinions (confirmation bias, anyone?) and refuse acknowledge the criticism of your approach.
Science is not about fuzzy “what appears” to a layman, but what can be objectively quantified.
Typical standard threshold of scientific significance is 95%, hence the acceleration of GW trend is NOT significant yet, And using a 3-year time scale to pronounce on … climatological trends (which are averaged typically over 30 years) is AS WRONG as when the deniers proclaim the end of global warming because the temperate in the cherry-picked 3 years “appeared to them”.
You, by repeating their incorrect approach
– validate it, thus making it more difficult for us to counter the next time they bring back the “hiatus” (they would say: “ but you have made yourself claims about GW based on “the past 3 years”, so why it is wrong when we do it?“)
– if the acceleration is not borne by the future data – the same deniers would use your claims to discredit all climate science (“where is your predicted acceleration now”?)
What was wrong for the denier goose, is also wrong for the doomer gander.
Pete Best, I think you are right in your basic conclusions that global warming has most likely accelerated and this clearly presents a very concerning problem, but you are perhaps misinterpreting things a bit. The discussion on this website on whether global warming has accelerated and whether its statistically significant isnt about the last three years. This is too short a time period to make conclusions about whether the basic trend has changed. Its always unwise to read too much into just three years and assume the trend will continue due to short term natural variation like el nino that can boost warming. Explanations of the 2023 – 2025 warming here:
https://www.carbonbrief.org/analysis-what-are-the-causes-of-recent-record-high-global-temperatures/
The discussions on this website are related to the last couple of decades where its suggested the surface warming trend accelerated starting around 2012. Studies show its LIKELY accelerated but is not proven by the statistical significance test which is quite demanding. AS is just being scientifically correct in his comments.
But a study by F&R posted several times by AS showed that the UNDERLYING AGW trend, when you remove natural variation has accelerated with statistical significance. Suggesting its just a matter of time before the actual surface warming trend accelerates with statistical significance. Because it will break through the natural variation sooner or later.
IMO we already have data that the surface warming trend has ‘likely’ accelerated and the underlying AGW trend has accelerated and this is enough to be very worried. But to claim that we are sure or very certain the surface warming has accelerated is a step too far.
Re: “Right do according to this blog it’s very unlikely CC has accelerated/changed from 0.17C per decade to anything else higher because nothing has been peer reviewed to demonstrate it as yet and the time line hasn’t been long enough.“
Not what I’m saying. I’m saying it hasn’t reached the pre-determined threshold for statistical significance yet. It’s likely acceleration has happened, but it hasn’t reached the threshold for saying it has with statistical confidence. But you’re right to say that more data will change that and cause statistical significance to be reached, likely by 2030, and almost certainly by 2035.
Re: “So let’s see what claims from social media climate activists haven’t been born out“
Killian saying there are studies showing at least a 5% chance of human extinction from climate change. Then Killian failed to cite those studies when asked to and when shown research contradicting their claim.
https://www.realclimate.org/index.php/archives/2025/10/unforced-variations-oct-2025/#comment-840307
https://www.realclimate.org/index.php/archives/2025/10/unforced-variations-oct-2025/#comment-840324
Pete Best: “ according to this blog it’s very unlikely CC has accelerated/changed from 0.17C per decade to anything else higher because nothing has been peer reviewed to demonstrate it as yet and the time line hasn’t been long enough.
Replace your “it’s very unlikely ” with “there is no statistically significant acceleration so far” and you will in the ballpark. Are you accepting it – or registering your objection?
PBest – In addition to this politically exaggerating claims isn’t a good idea because you will be found out and then the skeptics will have a field day. So let’s see what claims from social media climate activists haven’t been born out: Ice free Arctic by 2010-2020-2030 etc – always a good one Any others ppl can think of?
How about:
– “Haven’t you told us that we will be going into the ice age?”
– Haven’t you (Geoff Miell) claimed the exponential growth of SL – adding to 5 m SLR by 2100, and presented Younger Dryas as valid quantitative analogue to such SLR rate (thus ignoring the absence of the major N. hemisphere ice sheets that provided most of the water for those SLR rates)?
– Google: “deniers misrepresenting Hansen’s 1988 model – citing the “business-as-usual” Scenario A (which assumed rapid, uninterrupted emissions) as the consensus prediction and then claim actual warming was much lower.”
– denier “Julian” on RC: “it’s rather annoying reading study after study using RCP8.5 as some sort of a plausible baseline”
– deniers trying to erode support for the CO2 mitigation by promoting the hopelessness and apathy – using people like “Data” and their dismissing renewables, DAC, net zero and climate science by saying that these are merely symptoms of our refusal to accept “irreversibility” of the climate change (if it is irreversible then what’s the point in doing anything, right?)
– deniers using the same all-or-nothing fallacy as the doomers use (as if the world with 500 ppm was as bad as one with 900 ppm ) – see Multi-troll (version “Pedro Prieto”) dismissing existing technological, market, and political ways to slow the CO2 rise in favour of his fundamentalist “solutions”:
– a Global Revolution overthrowing capitalism
– a change in human nature (no longer individualist and no longer interested in consumption)
– a global agreement on the mass deindustrialization
– removal of many billions people (the line of argument already promoted by Dan Brown’s “Inferno”, movie “Kingsman: The Secret Service”, and reflected in the conspiracies of COVID as a tool to depopulate Earth to the environmentally sustainable levels)
or combination of the above
– add to this Multi-troll putting China as an example for the West as the model of effective government and taking the side of Russia in its invasion of Ukraine
– with the above deniers can say : – “See? All these warmists are Marxists and/or fanatics who would not hesitate to exterminate many billions of people”
– deniers using Multi-troll’s, Killian’s, and other doomers attacks on the credibility of IPCC and climate science (“ See? Even the warmists themselves do not trust IPCC” )
– Killian implying that we have to abandon all modern agriculture in favour of the regenerative agriculture – without proving that it can deliver the same global amount of food
-Killian suggesting that we would need reduce the overall population, and move people from consumption-obsessed cities to regenerative agriculture in the country (echos of the Chinese Cultural Revolution and Pol Pot resettling city inhabitants into the rural areas resulting in the largest (?) per capita mass genocide in human history)
So yes, Pete – doomers choosing the worst possible scenario – not only are not intellectually honest, but the result of this is opposite to the stated goal – INSTEAD mobilization of the people to mitigate AGW, they sow hopelessness and apathy
– by using all or nothing fallacy – where the “all” requires unimaginable sacrifices – will not mobilize people to action as you envision, but the very opposite – dishearten them (you can get to the top of building using the small steps on the staircase – you won’t even try if you are asked to do it in a single giant leap) and therefore – drive them to apathy (“ if it is irreversible – then what’s the point – let’s enjoy our consumption while we can“).
And if their extreme, therefore unlikely to happen scenarios, do not pan out – these claims have been, are or will be, used by the deniers to discredit by association- IPCC and climate science.
(the boy who cried: “Wolf!”)
The road to hell is paved with noble intentions.
replace your “it’s very unlikely ” with “there is no statistically significant acceleration so far” and you will in the ballpark. Are you accepting it – or registering your objection?
I disagree that it isnt statistically significant otherwise why write the paper.
It is like the concentrations of Co2 in the atmophere have accelerated to 3.75 (google AI) or 3.58 (Met office – https://www.eco-business.com/news/met-office-atmospheric-co2-rise-now-exceeding-ipcc-15c-pathways/#:~:text=With%20the%20El%20Ni%C3%B1o%20now,the%20effects%20of%20La%20Ni%C3%B1a.) ppmv in recent years. shoirt terms or statistically significant.
I can undersatand that all of it is short term but we await more years of data to confirm if it is 95% or not. The past 3 years have no been seen in the records of climate change not has the increases annually in CO2 emissions either.
I am for it being statistically significant.
They wrote the pre-print to say the trend after removing the impact of changes in total solar irradiance, ENSO, and volcanic emissions is statistically significant. There’s not statistically significant acceleration when the impact of those factors is included, as the pre-print states; there’s not been statistically significant acceleration of the global temperature trend.
You’ve been shown this before, including after you asked for evidence. So I don’t get why you’re still denying it.
https://www.realclimate.org/index.php/archives/2025/12/1-5oc-and-all-that/#comment-844047
I am not denying anything, i am telling you its significant along with the amount of CO2 in the artmosphere which has also risen higher than the 2 ppmv it usally is to 3.5 ppmv. Couple that with the past 3 years of warming and it is concerning!
Warming faster, cO2 rising faster even though emissions arnt so much.
Keep on downplaying it though if you want to.
AS: You’ve been shown this before, including after you asked for evidence. So I don’t get why you’re still denying it.
BPL: Because he’s a troll. He’s here to waste peoples’ time and create noise to interfere with the climate science signal.
Re: “I am not denying anything, i am telling you its significant“
You’re denying that it’s not statistically significant:
– “I disagree that it isnt statistically significant”
– “I am for it being statistically significant.”
You also said:
– “Couple that with the past 3 years of warming and it is concerning!”
– “Keep on downplaying it though if you want to.”
But statistical significance is not a matter of “downplaying“, or of what’s “concerning“, or of what you’re “for“. It’s instead about the results of a statistical test. Both sources you cited explained the global surface temperature trend does not pass the predetermined threshold for statistical significance. I’ve listed those sources for you again at the end of this comment (Hausfather on The Climate Brink, Rahmstorf/Foster pre-print).
You seem to reject that answer because it doesn’t fit your preferred conclusion on the global temperature trend. But that’s one of the points of statistical tests: to give an answer that applies regardless of one’s biased, subjective preferences about the data. So these tests for statistical significance would give the same results if instead of this being data about global temperature, it was instead data about stock prices or the number of seashells on a beach. To say otherwise is a double-standard that treats climate data differently from other sorts of data in order to reach a preferred conclusion. Such a double-standard caused many to incorrectly claim a post-1998 deceleration of the global temperature trend (ex: Lewandowsky 2011, Hardy 2017 / Jamieson 2014, Kahan 2017).
So: whether global warming is concerning/harmful should not impact the results of a statistical test. And whether global warming is harmful/concerning doesn’t hinge on whether it passes tests for statistically significant acceleration. You thus don’t need to co-opt the concept of ‘statistically significant acceleration’ to voice your concerns about global warming. Otherwise, you’re incorrectly approaching a statistical question like it’s a policy/emotional question regarding how one feels about global warming.
Atomsk’s Sanakan says 20 Jan 2026 at 7:04 PM — repeating it across hundreds of times beforehand.
What we are seeing is not inquiry, not dialogue, not science but performative epistemology.
https://www.realclimate.org/index.php/archives/2026/01/unforced-variations-jan-2026/#comment-843658
see Bruno Latour https://publish.obsidian.md/sandtesting/Sandtesting/Sandtesting/Sandbox/Philosophie/Epistemology/performative+epistemology
Repeatedly throwing a wall of posts containing dozens of unexplained unrelated ‘sciency’ references at a forum won’t help anyone.
It’s what trolls typically do to obscure, disarm, disrupt and disinform. Intending to wear their interlocutors down under a barrage of unrelenting meaningless verbiage aka “forum noise”
It is impossible to discuss anything with those who have not understood the true contextual scientific meaning of the references (beyond the misleading rhetoric that accompanies them).
Follow the evidence:
The core ideas I have presented are fundamental — that’s the key scientific reassurance! Strip away the personal references, the repetition, and what remains are deep, transferable principles:
Statistical non-detection ≠ physical absence
CI thresholds are conventions, not ontological truths
Risk asymmetry matters in climate contexts
Adjustment is signal clarification, not fraud
Treating statistical thresholds as vetoes is epistemic error
Confusing conventions with laws breeds public misunderstanding
That’s it. Right there. In a nutshell. And, Richard Feynman would agree.
https://www.realclimate.org/index.php/archives/2025/12/1-5oc-and-all-that/#comment-844143
DATA:
The (non) argument persists only because someone insists on turning statistical caution into a veto on physical inference. That’s not science. That’s performative scepticism inside the tent.
Richard Feynman’s philosophy of scientific integrity emphasizes that “the first principle is that you must not fool yourself—and you are the easiest person to fool”.
https://www.realclimate.org/index.php/archives/2025/12/1-5oc-and-all-that/#comment-844140
Some folks just are not credible in their evaluations of global temperature trends and of published sources on those trends. For example, sockpuppet accounts that pretend Forster 2025 wasn’t peer-reviewed.
And whose pretense was meant to avoid acknowledging that a projection of 2°C by approximately 2048 in Foster 2025’s Climate Change Tracker was consistent with ~2°C by 2045-2050.
Those who refuse to be honest about sources and trends should be disregarded when sources and trends are discussed.
Pete Best “ I disagree that it isnt statistically significant otherwise why write the paper.”
So in your logic …. the relationship must be statistically significant because otherwise the author …. would not open his pre-print for comments?
And again, as Atomsk has REPEATEDLY explained to you and other doomers,
who either do not understand what you read (you) , or deliberately misrepresent by (multitroll “Data”) – you conflate two different things – the observed GW trend with the GW trend after subtraction on non-human drivers. They are NOT the same and significance in one does not prove the significance of the other.
Then you make your claims about CLIMATE change (trends existing after averaging over 30 years) based on … 3 years of data. Which is scientifically as justified as deniers using different 3 years to claim the end of GW. By doing the same what deniers do – you shield them for the criticism – they can say: “but your side used a 3-year period too” meaning that the climate scientists are no better than them, but actually worse (they hypocrites).
PBest: “I can undersatand that all of it is short term but we await more years of data to confirm if it is 95% or not”
Again you putting the cart in front of the horse – if it is significant by then – then nobody will have a problem with saying that. Until then – you are doing more harm than good –
you play straight into the deniers hands – who use the doomers to try to discredit climate science by association with the doomers who do exactly what the deniers have been doing for years -talking about the climatological trends (slope averaged over 30 years) based on the cherry-picked few years to support their a-priori conclusion.
And by doing the same as them – not only your normalize their behaviour, but also shield them from criticisms by climate scientists – deniers would turn around: “ but your side had no problems with using a cherry-picked 3 year period when it fit your narrative “.
So not only you are no better than us, you are actually worse (since you are hypocrites).
And you help the deniers to advance their the post-truth framing – that there is no objective truth, only conflicting subjective opinions , reflective of the economic, ideological and psychological needs of a given special-interest group.
And if so – then the scientists have no more claim to understand the world than are deniers – because in this framing “ you scientists are just another special-interest group, as you have proven when you ignored your own scientific standards, when you declared significant acceleration of the GW trend based on a 3-year period, cherry-picked to support your ideologically-driven narrative, while attacking us us for what you do yourself.
Reply to Piotr and Pete
Why to continually defend the existence of correct modes of reasoning against people who are indifferent to them?
Choosing 95% instead of 90% or 97.5% is a policy choice — not a Scientific choice, but merely a convenient choice for standardization by bureaucrats.
Therefore the quote: “This isn’t a question of policy. It’s a question of statistical significance in science.” — is categorically incorrect.
The core ideas I have presented are fundamental — that’s the key scientific reassurance! Strip away the personal references, the repetition, and what remains are deep, transferable principles:
Statistical non-detection ≠ physical absence
CI thresholds are conventions, not ontological truths
Risk asymmetry matters in climate contexts
Adjustment is signal clarification, not fraud
Treating statistical thresholds as vetoes is epistemic error
Confusing conventions with laws breeds public misunderstanding
That’s it. Right there. In a nutshell. And, Richard Feynman would agree.
This is not fringe philosophy — it is standard risk analysis (IPCC WG1 acknowledges this explicitly). Making misc method choices that are policy-adjacent, especially in high-stakes contexts, is well established in science studies and risk governance. The core conceptual framing I have presented is solid.
Making faux claims to being a “moderate” is unsupported by the evidence when pushing unreasonable unscientific views.
References incl: This is exactly how gullibility and misunderstandings about Climate Science is manufactured in the public observer. That is not science it is rhetoric.
https://www.realclimate.org/index.php/archives/2026/01/unforced-variations-jan-2026/#comment-844103
https://www.realclimate.org/index.php/archives/2026/01/unforced-variations-jan-2026/#comment-844107
https://www.realclimate.org/index.php/archives/2025/12/1-5oc-and-all-that/#comment-844140
https://www.realclimate.org/index.php/archives/2025/12/1-5oc-and-all-that/#comment-844113
================================
Reply to Barton Paul Levenson
20 Jan 2026 at 9:37 AM
20 Jan 2026 at 9:35 AM
BPL: Because (PETE BEST’s) a troll. He’s here to waste peoples’ time and create noise to interfere with the climate science signal.
BPL: It’s not a matter of individual belief. By the proper statistical techniques, it’s not significant. Live with it.
DATA: Legitimate questioning do not a Troll make.
Geez, you really are a man of science and no imagination about the consequences of CC other than the facts and the data.
Everything is going in the wrong direction. Presently. Emissions and co2 build up in the atmosphere are increasing (emissions arnt increasing too much atm so hopefully they will peak soon) but hey let’s just await another IPCC report before anyone other than China is concerned enough to do anything about it eh because the facts arnt strong enough yet.
Let’s just sit on our hands and await 95% certainty and higher 2C warming before events are so serious before they get noticed. Let’s just keep on plugging away and eventually someone’s going to notice and say hey this is serious !
Let’s await more science because as yet we haven’t managed to convince enough ppl
D: Choosing 95% instead of 90% or 97.5% is a policy choice — not a Scientific choice, but merely a convenient choice for standardization by bureaucrats.
BPL: Not by bureaucrats. By scientists. And people picking the level of significance they want to say the trend they want has been found is exactly why there’s a standard.
Data says: “Choosing 95% instead of 90% or 97.5% is a policy choice — not a Scientific choice, but merely a convenient choice for standardization by bureaucrats.”
That statement is very misleading. While the choice of 95% for statistical significance does not flow directly in some way from maths or physics and is a choice made by scientists, it is not a convenient choice for mass standardization by bureaucrats.
It’s a choice that has been adopted by the scientific community because it is conservative. It sets a high bar to determine that some event is highly certain to be happening. This helps avoid claims that some event is happening that later turn out to be “false positives”. This is very easily googled. Its nothing to do with bureaucrats.
It doesn’t mean that if some event isn’t proven with 95% statistical significance that there is zero chance some event happening. An event could be happening with a moderate degree of certainty at less than 95% significance. And that could be a very good reason to take action to influence the event.
My own words. Not copied and pasted AI output like some other people mix in with their own comments.
PB: I am for it being statistically significant.
BPL: It’s not a matter of individual belief. By the proper statistical techniques, it’s not significant. Live with it.
It is significant, just not significant enough for you by the looks of it.
90% likely, 95% very likely
Reply to Barton Paul Levenson; Piotr; Atomsk’s Sanakan; Geoff Miell; Pete Best et al
Useful tools, including the Statistical significance tests, are not the supreme scientific determinate of anything. The Physics is.
Grant Foster and Stefan Rahmstorf 2025 state in their paper: “The most important insight from these adjusted data is that there is no longer any doubt regarding a recent increase in the warming rate.”
This finding and many others have been ignored, distorted, dismissed and minimized for several months now on Real Climate. While simultaneously it has been repeatedly overlooked and not stated clearly the Beaulieu et al., 2024 statistical significance analysis is constrained to a very short 12 year period only.
Consider then Feynman’s core ethical stance (a summary):
The reward in science is the joy of discovery and the knowledge that others can use it. Honors and status rituals are corrosive because they shift the goal from truth to belonging. The integrity of science requires reporting the full story — including what contradicts your preferred conclusion — and resisting the temptation to protect a tribe.
It’s not that Feynman is famous — it’s that he embodies a scientific ethos you can actually apply in your own thinking and communications. This is the kind of scientific practice I keep referring to. This is what I’m seeking. This is what I’m not seeing.
Don’t like to hear what I’m saying? Fine, then maybe listen to ‘Skeptical Science’ instead; it’s old news: How significance tests are misused in climate science
Posted on 12 November 2010 by Dr Maarten H. P. Ambaum from the Department of Meteorology, University of Reading, U.K.
However many climate scientists have shot themselves in the foot by publishing low values of p(M|N) (in statistical parlance, low p(M|N) means a “statistically significant result”) and claiming that this is positive evidence that p(N|M) is low. Not so.
We can make some progress though. Bayes’ theorem shows how the two probabilities are related. The aforementioned paper shows in detail how this works. It also shows how significance tests can be used; typically to debunk false hypotheses. These aspects may be the subject of a further post.
In the meantime, we need to live with the fact that “statistically significant” results are not necessarily in any relevant sense significant. This doesn’t mean that those results are false or irrelevant. It just means that the significance test does not provide a way of quantifying the validity of some hypothesis.
So next time someone shows you a “statistically significant” result, do tell them: “I don’t care how low your p-value is. Show me the physics and tell me the size of the effect. Then we can discuss whether your hypothesis makes sense.” Stop quibbling about meaningless statistical smoke and mirrors.
https://skepticalscience.com/How-significance-tests-are-misused-in-climate-science.html
This conclusion about the misuse of Statistics operates in both directions.
Data @ 21 Jan 2026 at 5:27 PM
Data: “Reply to Barton Paul Levenson; Piotr; Atomsk’s Sanakan; Geoff Miell; Pete Best et al. Useful tools, including the Statistical significance tests, are not the supreme scientific determinate of anything. The Physics is.”
Thanks for the lecture but who here has claimed that statistical significance tests are a supreme scientific determinant?
Data: “Grant Foster and Stefan Rahmstorf 2025 state in their paper: “The most important insight from these adjusted data is that there is no longer any doubt regarding a recent increase in the warming rate.”This finding and many others have been ignored, distorted, dismissed and minimized for several months now on Real Climate.
Again who specifically has done the ignoring and distorting? I don’t know of anyone here who has done that. AS has several times posted the F&R paper and mentioned that the adjusted data shows a statistically significant increase in warming and it is important for reasons xyz. He has also several times said that despite the surface warming not achieving statistical significance there is still reason to mitigate the climate problem at a policy level. Hes also said that its important not to exaggerate as it feeds the denialists. You even responded to at least one of those posts. Cant you read?
Data: “While simultaneously it has been repeatedly overlooked and not stated clearly the Beaulieu et al., 2024 statistical significance analysis is constrained to a very short 12 year period only.”
So what? This just means that its likely there will soon be enough data to have a firmer idea of things.
Data: “Don’t like to hear what I’m saying? Fine, then maybe listen to ‘Skeptical Science’ instead; it’s old news: How significance tests are misused in climate science Posted on 12 November 2010 by Dr Maarten H. P. Ambaum from the Department of Meteorology, University of Reading, U.K.”
Its a critique. Maybe its right, maybe its wrong. Some scientists also say 95% is too high. Maybe they are correct, but right now the standard statistical significance test is 95%.
D: see Bruno Latour
BPL: Oh, God. Data is a deconstructionist.
BPL: Oh, God. Data is a deconstructionist.
?
OMG Spoken like a Christian would say it.
They don’t require any evidence for their outrageous opinions or beliefs. But thanks for sharing how you think.
This was quite funny. @ https://www.realclimate.org/index.php/archives/2025/12/1-5oc-and-all-that/#comment-843835
Barton Paul Levenson says 13 Jan 2026 at 8:59 AM
KW: . I am asking which is the best climate?
BPL: The climate as close as possible to the one all our agriculture and civilization grew up under. For that, mean global annual surface temperature should be close to 287 K.
Data says:
The best climate is the one that’s here now. You do not get a choice. It’s not a “Sale of the Century” tv show.
While, different GMSTs metrics do not a Climate make. Category Error.
D: The best climate is the one that’s here now.
BPL: No, that’s the present climate. The best climate for our civilization is the one we had 200 years ago. You are redefining what “best” means. People can’t communicate if they change the meaning of words to suit individual preference.
Reply to Barton Paul Levenson
“The best climate for our civilization is the one we had 200 years ago.”
Which is your subjective personal opinion.
Yes BPL, “best” is a fundamentally subjective term because it describes a superlative based on personal opinions, feelings, preferences, or specific, unstated criteria, rather than an objective, universal fact.
While an objective measure could make something “best” (e.g., highest score), “best” for an individual depends on unique needs and values, making it inherently personal and open to debate.
Can not even work out the question itself (I am asking which is the best climate?) is unscientific ie Undefined by default?
BPL: “People can’t communicate if they change the meaning of words to suit individual preference.”
DATA: Then stop doing it yourself.
BPL: “People can’t communicate if they change the meaning of words to suit individual preference.”
DATA: Then stop doing it yourself.
BPL: I wonder if Data is a Republican. This is a constant GOP tactic–accuse your opponent of whatever they accuse you of. Admit nothing, deny everything, make counter-accusations.
I did know Feynman. He had a great sense of humor.
These arguments (almost all parties) don’t. That’s just dumb.
—
elsewhere: No, data is not right wing. He thinks he supports James Hansen, but like many Bernie Sanders supporters, he gets into a state of mind overstating his case on Hansen’s work. Berniebusters are like Hansenbusters, they don’t see that they are driving people away from Hansen’s excellent work.
He means well, as do you and many others. But serial insider arguments make most people want to go elsewhere.
—
Our mods are too busy to pay much attention outside removing the true nasties. Hence the awful proliferation.
BPL: The best climate for our civilization is the one we had 200 years ago.”
Data: Which is your subjective personal opinion.
Nigelj: Not really. BPL is obviously referring to the science based view that the period over the last 11,000 years or so but excluding the modern global warming period, is best for humanity because the climate was relatively stable and all our farming and other systems are adapted to that climate and have thrived under that climate.
https://anthroholic.com/holocene-epoch
Data says: “The best climate is the one that’s here now. You do not get a choice. It’s not a “Sale of the Century” tv show.”
What on earth does this even mean? Isnt our present “climate” a result of our CHOICE to burn fossil fuels and to continue to burn substantial amounts, even while we know the implication? But we have also CHOSEN to adopt renewables to a growing extent.
Feynman, CMIP6, and the Difference Between Knowing and Understanding
(Feynman applied to climate models, ensemble means, and “skill”)
Richard Feynman made a distinction that feels uncomfortably relevant to modern climate modeling.
He pointed out that two theories can look completely different, rest on very different ideas, and yet produce exactly the same experimental consequences. If that happens, science has no way to choose between them on the basis of output alone. Agreement with experiment, by itself, is not a discriminator.
That matters for CMIP6.
1. Same Output ≠ Same Understanding
In CMIP6, multiple independent models — built with different parameterizations, tunings, and internal representations — arrive at similar global mean surface temperature (GMST) outcomes. Close enough, at least, to be judged “successful.”
But internally, those same models can diverge sharply on:
sea ice evolution
ice sheet dynamics
cloud feedbacks and humidity
ocean heat uptake and vertical mixing
ENSO behavior
regional circulation, winds, and extremes
So we are left with models that are equivalent in one output metric, but not equivalent in structure, mechanisms, or implications. Feynman’s point applies directly here: Science cannot choose between theories based solely on matching output.
2. Equivalent Output Does Not Mean Equivalent Skill
This is where the word skill deserves scrutiny.
If two models reproduce GMST but do so for different internal reasons, then they may be:
equivalent in output,
but not equivalent in usefulness,
not equivalent in explanatory power,
and not equivalent in predictive robustness outside the calibration regime.
Calling this “skillful” risks collapsing an important distinction:
Numerical agreement is not the same thing as understanding the system.
3. Why Frameworks Matter (Not Just Results)
Feynman emphasized that theories are not just calculators — they are ways of thinking.
A framework matters because it determines:
what changes look “natural” to explore,
how we generalize beyond existing data,
how we reason under new conditions.
This is why good scientists do not cling to a single formulation. As Feynman put it, competent theorists keep multiple representations of the same physics in their heads, precisely because different frameworks suggest different guesses.
Yes — guessing is part of science. But it is constrained guessing, guided simultaneously by:
physical laws,
empirical reality,
and conceptual coherence.
Not by blind adherence to statistical output alone.
4. The Ensemble Mean Problem
The ensemble mean can be useful — but it is not a philosophical solution.
Averaging across models that agree in GMST but disagree elsewhere does not magically resolve underlying uncertainty. It can just as easily hide structural disagreement as illuminate robustness.
If the models differ fundamentally in how they move heat, water, momentum, or energy through the system, then the ensemble mean is not “the truth” — it is a statistical artifact.
Feynman would warn us here: don’t mistake bookkeeping for understanding.
5. The Mayan Warning (Still Relevant)
Feynman’s Mayan astronomer example makes this sharp.
The Mayans predicted eclipses extremely well — better than early physical models. But their arithmetic scheme had no underlying explanation of what the Moon was or how it moved. Precision alone did not equal insight.
Likewise, a climate model can match a headline metric and still be conceptually incomplete — or even misleading — about the system it represents.
Bottom Line
Feynman’s point is not merely philosophical; it is a scientific warning:
Agreement with data does not equal understanding.
CMIP6 models matching GMST is an achievement — but it is not the end of the epistemic story. The real question is not whether models agree on one output, but why they do — and whether their internal logic genuinely reflects the physical climate system.
That distinction matters, especially when we ask models to guide extrapolation, attribution, and future risk.
—
Extracts from : Feynman: Knowing versus Understanding
“Every theoretical physicist that’s any good knows six or seven different theoretical representations for exactly the same physics… hoping that they’ll give him different ideas for guessing.”
“Newton’s ideas about space and time agreed with experiment very well. But to get the correct motion of Mercury… the difference in the character of the theory… was enormous.”
“A philosophy… called an understanding of the law is simply a way that a person holds the laws in his mind so as to guess quickly at consequences.”
“For those who insist the only thing that matters is agreement with experiment… Suppose a Mayan astronomer says, ‘We can calculate eclipses accurately.’ And a young astronomer says, ‘Maybe the planets go around.’ The Mayan says, ‘Our arithmetic predicts better than your model.’”
https://www.youtube.com/watch?v=NM-zWTU7X-k
D: “For those who insist the only thing that matters is agreement with experiment… Suppose a Mayan astronomer says, ‘We can calculate eclipses accurately.’ And a young astronomer says, ‘Maybe the planets go around.’ The Mayan says, ‘Our arithmetic predicts better than your model.’”
BPL: Have to disagree with Feynman, at least as interpreted by the android. If you make a prediction and the prediction pans out, that’s evidence that your model is correct.
I’m pretty damn sure Feynman wasn’t talking about overthrowing evidence. He tends to get quoted a lot by pseudoscientists because of the cautions he raised about how scientists work. They take these to mean Feynman was against “consensus” science. Which, of course, he was not.
BPL,
Of course a bunch of out-of-context quotes is nonsense from the trolls. But in a sense Feynman, who was indeed brilliant as a physicist, fell into the trap of talking about too many topics. So he is quite correct about holding different conceptualizations, but when he ‘splains things he forgets that and treats the current one as “real”. None of which is relevant to climate science, obviously.
Anyway, I do have a question that popped into my head: If you have several models that produce approximately consistent results for one output variable, but differ for other variables, might that give us more confidence in the consistent prediction?
BPL: I’m pretty damn sure Feynman wasn’t talking about overthrowing evidence. They take these to mean Feynman was against “consensus” science. Which, of course, he was not.
Data: Making stuff up will not save you. It is not proper reasoning–it’s one logical fallacy after another after another.
Richard Feynman was NEVER FOR “consensus” science, period. Especially that based on Fallacies, Rhetoric or Institutional Dominance.
Nor did Feynman teach this kind of unthinking process to anyone; ever. While it’s not my role to hold anyone’s hand, reassure them, or prove them wrong I am happy to present the unvarnished truth.. But I’m not going to continually defend the existence of correct modes of reasoning against people who are indifferent to them. Normal people already know who you are.
Beware: Feynman repeatedly warned that science fails not only through bad faith, but through sincere overconfidence — especially when surface forms (models, graphs, authority) are allowed to substitute for deeper honesty about limits, assumptions, and boundary cases.
His Challenger appendix ended with a line that still applies far beyond engineering:
— “For a successful technology, reality must take precedence over public relations, for nature cannot be fooled.”
That wasn’t cynicism. It was respect for reality — and for the long-term credibility of science itself.
In full see https://www.realclimate.org/index.php/archives/2026/01/unforced-variations-jan-2026/#comment-844336
Data, the problem is defining and knowing “the reality.” Multiple scientific papers paint different pictures of the climate reality. The IPCC was created to form a consensus view on all that. I would much rather that than the alternatives, which would be complete chaos for example where politicians just followed their biases and selected Jim Hansen or M Mann, or more likely one of the denialists like Roy Spencer or Richard Lindzen or will Happer. Of course that happens anyway to some extent, but it would be MUCH WORSE without the IPCC and consensus science. So both the IPCC and consensus science is in effect a useful tool. With its own downsides of course.
Multi-troll: “ Richard Feynman was NEVER FOR “consensus” science, period”
So he rejected evolution, plate tectonics and believed that the Earth was flat, period, because THERE WAS a scientific consensus on these ?
Data 20 Jan at 6:45 pm Reply to Piotr and Pete
Hey, what’s you doing, Quickdraw ( ;-)
First things first – own up for your earlier attack on the same Pete you are now “replying” to as if nothing has happened. If in “flooding the zone” with your … mass-production you forgot what you wrote, let me help:
===============================
– Pete Best 12 Jan at 2:58 AM; “Right [SO] according to this blog it’s very unlikely CC has accelerated/changed from 0.17C per decade to anything else higher”
– “Data” 12 Jan at 6:27 PM to Pete Best:
“ So you are quitting outright, Submitting, and giving up. Which will further allow the verbose bullying trolls [i.e. non-doomers -P.]] presenting false, distorted unscientific data and information
-Pete: 14 Jan 9:13 PM: “My question is clear, your answer makes no sense to me”
– “Data: Jan. 14: I did not give an “answer” to your question/s. I ignored them. Is that a clue? Pete, I spoke to the rest of your comment (and lead up to it), and said what I thought about that, for my own benefit. If this comment makes no sense either.,, that’s OK too. I come have no expectations.. =======
I.e.
– you …. stood by your original accusations toward Pete
– arrogantly told Pete off – “Is that a clue?”
– bizarrely, explained to him that when you attacked him : So you are quitting outright, Submitting, and giving up.” you did it …. “for [your] own benefit” ???
-and then implied that Pete is … too dense to understand any of it: If this comment makes no sense either .,, that’s OK too. I come have no expectations.
And when Susan suggested that you misread Pete’s post – you arrogantly told her off: “Data: Check your bearings. Look for the ‘sense’ making. ”
=====
So, Mr. “Data”, are you standing by the above, or would you like to apologize?
For the record, to prevent further confusion:
• I made an earlier Forster/Foster typo, which I explicitly corrected on 11 Jan. (if not before)
• Climate Change Tracker is produced by Forster et al. (IGCC), not Grant Foster. Grant Foster has never published a projection of ~2 °C by ~2048, nor does any such projection appear in his work.
• Accordingly, references to a “~2 °C by ~2048 projection in Foster 2025’s Climate Change Tracker” are factually incorrect.
This note is intended solely as a clarification of the record.
I predict the sockpuppet account will dodge answering at least one of the following questions. The answer to all the questions is ‘yes’, despite the sockpuppet previously pretending the answer is ‘no’.
1) Is Forster 2025 peer-reviewed?
2) Does Forster 2025’s Climate Change Tracker project 2°C by approximately 2048, if the observed warming trend continues?
3) Is a point projection of 2°C by approximately 2048 consistent with a projection of ~2°C by 2045-2050 based on the observed warming trend?
4) Given the answer to questions 1 through 3, is it wrong to say that it’s “blatantly false and unfounded” to state that extrapolating the observed warming trend supports a projection of ~2°C by 2045-2050?
5) Is a continuation of the observed warming trend from Forster 2025’s Climate Change Tracker consistent with projections of ~1.5°C by around 2030, ~2°C by 2045-2050, ~3°C by 2075-2090, and ~3.5°C by the end of the 21st century for the Paris Agreement’s 20-year mean?
Anyone else is free to answer the questions, since informed and honest answers are unlikely to come from the sockpuppet.
See my clarification above: https://www.realclimate.org/index.php/archives/2025/12/1-5oc-and-all-that/#comment-844253
And the sockpuppet confirmed my prediction about them dodging the questions. Trolls really are predictable.
Atomsk’s Sanakan asks 23 Jan 2026 at 4:58 PM and Atomsk’s Sanakan says 24 Jan 2026 at 8:03 AM
I have answered those questions long ago. My answers were the same as Tamino (Grant Foster) gave him about his ‘criticisms’ of the Foster Rahmstorf 2025 paper.
And yes, I agree, Trolls really are predictable!
The sockpuppet hasn’t answered those 5 questions, anymore than Geoff Miell answered the questions they dodged. Hence why the sockpuppet can’t post their answers (my answers to all the questions is ‘yes’).
Re: “My answers were the same as Tamino (Grant Foster) gave him about his ‘criticisms’ of the Foster Rahmstorf 2025 paper.“
And to make this clear: the above response is disinformation stated to mislead people. The 5 questions are on Forster 2025, yet the sockpuppet pretends the questions are on the “Foster Rahmstorf 2025” pre-print.
The sockpuppet elsewhere pretends the issue was them making an honest typo by writing ‘Foster 2025’ as ‘Forster 2025’, so that they erroneously conflated Foster’s 2025 non-peer-reviewed pre-print with Forster’s 2025 peer-reviewed paper.
But they were responding to a comment in which I wrote ‘Forster 2025’ and referred to Foster’s 2025 pre-print as ‘Rahmstorf/Foster pre-print’. I didn’t refer to Foster’s pre-print as ‘Foster 2025’, so there was not an opportunity for the sockpuppet to conflate Foster’s 2025 pre-print with Forster’s 2025 peer-reviewed paper. It wouldn’t have made sense to refer to the pre-print as ‘Foster 2025’ anyway, since Foster is not the first author; Rahmstorf is.
What actually happened was that the sockpuppet pretended Forster 2025 was not peer-reviewed, so they could avoid acknowledging I cited peer-reviewed evidence in support of a projection. The sockpuppet knows this, which is why they still dodge the questions on what Forster 2025 showed for projections via its Climate Change Tracker.
Anyway, Foster discusses Forster 2025 here . The sockpuppet wasn’t aware of this because they haven’t done their homework. Nowhere does that post show Foster answering the 5 questions on Forster 2025 in a manner that agrees with the sockpuppet’s disinformation, such as by pretending Forster 2025 was not peer-reviewed.
1) If this was an honest typo, then:
– the sockpuppet would honestly address the questions, including on Forster 2025 being peer reviewed and its Climate Change Tracker projecting 2°C by approximately 2048, if the observed warming trend continues.
2) If this was not an honest typo but instead a disingenuous attempt to pretend there was not peer-reviewed research on a projection, then:
– the sockpuppet account wouldn’t address at least one of the questions, especially on Forster 2025’s Climate Change Tracker projecting 2°C by approximately 2048 if the observed warming trend continues.
Point #2 holds, not point #1.
Telling that instead of honestly answering the questions and admitting to Forster 2025’s warming projection, the sockpuppet continues distorting Forster 2025 to suit their agenda. Ironically, this involves the sockpuppet making warming projections they claim are supported by peer-reviewed publications, the same thing they refused to honestly admit others had done.
https://www.realclimate.org/index.php/archives/2026/02/unforced-variations-feb-2026/#comment-845058
I think I mentioned this over at Bluesky as well. But it’s well-known that changes in SST measuring practices caused heterogeneities in analyses for the WWII era. Some instrumental analyses address these heterogeneities particularly well (ex: Chan 2024 + Sippel 2024, with Osborn). And the multiproxy PAGES2k analysis doesn’t suffer from those problems in measuring practices. A good illustration of that is figure 5 of Morice 2025.
It thus might interesting to have those analyses shown on the same baseline as figure 3 from Dr. Schmidt’s above post. So, if possible, would Dr. Schmidt or anyone else be interested in making that figure? If so, then thank you. These would be 5 analyses to include in that figure:
I’d expect there to be a tight correlation between the trend in global temperature for those analyses vs. the logarithm of CO2 concentration. Same with a correlation vs. CO2 concentration, though the logarithm of CO2 concentration is the better comparison to represent the logarithmic relationship between CO2 increases and forcing (ex: this from KNMI, figure 1 of Lovejoy 2015, figure 1 of Lovejoy 2014, figure 1c of Jarvis 2024, figures 1a and 1b of Wu 2019, figure 1 of Montamat 2020, figure 1 of Xu 2019).
Somewhat reminiscent of what’s seen with global temperature trends vs. CO2 concentration in the distant past:
A recent pre-print that seems relevant to this topic:
And then there’s the question that must never be asked:
Why does it matter?
And the one that must never be answered:
True or false:
” It is quite possible that we could reach 2.5C and the AMOC would slow significantly, but it is equally possible that we could reach 2.7C and the AMOC would keep going with little effect on European temps.”
(Please read carefully.)
Re: “Why does it matter?“
It matters for tracking global surface warming relative to Paris climate agreement’s targets, as discussed elsewhere. The IPCC has a report on what’s entailed by 1.5°C of global surface warming relative to the pre-industrial baseline of 1850-1900:
Warming relative to that 1850-1900 baseline for the Paris agreement is calculated using a 20-year mean to mitigate bias from outlier years. That puts us at ~1.4°C, not yet 1.5°C:
Re: “And the one that must never be answered:
True or false:
” It is quite possible that we could reach 2.5C and the AMOC would slow significantly, but it is equally possible that we could reach 2.7C and the AMOC would keep going with little effect on European temps.”
(Please read carefully.)“
True. But as people have explained to you before, you being concerned about AMOC slowing significantly does not make AMOC slowing the only thing people are interested in nor the only pertinent impact of anthropogenic climate change. There are plenty of other effects such as ozone depletion (largely addressed already), ocean acidification, ocean deoxygenation, and contributions to an ongoing anthropogenic mass extinction. That’s reminiscent of a less extreme version of the Permian-Triassic mass extinction (a.k.a. the Great Dying), which also had global surface warming. There are impacts of global surface warming such as greater hydrological variability in terms of extreme droughts and flooding, along with hurricanes with greater storm surges, intensity, and rainfall. Melting land ice reduces availability of freshwater and accelerates sea level rise (ex: Chandanpurkar 2025; 1:53:16 – 1:57:53 and 57:26 – 58:03).
Your disinterest in global surface warming trends does nothing to change this. How people feel does nothing to change what the evidence shows.
AS,
Above, in a discussion following from my comment
https://www.realclimate.org/index.php/archives/2025/12/1-5oc-and-all-that/#comment-843630
you gave a very good description of Nirvana fallacy and single cause fallacy. But here we are and you offer the reference that tells us
“Long-term warming as assessed using the approaches developed herein and data up to and including 2024 stands at 1.40 [1.23–1.58] °C, and underlying human-caused warming stands at 1.34 [1.18–1.50] °C. ”
It stands at 1.40 and 1.58? Wow! Adding another decimal place is surely real progress in understanding what the climate system will be like in a decade or two or five.
But I tend to agree with Gavin on what matters:
“So this too will be
something that is subject to (annual?) revision, and the precise answer
might not be available for a while. Whether it matters if it turns out
(in a decade or so) to have been 2028 or 2030 or another year is not
obvious to me.”
And your second answer is likewise trollish, as in Strawman and correlation/cause. I’ve brought up AMOC previously as one example of the many phenomena (like the ones you list) for which obsessing about the precise value of GMST is a pointless exercise.
This is all pretty basic physics/reasoning. The only explanation I have for educated people spending so much time and bandwidth endlessly repeating the same nonsense is my (not professional) diagnosis of co-dependency with the trolls.
RC is advertised as being about science. It seems to have drifted very far from that most of the time.
Re: “It stands at 1.40 and 1.58? Wow! Adding another decimal place is surely real progress in understanding what the climate system will be like in a decade or two or five.“
It’s fine for experts to explain how to quantify global surface warming, no matter how much non-experts like you are disinterested in that topic. It’s your problem if you don’t understand the mechanisms by which global surface warming melts land ice, causes sea level rise acceleration, reduces freshwater availability, etc. The burden is on you to read and understand the peer-reviewed sources on this, or layman’s level sources, including the sources cited to you.
Re: “The only explanation I have for educated people spending so much time and bandwidth endlessly repeating the same nonsense is my (not professional) diagnosis of co-dependency with the trolls.“
Another, more likely explanation is that experts know more than you do. If experts have publication after publication on global surface warming and this doesn’t make sense to you, then don’t assume it’s because you know better or because of some other conspiracy theory you make up in your mind. I’m a non-expert in climate science as well, but I don’t have the nerve to act like I know better than experts on which metrics to evaluate.
You seem to leap to paranoid explanations when something doesn’t make sense to you. For instance, you assumed that I was a sockpuppet account of someone I critiqued, only for several people to then explain to you how I could not be their sockpuppet.
AS, you again demonstrate how similar your approach is to those of the trolls, with fallacies and rhetorical evasion… “zebra’s troll test” of not answering the question.
Strawman:
I never said scientists shouldn’t quantify GMST. What I said was that the precision didn’t matter that much, which is what Gavin (the actual expert) said. So people on RC arguing about it endlessly is just silly.
Correlation/cause:
Your statement “There are impacts of global surface warming such as…” is also just silly.
GMST doesn’t have an “impact” on anything… an increase in GMST doesn’t cause a glacier to melt; an increase in local thermal energy does that. And the net result of the local increase shows up as a local temperature, which is what causes GMST to increase. Obviously also true for the other things you mention.
Which brings us back to the original point which you are trying to evade;
You can claim that there is some correlation of some phenomena with an increase in GMST, but you have already agreed with my example of AMOC illustrating that the precision just isn’t there… and again, probably the case for all the other things you mention.
If you want to describe an example (in your own words) where that’s not the case, great, because that’s what I think people who come to a climate science site would be interested in.
This is almost as bad AGW denialists who refuse to admit GMST is real because they refuse to grasp the concepts of an average and of aggregation. On par with saying global recessions don’t have an impact, only one’s personal income does.
Anyway, let me know when you have a peer-reviewed publication on GMST changes not having an impact. Until then, I’ll go with the peer-reviewed literature, along with the evidence-based scientific consensus quantifying GMST changes and the impacts of those changes. When you submit your claims for peer review instead of as blog comments, it’ll become even clearer for your why your claims don’t hold up.
And FYI: I answered your original question, so there’s no need for you to claim otherwise. I also explained why your question is irrelevant to the importance and impact of GMST changes.
AS, so you would argue that when Bill Gates walked into that working-class bar, and the average wealth increased into the tens of millions…
…that had a great impact on the lifestyles of the factory guys drinking there?
One of the most fundamental characteristic of deniers and such is that they just can’t acknowledge and move on from being wrong.
I’m saying you’re making baseless claims you can only get away with in blog comments, but not in peer-reviewed venues. You’re basically messing up on aggregates and averages, like saying a hand doesn’t move a pen because only individual atoms in a hand can do stuff. GMST increases caused a global decrease in land ice, global sea level rise acceleration, etc. You’ve already been cited peer-reviewed evidence on the impacts of GMST changes. You mentioning individual locations does not change this, anymore than mentioning atoms in an hand changes the fact that the hand moved the pen.
One of the most fundamental characteristics of denialists is being convinced that peer-reviewed evidence and the evidence-based scientific consensus is wrong, while not being able to cite evidence as a rebuttal.
zebra @ 4 Feb 2026 at 6:43 AM
Zebra: “AS, so you would argue that when Bill Gates walked into that working-class bar, and the average wealth increased into the tens of millions……that had a great impact on the lifestyles of the factory guys drinking there?”
What a completely ridiculous example because it doesn’t describe an economic cause and effect process. Its a social process of someone walking into a bar. Typical silly sort of thing Zebra would say.
Re: “This is almost as bad AGW denialists who refuse to admit GMST is real because they refuse to grasp the concepts of an average and of aggregation.“
Speaking of denialism…
That’s worth comparing to other statements:
AS,
Yawn. You are sounding really desperate and playing middle-school level rhetorical games.
The physics is the physics. I’m guessing that even if you did read peer-reviewed papers, you didn’t understand them.
What I’ve said is essentially “stating the obvious” to anyone with a physics background and basic reasoning skills.
Correlation is not causality. Duh.
Feel free to disagree with that, if you like. But so far your comments on this are not passing peer review.
Zebra acknowledges the reality of AGW, but he can’t seem to accept that the air mass of earths lower atmosphere heating up on average globally is the causative factor in the climate change phenomena ie: melting ice, SRR, increased heatwaves, droughts, etc,etc. (Nobody is arguing its simplistically causative. This is just shorthand).
Instead he argues local anthropogenic causation is all that matters and this sums up to create an average. Just asking a couple of AI tools shows he’s wrong. I don’t know if its a simple mental block or mistake on his part, or its contrarian eccentricity, or he’s playing a joke to stimulate debate. But it has to be one of those sorts of things.
Re: “Correlation/cause:
Your statement “There are impacts of global surface warming such as…” is also just silly.
GMST doesn’t have an “impact” on anything… an increase in GMST doesn’t cause a glacier to melt; an increase in local thermal energy does that. And the net result of the local increase shows up as a local temperature, which is what causes GMST to increase. Obviously also true for the other things you mention.“
Re: “But so far your comments on this are not passing peer review.“
Example of a peer-reviewed source on GMST increases causing ice melt:
I predict no peer-reviewed source will be cited in response that:
1) shows that GMST increase does not cause ice melt, and
2) is authored by non-denialists.
At best, the response will be silence or another contrarian comment with no peer-reviewed material cited.
AS,
AS, climate scientists have often used “global warming” to refer to the increase in climate system energy, not specifically to the numerical value of GMST.
The fact that the best you could do was to cherry-pick a quote from a 2016 paper shows that you are in fact desperate.
Here’s my cherry-picked quote from the same paper:
“Cold meltwater and induced dynamical effects
cause ocean surface cooling in the Southern Ocean and North
Atlantic, thus increasing Earth’s energy imbalance and heat
flux into most of the global ocean’s surface.
Gosh, that sounds a lot like an effect that would be called “global warming” to avoid writing the same many words over and over.
People who understand the science don’t play word games; if they disagree, they use actual agreed-upon scientific terms, not cherry-picked quotes… the latter is what trolls and deniers do.
So far, you haven’t even tried to use scientific terminology.
I would say that the increased energy in the climate system resulting from GHG increase has an impact on many elements of the system.
It has an impact on SLR
It has an impact on phase transitions, like ice-water and water-vapor.
It has an impact on the nature of storms.
It has an impact on GMST
But SLR, phase transitions, and so on, have an impact locally that affect humans.
GMST has zero impact on anything, because it is nothing but an average of local temperatures. It’s the local temperatures that have an impact on GMST, not the other way around. You still don’t seem to get what is a very basic math concept.
(And local temperatures are indicators of the increase in local thermal energy.)
If you disagree, let’s hear the science in your own words.
Zebra, at what point does one begin to question whether the game is worth the candle?
First, GMST and Earth-System Energy both matter, but more to the point, both are metrics–statistics measuring of something fundamental Which is superior depends on the goals of the analysis in which they are being used.
If you need a metric with low noise, ESE is far superior–the much larger mass of the system over that of the atmosphere and upper Oceans that largely determine GMST mean that fluctuations will be much smaller (percentage wise). This means far fewer time periods to be cherry-picked by denialists to cause mischief.
The downside–ESE is far harder to estimate. Not only are there multiple interacting systems with no real boundaries, some of these systems are difficult to access and measure with any granularity. As a result, ESE datasets are far shorter than those of GMST. So if you are wanting to look at changes over the long run, GMST is really your only option. There are also some phenomena that are inherently temperature driven–biological processes, chemical reactions. While these are driven by local temperatures, local temperature changes correlate well to global changes on the whole. Temperatures matter–for some phenomena, more than energy..
The real question, though, is whether the discussion is worth the acrimony it generates among people who, for all practical purposes agree on the aspects of the problem that matter.
@Ray Ladbury,
Thanks for an actual response to what I actually said. I have an answer and a question.
I’ve said over and over that GMST has been a useful metric… the only way to have a solid quantitative long term validation of the GHG paradigm. But I’m really sick and tired of people repeating the same stupid arguments with the same stupid Denialists…. doing that means accepting their framing, replete with cherry-picking and logical fallacies. I know it’s not “my” blog, but it’s just embarrassing. And I think it drives away serious people with either questions or answers. Those are the people I would like to interact with.
So, let’s talk about the energy metric.
First, I don’t understand you saying that “temperatures matter more than energy”. Temperature is a measurement of energy, and just as with GMST and the climate system, it can be a convenient way to quantize a process. An increase in the length of a column of mercury doesn’t cause us to sweat
But anyway, I don’t think I have ever suggested actually trying to come up with a number for total ESE. What I have tried to point out is that we now have instrumentation that offers a much more direct way to measure change. If I were the new climate czar, (assuming we have elections in a couple of years), I would double the number of Argo floats and the number of satellites measuring EEI. Which brings me to the question I’ve asked a few times for people with expertise:
How long a set of data would you actually need to determine if there is a change in the rate of increase of energy using those metrics? (I would expect you to be a prime candidate for answering that.)
And relating this to the business about Denialists, why isn’t even the data we already have a much better way to answer them… there aren’t any Urban Heat Islands in the oceans, or in space.
Re: “I predict no peer-reviewed source will be cited in response that:
1) shows that GMST increase does not cause ice melt, and
2) is authored by non-denialists.
At best, the response will be silence or another contrarian comment with no peer-reviewed material cited.“
And the prediction was confirmed.
Again:
Can you produce a peer-reviewed source authored by non-denialists that shows that GMST increase does not cause ice melt? If so, then cite it.
I predict that, again, no such peer-reviewed source will be provided.
Re: “AS, climate scientists have often used “global warming” to refer to the increase in climate system energy, not specifically to the numerical value of GMST.“
You were shown the title of the paper, which is:
2°C would be a GMST change, not the units for energy nor for radiative forcing. The former is J and the latter is W per m^-2. The central point of the paper is assessing whether 2°C of global warming is dangerous, where this global warming is a GMST change.
That leaves at least 2 main possibilities:
– You didn’t bother to read the title of the source you quote-mined and misrepresented, despite the title being shown to you.
– You’re so committed to your position that you try to knowingly disinform and gaslight people.
I don’t know which is worse. Either way, I now know to distrust you when you discuss climate science, zebra. I prefer people who honestly disagree with me over people who agree with me on some topics, but gaslight to avoid admitting error.
Re: “W per m^-2”
Typo. That should read “W per m^2.”
zebra says: “I never said scientists shouldn’t quantify GMST”
I would question that. Zebra has spent literally years on this website repeatedly arguing GMST doesn’t matter and we should be looking at changes in energy content. (a proposition I disagree with)
zebra: “GMST doesn’t have an “impact” on anything”
AS said “global surface warming” has an impact on xyz. And surely this is correct? If the air mass of the whole planet is heating then this must logically expand sea water and melt ice. It will vary locally only because the air mass doesn’t heat evenly.
zebra: “You can claim that there is some correlation of some phenomena with an increase in GMST, but you have already agreed with my example of AMOC illustrating that the precision just isn’t there… and again, probably the case for all the other things you mention.”
So because we have low level precision about what the AMOC is doing and what it might do, we therefore have low level precision about all other climate trends? I dont think that follows.
a comment on “zebra”, 29 Jan 2026 at 12:14 PM,
https://www.realclimate.org/index.php/archives/2025/12/1-5oc-and-all-that/#comment-844556 ,
Atomsk’s Sanakan, 3 Feb 2026 at 12:10 PM,
https://www.realclimate.org/index.php/archives/2025/12/1-5oc-and-all-that/#comment-844719 ,
Nigelj, 3 Feb 2026 at 5:04 PM,
https://www.realclimate.org/index.php/archives/2025/12/1-5oc-and-all-that/#comment-844730 ,
and Piotr, 3 Feb 2026 at 11:51 AM,
https://www.realclimate.org/index.php/archives/2025/12/1-5oc-and-all-that/#comment-844716
Sirs,
I understood the post by Dr. Schmidt (that “zebra” referred to) the way that disputing fiercely when we exactly passed (or will pass) the arbitrary 1.5 °C warming threshold may be hair splitting, due to all existing uncertainties, short term variations etc.
If “zebra” meant the same, I tend to agree with him.
And although he, this time, has not mentioned the Earth energy imbalance (EEI), he is certainly right that EEI drives the changes in global mean surface temperature (GMST) as well as other changes in the Earth climate system, such as sea level rise or ice melting.
I think, however, that previous discussions on this website clarified that there is no simple relationship between actual EEI value and actual GMST rise rate. There is also no simple relationship between GMST rise and sea level rise. I guess that at least quantitatively, the relationship between GMST rise and “ice melting” also differs, depending on if we speak about sea ice, polar ice sheets or mountain glaciers.
Unfortunately, your present contributions seem to suggest that effects like “ice melting” may be directly caused by the GMST rise. Such arguments might be oversimplified and potentially misleading, I am afraid.
Could we perhaps somewhat retreat and mutually agree at least that it was considered important to set the arbitrary 1.5 °C warming threshold, because the observed climate change may cause many problems to the mankind and the GMST rise seemed to be the best indicator of its progress?
Greetings
Tomáš
TK,
“…. because the observed climate change may cause many problems to the mankind and the GMST rise seemed to be the best indicator of its progress?”
I’ve said exactly that multiple times, praising the efforts that went into solidifying the metric.
Time to move on.
Zebra: “ It stands at 1.40 and 1.58? Wow! Adding another decimal place is surely real progress in understanding what the climate system will be like in a decade or two or five “.
What a contrast with if we instead used Zebra’s famous golden standard for science communication, EEI!
Imagine the shock of the public, when they hear that …. a variable:
– that they never heard about,
– unlike T, they having no intuition what it means,
– difficult measure,
– with sparse measurement both in space and time
– without any historical data to speak of
– with no proxies to know its values in the past time
– unlike temperature NOT directly determining many of the global warming effects^*
…. could increase, in the next decades wait for it, by a few …. decimal points, with the +/- 0.2 W/m2 error bars!
To quote Zebra: “Wow!”
I can see the headlines and TV breaking news: “ EEI up by few decimal points in the next few decades”! Mothers will cover their babies’ ears, the agitated men walking nervously around the house anxiously asking themselves: “How have we let it to get to this point???” A massive wave of public support for …. EEI mitigation ensues.
—
^* ice melts because the temp. is above 0C not because local EEI crossed a certain W/m2 threshold; water and air density, and through them – ocean and atmospheric mixing and circulation, are functions of T, not EEI; the capacity of air to hold water vapour and condensation into clouds and therefore the effect of water cycle on climate, is a function of T, not EEI, etc. etc.