The #AMOC is the reason for Europe’s mild climate. Evidence that it is slowing has been piling up over the years – it now is likely at its weakest in at least a millennium, and it may even be approaching a tipping point. Here I will show you the latest high-resolution images – and also discuss whether there is serious evidence speaking against an ongoing AMOC weakening.
Our regular readers are well aware of the Atlantic Meridional Overturning Circulation, or AMOC in short, a large-scale overturning motion of water along the whole Atlantic which transports a quadrillion Watts (that is 1015 W) of heat to the northern Atlantic, partly via the Gulf Stream. (If you are new to the topic, check out this article.)
Instabilities of the AMOC have produced some of the most dramatic climate changes in recent Earth history, well-known to paleo-climatologists (see e.g. my by now ancient review in Nature 2002), and concerns that we are destabilizing it by causing global warming has been rising sharply in expert circles in recent years (see last year’s open letter by 44 experts).
One reason is what we are observing in the northern Atlantic. And another reason is the latest model simulations by the Dutch research group in Utrecht. A recent paper by van Westen et al. (2025) has shown that the much-feared tipping point where the AMOC breaks down (first demonstrated in a simple box model in 1961) is also found in a high-resolution (eddy resolving) ocean model – destroying any hope that it might be an artifact of too coarse and simple models. This tipping point has been consistently demonstrated across the entire model spectrum by now, and the cause is well-understood (a destabilizing salt transport feedback).
Also, that model simulation and paper provide us with the AMOC ‘fingerprint’ in sea surface temperature (SST) in unprecedented detail. So let’s have a look (Fig. 1)!
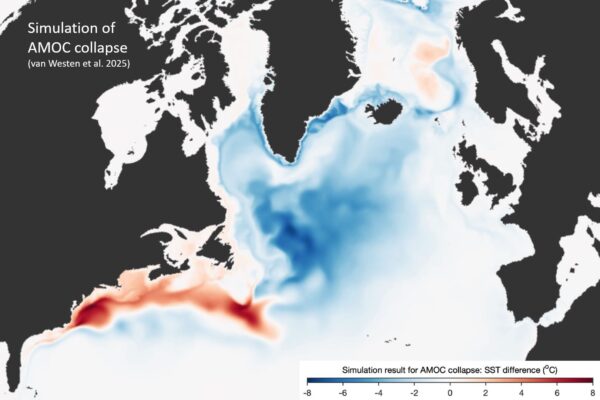
Figure 1. Sea surface temperature change pattern caused by the AMOC shutting down in a high-resolution ocean model. This is a pure AMOC effect without any greenhouse-gas climate change. We see the famous blue ‘cold blob’ due to less heat being brought to the northern Atlantic, and also in red the northward Gulf Stream shift, an ocean dynamics effect of weakening AMOC (Zhang 2008). Source: van Westen et al. 2025., mapped by Ruijian Gou.
And now compare that fingerprint pattern to the trend in satellite sea surface temperature measurements (Fig. 2). What do you see?
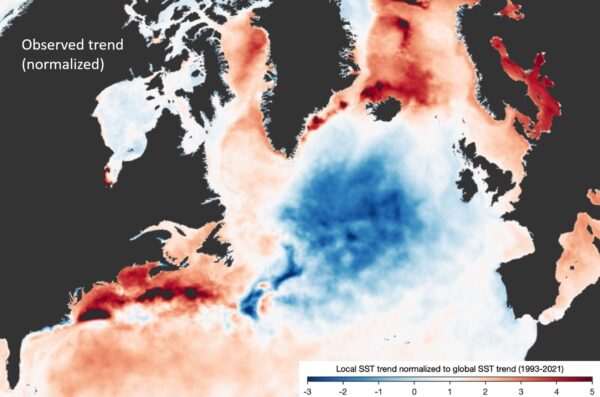
Figure 2. Normalised trend in satellite-derived sea surface temperature 1993-2021 (linear trend over that period). Normalised means it is divided by the global mean sea surface temperature trend in order to take out the global warming signal. So blue regions (values less than 1) have warmed less than the global mean or cooled, red have warmed more than average. Source: Copernicus satellite data, mapped by Ruijian Gou.
The cold blob and the Gulf Stream shift signal are both clearly seen in the satellite trend. Note we are only comparing the pattern, not its amplitude, and the colors correspond to different units: In the observational data we are talking about a moderate AMOC change, in the model a near-complete shutdown. That explains also the differences: in the satellite map the Labrador Sea hasn’t cooled, presumably as deep convection there still continues. And the Nordic Seas have warmed – we have a paper in preparation which shows this is due to increased flow of warm water toward the Nordic Seas and likely a result of AMOC weakening; these two overturning motions are dynamically anticorrelated, but only temporarily so until Nordic Sea convection shuts down.
Taken together, these two images provide once again clear evidence that an AMOC weakening is underway – as was first argued fifteen years ago by Dima and Lohmann (2010). The same fingerprint is also found in a coupled climate model simulation for CO2 doubling by the Geophysical Fluid Dynamics Lab in Princeton, as shown in Fig. 1 in this blog post from 2018. And the fingerprint pattern of cold blob and Gulf Stream shift can also be seen for a different time interval in the following global image of sea surface temperature change (Fig. 3).
This weakening is of particular concern because the AMOC has a tipping point, and our recent study has shown that in many of the standard future global warming simulations performed for the current IPCC report the AMOC passes that tipping point and shuts down in the following decades. The Guardian rightly titled that this danger “is no longer low-likelihood”, as we had discussed it for decades.
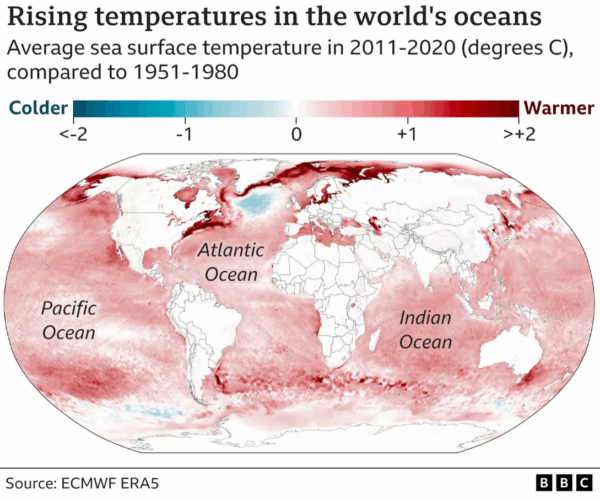
Figure 3. Global map of changes of sea surface temperature. Source: ERA5/BBC
What about counter-arguments?
I sometimes read counter-arguments against an ongoing AMOC slowing, but many just don’t hold water. Let’s have a look at some of them.
For example, the increase in Nordic Sea exchange is sometimes taken as contradicting an AMOC weakening – but that is a non-sequitur as there is no reason why these two circulations should be in sync, but good physical reasons and empirical evidence suggest that in fact they anti-correlate.
Not seldom different time periods are mixed up – for example when the Worthington et al 2021 reconstruction is quoted as questioning an AMOC weakening. Let’s compare that to the reconstruction by Caesar et al. 2018 where we estimated a 15 % weakening since the late 19th Century (Fig. 4) – I would say these two reconstructions strongly agree during the time interval 1981–2016 covered by Worthington.
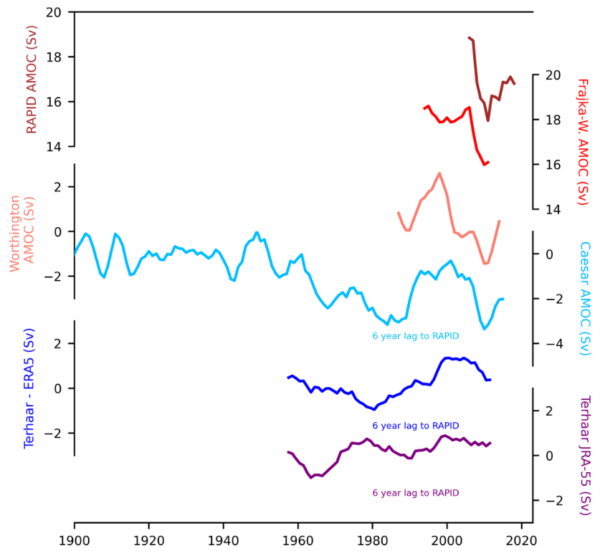
Figure 4 Several AMOC reconstructions, with the RAPID measurements on top. The reconstruction by Frajka-Williams et al. 2015 used surface height data from satellite, and the Worthington et al 2021 reconstruction uses a water mass regression based on RAPID data. Graph: Levke Caesar.
One recent prominent paper by Terhaar et al. (2025) that has questioned AMOC weakening covers a longer interval (1958 to 2022). But for the period since 1958 Caesar et al. 2018 also did not find a statistically significant AMOC weakening – so strictly no contradiction there – and what’s more, the calculated input data used (surface heat fluxes) are far more uncertain than the directly measured sea surface temperatures, as we can see in the large differences between their two reconstructions (dark blue and purple) using two different surface flux data sets. And they both disagree with the likely more reliable reconstruction method by Worthington. (More on the Terhaar study here.)
Then there is Latif et al. 2022. They don’t claim to contradict the Caesar reconstruction, they explicitly write they don’t. What they argue is that natural variability is larger than an anthropogenic effect. That is not the same as saying there is no AMOC slowing. In the Caesar reconstruction multidecadal variability is also larger than the slowing trend. I always show Latif et al 2022 in my talks in support of the observed SST fingerprint pattern indicating an AMOC slowing, since their paper shows a clear correlation of the SST fingerprint with the AMOC (as shown in Fig. 2 here in this post).
Sometimes also a paper by Rossby et al. 2022 is cited as questioning an AMOC slowdown. Let’s just quote their abstract: “There is evidence for a 2.0 Sv Gulf Stream slow-down between 1930 and 2020. Whether and to what extent this reflects a slowdown of the AMOC or wind-driven circulation cannot be established with certainty. Our estimate of a 0.4 Sv AMOC decrease is reported with low confidence.” They thus report a slowdown, just with low confidence.
There is also a reconstruction since 1900 by Fraser and Cunningham 2021. They write that “from the 1930s onwards we see qualitative agreement with Caesar et al. (2018), with mostly a high AMOC until the 1950s, followed by a weakening throughout the 1960s and then a lesser peak around 2000”. There is disagreement between 1900 and 1930, where however their method is very uncertain, so they conclude that although their “results do not resolve AMOC weakening over the last century, they should not be interpreted as evidence to the contrary.” Which some people do nevertheless.
As another example, a paper by He et al. 2022 argues based on a model simulation that the SST fingerprint pattern could also be caused by surface fluxes rather than an AMOC weakening. However, the observed fluxes suggest the opposite. And their model simulation starts in 1920 with a prescribed constant ocean heat transport that doesn’t match the initial state of the atmosphere – a model setup which invariably leads to an initial adjustment process of the model (in other words, climate drift) which will likely look like the ocean heat transport fingerprint, as I discuss in this talk.
And finally there was a paper which many media reported as showing a much more resilient AMOC even though it just redefined the word AMOC collapse, and the Volkov study about a stable Florida Current which climate skeptics confused with the AMOC (see postscript here).
So while there is quite a number of studies with different methods using temperature or salinity data or paleoclimate proxy data from ocean sediments that support a weakening AMOC since the 19th Century (as I have previously discussed e.g. here, here and here), I do not really see a credible counter-argument. If you know one that I have missed, please let me know in the comments!
And as a final reminder: if there is a risk that the AMOC is weakening and heading towards a tipping point, we need to act on that (just like with other major risks). This is not an issue where we can afford to wait until we are certain, or pretend it’s just an academic discussion without major consequences.
If you want more information on this…
My overview article in Oceanography Magazine (open access, many pictures)
My Alfred Wegener Medal lecture at the European Geosciences Union meeting 2024
We at Hellnasker recently listened to a lecture by Lars Henrik Smedsrud (NORCE/Bjerknes Centre), where he argued that the “cold blob” south of Greenland has largely disappeared in recent years. He suggested that while the AMOC may indeed be weakening, there are no signs of collapse — emphasizing that the ocean appears more resilient and stable than many models predict.
From your perspective, how do you interpret this apparent disappearance of the cold blob in the latest SST data (e.g., ERA5 2023)? Do you see it as a temporary signal masked by surface warming, or as a sign of partial recovery of the AMOC?
And finally, considering Iceland’s unique position at the meeting point of the Arctic and Atlantic, what kind of long-term ocean monitoring or process studies would you see as most useful for Icelandic oceanographers to assess how AMOC variability might affect nutrient transport and fish stock productivity in our region?
[Response: It tends to disappear in summer, covered up by a warm shallow mixed layer. For climate change we look at long-term trends. Note also that in the blog I comment on Smedsrud’s claim that the stable or increasing Nordic Sea exchange is at odds with an AMOC decline – that is not the case. -Stefan]
IPCC AR6 WGI Summary for Policymakers, C.3.4: “The AMOC is very likely to weaken over the 21st century for all emission scenarios. While there is high confidence in the 21st century decline, there is only low confidence in the magnitude of the trend. There is medium confidence that there will not be an abrupt collapse before 2100. . . .”
(While paragraph C.3.5 went on to cite possible contributions from a short series of volcanic eruptions over a period of decades, those events will probably be subject to modeling only should they occur.)
Still a few years out from AR7 WGI publication, the data and models reported here begin to suggest to this layman that, while the former report expressed “low confidence” in the magnitude of the trend and “medium confidence” of no abrupt AMOC collapse before 2100, data and modeling begin to suggest that AR7’s revisitation of these subjects may well be adjusted.
Can we anticipate based on data and modeling available in mid-October 2025 that the chances of “an abrupt collapse before 2100” is far enough beyond “medium confidence” to qualify as “high confidence”? (either now or by the time of AR7’s anticipated release in 2029) –and that reckoning of the magnitude of the trend will support at least “medium confidence” if not “high confidence”? (again, either now or by the time of the AR7 release)
(Recent NSIDC data show that Greenland’s ice mass loss is hardly abating.)
[Response: I would agree that there most likely will be “no abrupt AMOC collapse before 2100”, since in all the warming scenario simulations the AMOC dies gradually over a period of 50-100 years after crossing the tipping point. That makes sense because the dense water at depth, which drives the NADW flow, doesn’t vanish suddenly, it needs time to erode away. An AMOC start-up in contrast can be much faster and indeed abrupt, as it triggers deep convection and thus deep release of heat from the water column which densifies it very rapidly drives a major AMOC flush, as in Dansgaard-Oeschger events.
Of course, impact of major AMOC changes can be felt within this century, they don’t only start when the AMOC has fully shut down. -Stefan]
Gah! Thank you for the news nonetheless, Stefan. I’m among the RC regulars acquainted with ‘AMOC’. As you say, the transport of equatorial heat poleward apparently keeps much of Europe’s climate more clement than it would otherwise be. There’s more to it than that, to be sure, but the public concern is for a relatively sudden, drastic cooling of Europe’s climate, entailing high costs and mass casualties.
I presume there’s no paradox between that general expectation, and the recurrent lethal heat waves in multiple European cities from London to Lisbon this summer (https://www.imperial.ac.uk/grantham/publications/background-briefings/uk-and-european-heatwave-2025-/)? Has any relation between AMOC and European regional weather been investigated? Will London, for example, suffer more or less lethal heat?
Thanks in advance.
Has any relation between AMOC and European regional weather been investigated? Will London, for example, suffer more or less lethal heat?
D’oh! Of course there have been such studies that assume the AMOC keeps running. I’m curious about models of European regional weather after AMOC collapse.
Sorry for not asking a clear question.
[Response: The interactive AMOC scenario website might be what you are looking for? https://amocscenarios.org/?lat=45&lon=-5&model=cc_RCP45&is_amoc_on=false&is_delta=false&metric=temp_2m
– Stefan ]
Figure 3. Global map of changes of sea surface temperature. Source: ERA5/BBC
Seems to me I should be seeing a map depicting changes. I’m not seeing such on my Mac running Safari.
Am I missing something?
I find a lot of this commentary misleading and not up to date.
The AMOC is not just an ocean phenomenon but very much coupled with the atmosphere. Our earlier studies (which take results to more recent than given here) show a lot of variability but only a small trend. Our latest is here: (available freely)
Trenberth. K.E., L. Cheng, Y. Pan, J. Fasullo and M. Mayer, 2025: Distinctive pattern of global warming in ocean heat content J. Climate, 38, 2155-2168 https://doi.org/10.1175/JCLI-D-24-0609.1
There is so much more going on. Please pay attention
Kevin Trenberth
[Response: Of course the AMOC is coupled to the atmosphere. We have a paper in review with Lijing Cheng as coauthor which looks at just that and shows once again that the AMOC ‘fingerprint’ pattern is not caused by atmospheric forcing but by ocean heat transport changes. The surface heat flux then responds to that. Unfortunately your criticism is so unspecific that I am not sure what you actually disagree with here? – Stefan ]
Thanks for the article and your work on the paper. I only have some questions if you wish to address them and have the time. Probably does not matter to anything. Sorry as I have autism spectrum issues that picks up inconsistencies too easily or that may not even be important.
Why the equivocation in the paper and article, as in a lack of being definitive? eg
vs TG
“We found that the tipping point where the shutdown becomes inevitable is probably in the next 10 to 20 years or so. That is quite a shocking finding as well and why we have to act really fast in cutting down emissions.” SR
The paper does not state that. nor do you here. Why?
[Response: The Drijfhout et al. paper shows that in Fig. 5. This blog is not about the Drijfhout et al paper, which is a study about CMIP6 model results. This blog is about the observed fingerprint SST pattern. Please understand that one blog article has one topic and doesn’t cover everything. -Stefan]
Why the constant shifting between defining words in the paper, ur note here and TG and IPCC other papers etc?
– abrupt collapse is a tautology eg abrupt AMOC collapse (<30 years)
– collapse = (of a structure) suddenly fall down or give way.; fail suddenly and completely. ; a sudden failure of an institution or undertaking.
– eg An AMOC (Atlantic Meridional Overturning Circulation) "collapse," as defined by the IPCC and related climate science, is a severe disruption or shutdown of this major ocean current system, leading to abrupt shifts in regional weather patterns. IPCC defintion
– paper – In our view the term abrupt is not applicable to the future shutdown of the overturning
– paper – An abrupt AMOC collapse (<30 years) is only triggered by massive freshwater hosing
– or paper – define a northern AMOC shutdown [ used repeatedly ] vs whole of AMOC shutdown/collapse ?
… vs given the over 50 year time scale for a northern AMOC shutdown to unfold
– vs a shutdown of all deep convection areas must be considered a precursor of a transition to a northern AMOC shutdown.
– paper – shutdown … after 2100 following deep mixing collapse
– IF the northern AMOC shutdown happens, does not the whole AMOC conveyor system stop, shutdown / collapse too?
– paper – these transitions to a weak and shallow AMOC are preceded by a mid-21st century collapse of maximum mixed-layer depth in Labrador, Irminger and Nordic Seas. The convection collapse is mainly caused by surface freshening ???
– paper – n abrupt collapse of the AMOC before 2100 was very unlikely
– word use variations – severe disruption, shutdown, northern AMOC shutdown, collapse, abrupt collapse, Amoc collapse, abrupt AMOC collapse, convection collapse , deep-convection collapse, collapse of deep mixing, deep-mixing collapse, completely shuts off, a total collapse , major weakening, its weakest, is weakening.
– paper – abrupt AMOC collapse ( “and heading towards a tipping point” ,include the idea these or usually irreversible?
– if so you are saying we only have 10-20 years before this happens – why no sense of genuine alarm here? it seems incongruous to me.
– what does “not an issue where we can afford to wait until we are certain, ” supposed to mean? is there a definitive conclusion you have drawn, why not state that?
– Act? Act how how? Do what? Why can’t you be totally clear and definitive, quantify what you are saying and make it overtly obvious all at the same? Because really you are sounding incredibly Vague here as to what you actually mean.
— If by Act, you mean to rapidly curtail ghg emissions, urgently, then why cant you and the paper state by how much and by when? Cut global emission my how more than the current levels each year?
— Like please spell it out given the Risk, of an AMOC Tipping point before 2050, what must emission be at in 2030 and 2040 to definitively avoid that Risk occurring?
[Response: It is a risk assessment under uncertainty, so we cannot say what it takes to “definitively” to avoid that risk, and probably that isn’t even possible any more, we can only reduce it. We give specific numbers in the Drijfhout et al. paper: we estimate the AMOC shutdown risk as 70% for the SSP585 emissions scenario, 37% for SSP245 and 25% for SSP126 (i.e. Paris Agreement). The best we can hope for is that the world stays as close to the 1.5°C Paris target as possible. And yes, that requires major increase in commitment by governments; so far they are still massively subsidising fossil fuel use, in the US even banning renewables projects. But how to cut emissions fast is another discussion, not the topic of this blog piece nor is it my expertise. This blog is not even about the AMOC shutdown risk, but rather it is focusing on the question of whether the AMOC has already slowed down and the evidence provided by the SST fingerprint. -Stefan]
— I am simultaneously asking why are you and almost all other Paper / IPCC authors and Media writers always leaving to the casual reader to work this out for ourselves? For us to decide how big the cuts should be by when and if the Risk is even worth the cost of acting?
— eg How do we know if it means reducing current emissions to 10% of current levels by 2040 and than means banning all ICE vehicles and closing down all coal power stations globally in china and india by 2030 or else we blow it?
— Irrespective of the risk Stefan, some things are actually humanly impossible so being crystal clear really matters . Especially for non-scientists lack a PHD in Statistics and Advanced Mathematics and Physics.
My feedback to you is that I am none the wiser after reading your article and the Discussion section of the paper in detail about how important the info here is, or isn’t.
Thank you
PS
Sudden means happening quickly and unexpectedly, while abrupt shares this meaning
Core meaning Happening quickly and unexpectedly. Happening quickly and unexpectedly.
=
Impacts would include a southward shift of the tropical rain belt, weakening of monsoons in Africa and Asia, a drier Europe, significant sea level rise along the American Atlantic coast, and a reduced ability of the North Atlantic to absorb carbon dioxide. It is considered a major climate system tipping point with a high risk of causing widespread, severe climate catastrophe.
Define widespread, severe climate catastrophe. ?
AND note
Characteristics of an AMOC collapse:
Abrupt climate shifts: The most significant consequence is the rapid change in weather patterns and the global water cycle.
Shift in tropical rain belt: A southward shift would alter rainfall for millions of people who rely on it for agriculture.
Weakened monsoons: The summer monsoons in Asia and Africa could weaken, impacting crop production.
Drier Europe: The collapse would likely lead to more severe winter droughts and a general drying trend in Europe.
Increased sea level rise: The American Atlantic coast would experience substantial additional sea level rise.
Reduced ocean carbon uptake: The North Atlantic’s capacity to absorb carbon dioxide would be greatly reduced.
Ecosystem damage: The collapse would lead to greatly reduced oxygen supply to the deep ocean and potential ecosystem collapse in the northern Atlantic.
Why it is a major concern:
Tipping point: The AMOC is considered a major tipping element in the climate system, meaning it could cross a threshold and undergo a large, possibly irreversible change.
Precautionary principle: Due to the potential for catastrophic impacts, scientists stress that it is a risk that must be avoided “at all costs”.
from https://www.google.com/search?q=ipcc+definition+of+amoc+collapse&oq=ipcc+definition+of+amoc+collapse&gs_lcrp=EgZjaHJvbWUyBggAEEUYOTIHCAEQIRigAdIBCTEzMTYyajBqN6gCCLACAQ&sourceid=chrome&ie=UTF-8
HOW MUCH must current global / USA or EU or China all/CO2 emissions be rapidly cut from current 2025 level by 2040-2050 that would ensure the above did not occur?
Give us the Goal for all our nations’ politicians and corporate boards to Hit – What is it – be specific not vague please?
Thankyou.
and previously discussed on rc
Is the AMOC not collapsing?
Here we show that the AMOC is resilient to extreme greenhouse gas and North Atlantic freshwater forcings across 34 climate models. Upwelling in the Southern Ocean, driven by persistent Southern Ocean winds, sustains a weakened AMOC in all cases, preventing its complete collapse.
Feb 26, 2025
Continued Atlantic overturning circulation even under climate …
Nature
https://www.nature.com › articles
?
Is the AMOC shutting down?
“Even in some intermediate and low-emission scenarios, the Amoc slows drastically by 2100 and completely shuts off thereafter. That shows the shutdown risk is more serious than many people realise.”
Aug 29, 2025
People can only realize what they have already ben told by the scientists working on this. Seems a meaningless redundant thing to say.
“And as a final reminder: if there is a risk that the AMOC is weakening and heading towards a tipping point, we need to act on that (just like with other major risks).”
Stefan.. what specific actions do you suggest should be taken to address this AMOC weakening risk? Something practical and realistic.
[Response: Limit global warming to well below 2°C and make a very serious effort to limit it to 1.5°C. Basically what all countries agreed to do already ten years ago in the Paris Accord. That should be realistic, if everyone has agreed to do it. -Stefan]
Excellent discussion, thanks. I especially appreciate the analysis/dissection of the counter-arguments.
Bonjour, petite question : que faites vous des études qui contredisent cette affirmation sur l’approche d’un point de bascule ?
Jens Terhaar et al. Nature (2025)
J.A. Baker et al. Nature (2025)
Alex Morrison, phys.org (2025)
et vous mêmes qui doutiez en janvier 2025, en parlant même de “dérapages médiatiques” ?
Vous n’avez pa lu l’article, ni les précédents (https://www.realclimate.org/index.php/archives/2025/02/how-will-media-report-on-this-new-amoc-study/).
S’il vous plait, faites l’effort de lire l’intégralité des articles proposés sur le sujet ici même et de poser vos questions en anglais… Cela ne fait pas très sérieux sur un site anglophone…
Your data and arguments, Stefan, seem convincing to me. This is just another field of climate research, where all indicators and developments are all moving faster in the exact wrong direction, but as you show here, as usual you have some studies which are trying to tell us that we don’t need to worry about anything at all. There will of course always be plenty of money for that kind of “science”. It comes as no surprise to me, that many of these studies are coming from research financed here in Norway. (Norway is a petro-state, where the broad center-right political “spectrum” (if you can call it that) have always been what I call climate ignorant, but until recently was this at least hiding behind different kinds of greenwashing of business as extremely usual. By now, as is surely easy to see behind giving the Nobel peace price to a staunch venezuelan admirer of Donald Trump (!), these “green” symbolisms are being left behind, as the “center” drifts further to the right and become trumpism light, if not something more sinister. Cameleonic politics, well-known from the 1930’s).
What I want to ask you here, is if you know when we can expect the end of the peer-reviewing process of your and Grant Foster’s paper about the acceleration of global warming ( https://www.researchsquare.com/article/rs-6079807/v1 )?
I mean the conclusions in that paper – that we have already passed the 1,5 degree – limit and will probably pass the 2,0 degree limit in just twelwe years from now, urgently needs to be brought to the attention of the broader public. Preferably well before the COP30 starts in Brazil.
This is so urgent, because it seems that the socalled “leading” (what are they leading?!) politicians overall have now “chosen” that they simply don’t care anymore. They just “go with the flow”…
They only listen to the fossil fuel lobby which have by now launched a very succesfull offensive against any effective climate policy. The main force behind this is as usual “the economy” as seen dogmatically by the reaganomists (the oligarchic, monopolistic interests of big capital, being promoted by the neoliberal dogmatism in “Project 2025” etc.). This offensive is being led by the by now openly oligarchic near-dictatorships in the US, Russia, the feudal arabic regimes etc. They are being portrayed as fighting each other, but mainly they aren’t at all, they are just fighting over who gets to use the fossil fuels, rare earth materials etc.
The main fossil fuel offensive aiming to destroy any remains of climate policies is being led by the Trump regime, which is now preparing to take over the venezuelan oil reserves (which are the greatest remaining in the world) through the well-known method of military provocation, intervention/invasion and regime change. It dates back to the “good old days” of banana republic regimes in Latin America, and could be called Bay of Pigs 2.0 so to speak. Generally the world order is being pushed back to the imperialism of the late nineteenth and the first fifty years of the twentieth century.
Of course the result of this will very probably be that the capitalist full-scale CO2-experiment with the global climate system will move beyond the pale. While there maybe is no “point of no return”, there surely are tipping points now soon being passed, and with growing speed. The consequences will be very hard to ignore, but we can be sure that all the usual suspects will quadruple their efforts to try exactly that. They are already in full swing, aided and abaited by the augmented propaganda-powers of artificial “intellegence” etc., which by the way are contributing heavily to the spiralling use of fossil fuels…
Against this it will surely not suffice with even more slogans about “optimism”, no more chamberlainisms. We have had more than enough of that, in fact we had that more than twenty years ago.
*What we need now is the revolutionary, stubborn spirit of intransigent resistance shown by Churchill in 1940. The blunt, clear and unforgiving presentation of the simple facts about what is happening to our future climate and the global ecosystems, if the politics aren’t radically changed, and immidiatly*.
We can’t continue to let the politicians speak about global heating as if it were a minor and cosy problem like the weather in the summer holidays next year. Enough stupidity and ignorance is enough. They will try to crush the science, that has for long been rather obvious, even if many still prefer to not see it, speak comfortably about climate “adjustment” (as if that were possible without catastrophes, while continuing business as extremely usual) etc.
The main problem is of course this, mentioned in the famous quote by Upton Sinclair: “It is difficult to get a man to understand something when his salary depends on his not understanding it”. In a more blunt wording *the hidden capitalist mechanism of totalitarianism* (first and foremost being practised in the state capitalism of stalinist Russia – later China etc. – and all the fascist dictatorships. It is obviously an illusion that capitalism inevitably leads to democracy. Historically seen that isn’t true. “Communism” in fact has been the “eastern” and undemocratic road to capitalism, and fossil capitalism in fact proves to be at the core of all utopian expectations about endless growth of the “productive forces”, consumption etc. In the longer run the fossil wealth and “progress” seems to be ending as a very short-lived “adventure” of burning “old sunshine” – fossilized ancient solar energy – after just a few hundred years, resulting in another big global catastrophic event of extinction of many species, and maybe all humans).
This mentioned by Upton Sinclair is the main reason why the fight is now more and more being led by retired scientists…
*What we need now is the revolutionary, stubborn spirit of intransigent resistance shown by Churchill in 1940. The blunt, clear and unforgiving presentation of the simple facts about what is happening to our future climate and the global ecosystems, if the politics aren’t radically changed, and immidiatly*.
If the politics were to be radically changed immediately, how would that affect future climates and your forecast of mass extinctions? In other words, what should be done to “fight” a changing climate other than more rhetoric?
Have heard hints only of impact on EASTERN Mediterranean of/when AMOC collapse. Given that area has already become the hot spot of Europe, and the complexity of Med current systems, it sees possible. Have you any info/thoughts on this? Thanks.
Stefan, I have a suggestion about the presentation of your analysis.
Fig 1 and 2 are very confusing, and seem distorted. If you want “the public”, including people with a science background, to relate, you need to provide better graphics with some reference points and information.
Maybe I’m just getting old, but I’m quite familiar with the fact of increased temps off the US coast, and the coastline itself, but it still took me several headshakes to recognize the actual locations.
I’m pretty sure there are a lot of student types around with the knowledge and skills to create a look more at the level of what the competition is doing. Probably work cheap or even for free.
[Response: Are you talking about the map projection? That is a deliberate choice, the view from space from a large distance from above the ‘cold blob’. It focuses gently on the central area of concern without distorting the size of areas too much. A lot of the maps you otherwise see are extremely far from equal area and heavily distorted (e.g. Greenland larger than India…) – but admittedly look more familiar to many people. Is that your point? -Stefan]