The WMO released its (now) annual state of the climate report this week. As well as the (now) standard set of graphs related to increasing greenhouse gas concentrations, rising temperatures, reducing glacier mass, etc., Zeke Hausfather and I wrote up a short synthesis on the contributions to recent temperature anomalies.
Readers will recall our previous discussions on the anomalies in 2023 in particular, and the myriad of ideas that people have published to explain them. Following on from our AGU session on the topic in December, we were asked to provide a brief synthesis of the results so far. To our knowledge, this is the first quantitative attribution of the anomalies to specific processes (but it will clearly be not the last word).
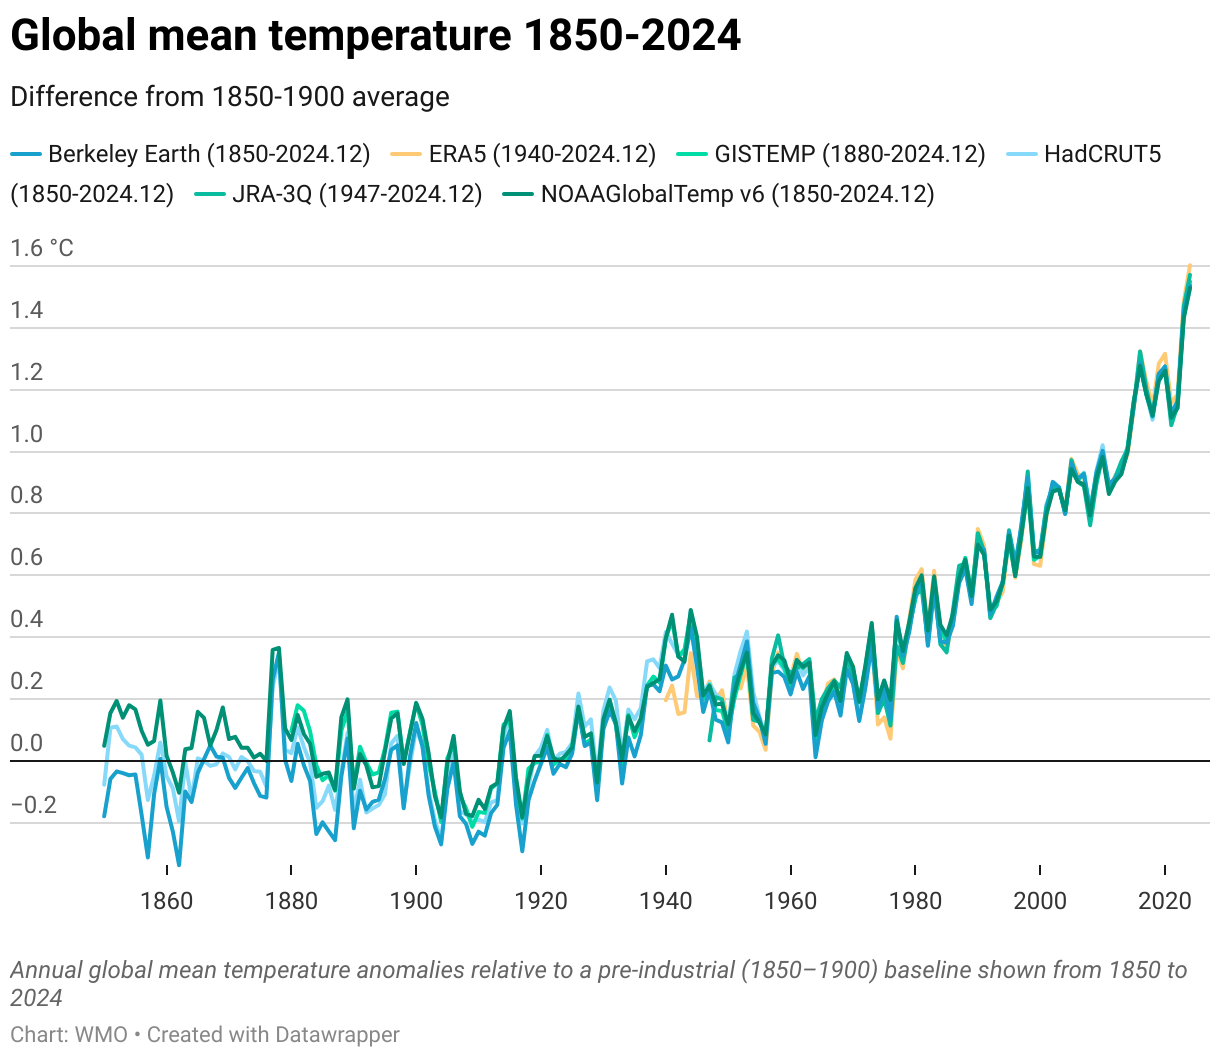
First, what are we trying to explain? It is not the long term trends! The rise of temperature by ~1.5ºC since the 1850-1900 baseline is very clearly associated with the increases in greenhouse gases, slightly (and decreasingly) modulated by the changes in atmospheric pollution. Rather, we are trying to explain the residuals from that trend – why any year (or years) is much warmer or cooler than the trend. There is always something of course – the weather is variable – but for 2023 and 2024 the residuals were higher than for any other year in decades. And, as you will recall, the anomalies in 2023 specifically were not well forecast ahead of time.
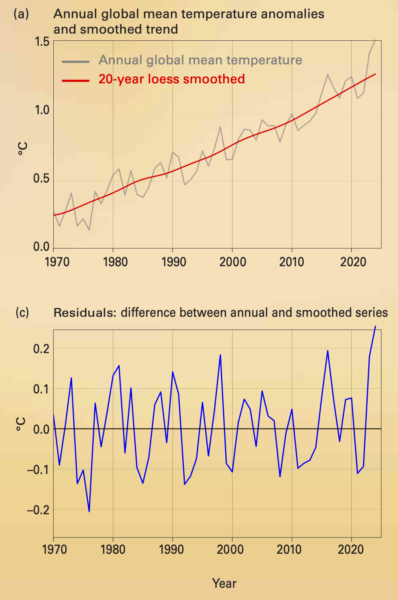
We assessed the long term trend using a 20 yr loess smooth in the WMO timeseries to 2022 (which was then projected forwarded to 2024), and defined the residuals as the difference from that trend. A loess smooth has a little more structure than a linear regression, and we deliberately did not use the last two data points to define it. There is a very slight acceleration from 2000 onward in the smoothed curve, but this isn’t material for our analysis.
As you can see though, the size of the residual for 2023 was comparable to 2016 and 1998 (years that started with large El Niño events), and 2024 had the highest residual in decades despite the recent El Niño only being a moderate event. We estimated the impacts of ENSO from a statistical regression of the residuals against the Feb/Mar Nino34 index, which implicitly assumes that the El Niño in 2023/24 had similar impacts to previous events.
We estimated the other potential components from a combination of statistical modeling (for the solar cycle) and published radiative forcing estimates (for the impact of marine shipping emissions and Hunga Tonga) converted to temperature anomalies using the FaIR emulator. The impacts of East Asian SO2 emission changes (which have dropped precipitously since ~2005) are noticeable in the global mean trends, but because they have been relatively smooth, the impact on the 2023/4 residuals is small.
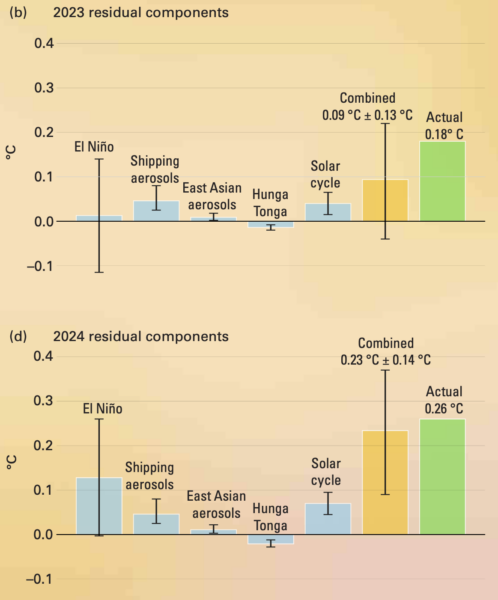
A number of things stand out. There is a clear contribution to the residuals in both years from the shipping aerosol changes as has been widely expected, but given the published estimates of the radiative forcings, these contributions are only a fraction of the observed residuals. Indeed, we estimate that the contribution from the solar cycle has been comparably large. We estimate that the impact of Hunga Tonga (using the radiative forcing estimates from Schoeberl et al (2024) is actually negative (since the SO2 contribution outweighed the added stratospheric water vapor). We find that ENSO had a negligible impact in 2023, but was a substantial contributor in 2024. And (somewhat to my surprise) the impact of changes in East Asian aerosols was negligible too.
When you sum up the contributions (assuming that they are independent, and taking into account the statistical uncertainties) the expected values fall short of the observations in 2023, but match 2024 quite well. Within the uncertainties (everything here is plotted with a 95% confidence Interval), you could say things line up, but note that the largest uncertainty comes from the modeling of the ENSO effects. More sophisticated modeling might well be able to reduce the uncertainty there.
Thus, the bottom line is, to no-one’s great surprise, that 2023 is harder to explain than 2024. As the community moves towards proper syntheses using ESMs with updated forcings, there may be some adjustments to this picture – the regionality of the aerosol effects might magnify their impact on the global mean temperature, the specifics of the El Niño effect might imply an effect beyond just what can attributed to the Nino3.4 index, and we might get a broader range of effects for the volcano and solar cycle components.
Other new studies
At few other articles on this topic have also appeared recently:
- Allen and Merchant (2025) give a “new interpretation of the drivers of Earth’s energy budget changes and their links to ocean warming”.
- Terhaar et al. (2025) look at jumps in SST in climate models and conclude that “a jump in global sea surface temperatures that breaks the previous record by at least 0.25 °C is a 1-in-512-year event”
- A new preprint from Stefan and Grant Foster is also available: Rahmstorf and Foster (2025) looks at an ENSO corrected data set and concludes that acceleration in SAT is apparent.
Stay tuned!
References
- M.R. Schoeberl, Y. Wang, G. Taha, D.J. Zawada, R. Ueyama, and A. Dessler, "Evolution of the Climate Forcing During the Two Years After the Hunga Tonga‐Hunga Ha'apai Eruption", Journal of Geophysical Research: Atmospheres, vol. 129, 2024. http://dx.doi.org/10.1029/2024JD041296
- R.P. Allan, and C.J. Merchant, "Reconciling Earth’s growing energy imbalance with ocean warming", Environmental Research Letters, vol. 20, pp. 044002, 2025. http://dx.doi.org/10.1088/1748-9326/adb448
- J. Terhaar, F.A. Burger, L. Vogt, T.L. Frölicher, and T.F. Stocker, "Record sea surface temperature jump in 2023–2024 unlikely but not unexpected", Nature, vol. 639, pp. 942-946, 2025. http://dx.doi.org/10.1038/s41586-025-08674-z
- S. Rahmstorf, and G. Foster, "Global Warming has Accelerated Significantly", 2025. http://dx.doi.org/10.21203/rs.3.rs-6079807/v1
A correction to your timeline for the ENSO. The 2016 and 1998 El Niños actually took place in 2015 and 1997. 2016 and 1998 were La Niña events.
Wikipedia…on the 1997-98 ENSO:
“By January 1998, sea surface temperatures off the coast of Peru continued to increase, reaching 11 °C (20 °F) above average. However, the region of cooler than average water in the western Pacific expanded, signifying that a La Niña would take shape in the latter part of 1998. Just two months later, the extent of above-average water temperatures sharply decreased as the El Niño weakened. The 1997–98 ENSO event finally ended during May 1998 as below-average water temperatures extended across much of the Pacific.”
Why do you think a correction is needed? As Gavin put it in the article “the size of the residual for 2023 was comparable to 2016 and 1998 (years that started with large El Niño events). An 11C warm anomaly off Peru in Jan. 1998 is certainly starting the year with a large El Nino.
El Nino events are usually strongest over the (northern hemisphere) winter months, that means it starts in autumn of one year (1997, 2015, 2023, respectively) and weakens during spring of the following year (1998, 2016, 2024). Therefore, El Niño is not an event of a single year, but spreads over two (half) years. However, because there is a time lag between Nino indices (Nino 3.4 or MEI e.g.) and the impact on global temperature of about 4 months, most of the global temperature effect occurs in the second year (1998, 2016, 2024), which when reflecting global temperature are called “El Nino years”.
If the ENSO impact is based on linear regression between two anomalies, shouldn’t the uncertainty in the ENSO effect reside entirely* in the slope parameter rather than the intercept? If so, why is the uncertainty in the 2023 ENSO contribution just as large as the uncertainty in the 2024 ENSO contribution?
*except for a small contribution from the NINO3.4 mean not being perfectly centered around zero
[Response: The uncertainty in the ENSO impact is based on the unexplained spread in the fit. I’ll post the code I used later tonight when I get a chance. – gavin]
https://bsky.app/profile/drjeffmasters.bsky.social/post/3lktk3bfryc2x
10 years of rapidly disentangling drivers of extreme weather disasters – https://www.worldweatherattribution.org/10-years-of-rapidly-disentangling-drivers-of-extreme-weather-disasters/
Given the argument over attribution, I’ve left out the first sentence of this paragraph, which I think is wrong. Some of the rest tends towards hyperbole, but still reflects our changing reality. We can quibble over semantics, but the overall changes are clear and threaten our survival in a variety of ways, direct and indirect:
“It is the vulnerability and the exposure of the population that turns meteorological hazards into humanitarian disasters. Increasingly though, there are fewer and fewer meteorological hazards that can be purely described as ‘natural’. Our work, alongside the wider scientific literature, now shows that with every ton of coal, oil and gas burned, all heatwaves get hotter, and the overwhelming majority of heavy rainfall events, droughts, and tropical cyclones get more intense.”
I recommend the article despite what I consider to be slightly overhyped claims.
Given the supposed overhypers have been more accurate than the underhypers for the last twenty years, at least, one wonders when the underhypers are going to realize there is no “overhyping” going on, we’re just more accurate because we aren’t dragged down by scientific reticence.
Maybe take a gander at ASI over the winter. Lots of record lows by all three metrics. As predicted. By me. Based on the effect I proposed all the way back in 2015 and since supported by papers in 2018 and 2021.
Hmmm… Those pesky overhypers!
K: yes, thanks. I hoped to get those inclined to quibble to look at the bigger and all too obvious situation which is all around us. The attribution effort is bold and brave, and those willing to attack anything and everything that gets in the way of making things worse and seeing what happens are a cancer on our future.
The effect Killian proposed back in 2015 appears to be the el nino / enso cycles modulating arctic sea ice levels in winter by way of teleconnection. Several scientists also suggested connections around 2015 and earlier. I remember posting some of these studies when Killian raised the issue a few years back, including a study sceptical that there would be a connection. Examples:
“Recent Arctic Sea Ice Variability: Connections to the Arctic Oscillation and the ENSO. Jiping Liu, Judith A. Curry, Yongyun Hu. Geophysical Letters. First published: 13 May 2004”
https://agupubs.onlinelibrary.wiley.com/doi/10.1029/2004gl019858
“Recent climate variation in the Bering and Chukchi seas and its linkages to large scale circulation in the pacific, Sae Kim yeo, Kwang Yul Kim, et al, Springer Nature 2014.” ( They specifically refer to el nino and effects on winter sea ice. The Bering Sea is not part of the Arctic but is just to the south but the concept and connection is the same.)
https://link.springer.com/article/10.1007/s00382-013-2042-z
Interestingly studies suggest that arctic sea ice decline could itself influence el ninos:
“Atmospheric scientists link Arctic Sea loss ice to strong El Niño events”
https://www.preventionweb.net/news/atmospheric-scientists-link-arctic-sea-loss-ice-strong-el-nino-events
Where can one find the raw data for the temperatures from 1970 to the present as depicted in the graph Fig. (a)?
My first comment on the 2016 1998 ENSO must have been deleted.
Ken Towe,
The short synthesis document providing the graphics doesn’t list “the (averaged) six global temperature datasets described in Global temperature data” or seemingly give any working links to such information. However, I’d assume the six are those used in the rest of the WMO report (graphed here). thus BEST, ERA5, GISTEMP LOTI, HadCRUT5, JRA-3Q and NOAA. The two unlinked reanalyses are a little less helpful in giving up their annual global anomaly series but their absence would not significantly effect the average of the other four through recent decades.
The measure that is usually used to define the ENSO cycle is NINO3.4 and that peaks in the year prior to the global response to an El Niño, with the global response being usually used to date the El Niño events. (Weekly ENINO3.4 series.)
“However, I’d assume the six are those used in the rest of the WMO report (graphed here). thus BEST, ERA5, GISTEMP LOTI, HadCRUT5, JRA-3Q and NOAA. ”
From the temperature time series plotted here (replicated url from this blog post): https://datawrapper.dwcdn.net/Cpa3D/full.png
I observe a difference in global average temperature depending on the dataset. The “actual” green temperature bars in figure b and d would be improved by depicting that global temperatures differ depending on the dataset. These “actual” temperature values and bar plot are an “average” of 6 datasets.
When data are depicted as in figure b and d it implys uncertainty ( black bars) in the potential contributing factors, with absolute certainty in global temp ( word “actual” and no black bars). All measurement have uncertainty.
Similarly, fig a in the blog post is not an “Annual global mean temperature” it is an “Average annual global mean temperature based on 6 global mean temperature datasets”
These comments are aimed towards increasing effort to consider data provenance when synthesizing and reporting “observations” using data plots and graphs.
“The measure that is usually used to define the ENSO cycle is NINO3.4 and that peaks in the year prior to the global response to an El Niño, with the global response being usually used to date the El Niño events.”
Exactly… and that is what creates the confusion. for so many.
Given the difference to GISTEMP LOTI for example
https://www.woodfortrees.org/plot/uah6/plot/gistemp/from:1980
where UAH seems to show a very strong warming right after the Tonga eruption, it seems to me that the conclusions in the article above might be significantly different if only the UAH troposphere data would be considered, which seems to be a better temperature product:
In 2023 Zou et al. presented an improved analysis of NOAA satellite data
https://agupubs.onlinelibrary.wiley.com/doi/full/10.1029/2022JD037472
and found
“The UAH V6.0 also had a warming trend relative to STAR V5.0 during 1991–2002 over the ocean, but the magnitude was much smaller than those in STAR V4.1 and RSS V4.0 (Figure 13b).”
(If there indeed were such a systematic difference an analysis not showing that is quite worthless.)
Yebo Kando,
Neither the UAH TLT record nor STAR TLT are used in the analysis described in the OP which uses only SAT records. TLT records do sometimes show a significance from SAT records which should be no surprise given they are measuring different things. This difference could/would also have an impact on the ‘components’
“Would” because one instance of this TLT/SAT difference appears in the period of the OP analysis.
The size of the global temperature increase through 2023 was larger in the TLT records, the +0.18ºC SAT “actual” being +0.20ºC for TLT. And more significant, through 2024 those elevated TLT temps were running +0.3ºC above SAT for most of the year, dropping down to meet SAT only in Dec 2024, with the 2024 averaging +0.26ºC SAT “actual” and +0.46ºC TLT.
>> The size of the global temperature increase through 2023 was larger in the TLT records, the +0.18ºC SAT “actual” being +0.20ºC for TLT.
Surely you meant to write the increase through 2023 was about +0.90ºC for TLT.
https://www.woodfortrees.org/plot/uah6/plot/from:2022
>> Neither the UAH TLT record nor STAR TLT are used
And that indeed was my comment about, concluding with
(If there indeed were such a systematic difference an analysis not showing that is quite worthless.)
yebo kando,
If you wish to practise pendantry, you will need to sharpen your game considerably.
☻ The UAH TLTv6.0 data you point to at WoodForTrees is out-of-date. It is superseded by v6.1. (Perhaps you didn’t notice the absence of v6.0 post-Sept 2024 data.) The reason for the creation of v6.1 was because something was going badly wrong with v6.0 which showed itself from 2019-on with an increasingly divergent anomaly (relative to other TLT records), the error/correction hitting +0.15ºC by 2023. Now erroneous warming of that size is something that even a climate change denier like Roy Spencer could not help but notice.
For ave2022 minus ave2023, the v6.0-v6.1 difference averages +0.05ºC, a 17% increase in the year-to-year warming.
☻ You failed to note in the quote you chose to cite the describe of my comparison. I was comparing SAT “actual” (“actual” as per the bar chart in the OP above) to the TLT increase. (And for the record, the TLT measure I used was the average of UAH, RSS & STAR not UAH alone.) You may think you are somehow justified comparing apples with melons but trust me: you are not. Your comparison (made a little easier due to the UAH TLTv6.0 Jan 2023 anomaly being close to zero) is utterly Trump-bonkers. It doesn’t come anywhere close to an acceptable apple-with-apples comparison. The OP’s “actual” value of +0.18ºC measures the 2023 average relative to a projected pre-2022 underlying AGW rate. To achieve a useful comparison between SAT & TLT, I could have gone to the bother of producing the TLT “20 yr loess smooth in the WMO time-series to 2022 (which was then projected forwarded to 2024)” but I decided that a simpler method would be to take 2022 as the base year and calculate the TLT 2022-23 difference relative to 2022-24 SAT difference as a ‘correction’ to obtain a TLT “actual” adjustment.
☻ You seem to think that failing to use TLT in the calculation of “actual” invalidates the analysis describes in the OP, suggesting it would thus be “quite worthless” due to the difference between the SAT and TLT through the period of interest. Yet, as I stated above, “TLT records do sometimes show a significance from SAT records which should be no surprise given they are measuring different things.“ Thus the “residual components” graphed in the OP would also need adjustment.
Further, if you were familiar with the different TLT records at anything beyond their grand global averages, you would perhaps be less eager to use them. Climate change deniers may love to flaunt TLT records when it suits them, usually as a guiding star on their brave voyages in search of their mythical archipelago. the Greater Urban Heat Islands. But TLT records exhibit some serious variations between themselves as well as relying too much on the empirical use of other temperature data sets to be given such elevated precedence over SAT records.
>> I used was the average of UAH, RSS & STA
>> You seem to think that failing to use TLT in the calculation
I pointed to a publication showing problems with RSS TLT data due to an outdated analysis method
https://agupubs.onlinelibrary.wiley.com/doi/full/10.1029/2022JD037472
“The UAH V6.0 also had a warming trend relative to STAR V5.0 during 1991–2002 over the ocean, but the magnitude was much smaller than those in STAR V4.1 and RSS V4.0 (Figure 13b).”
The fact that you blended bad data into your average makes your analysis completely and unquestionably worthless. You can get any answer you want using bad statistics!
From your
>> the v6.0-v6.1 difference averages +0.05ºC
and my woodsfortrees graph
https://www.woodfortrees.org/plot/uah6/plot/from:2022
I can conclude that the latest UAH raise in that year might not have been +0.90ºC for TLT but about +0.85ºC for TLT.
Still significantly higher than the OP assumes and yes, that makes my statement that any analysis not considering UAH (and of course I meant with correct statistics, it’s a bit sad that I need to add that for you)
“”‘would thus be “quite worthless” due to the difference between the SAT and TLT through the period of interest.”””
still very valid.
>> Climate change deniers may love
who cares? You seems a bit obsessed with those!
The difference between a denier and a sceptic is that the later one uses facts.
Sometimes deniers use wrong facts. Your blending of bad data to distort a valid question could be used as an example (you trying to hide that the UAH TLT shows indeed a high warming signal in 2023 (even when using the 6.1 version, which is of course a good idea) with flawed statistics), are you a climate denier?
Spencer does use facts, even if he might have to change them sometimes as a part of his scientific approach to a complex problem. You are factually wrong calling him a denier and just show your lack of knowledge how to address people.
Yebo Kando, Roy Spencer goes way beyond mere scepticism and fits firmly in the denialist category: Spencer is a signatory to “An Evangelical Declaration on Global Warming”,[30][31] which states that “We believe Earth and its ecosystems—created by God’s intelligent design and infinite power and sustained by His faithful providence—are robust, resilient, self-regulating, and self-correcting, admirably suited for human flourishing, and displaying His glory. Earth’s climate system is no exception. Recent global warming is one of many natural cycles of warming and cooling in geologic history.”[32] ” If that is not denialism of anthropogenic warming, I wonder what is.
https://encyclopedia.pub/entry/37499
Yebo Kando,
So I was wrong to suggest you “sharpen your game considerably” It is apparent you are not able to. It is also apparent that you are unable to grasp the simplest of corrections so engaging further with you to do so is a little pointless, although your comments do provide a certain humour content. “You are factually wrong calling him (Spencer) a denier.” Very droll!!
YK: Spencer does use facts, even if he might have to change them sometimes as a part of his scientific approach to a complex problem. You are factually wrong calling him a denier
BPL: No, we are not. He insists that global warming is very minor and that we must hold onto fossil fuels. He insists that there is no climate crisis. He maintains, without good evidence, that doubling CO2 will result in only 1.5-2.0 K surface temperature increase, which is reasonable though without evidence, but he also maintains that this is too little to worry about. He’s a denier. He’s not an insane denier, like Joseph Postma or Bob Armstrong, but he is firmly in the camp of those who are trying to block doing anything about the crisis.
I count three posts in a row addressed to me which seem not on topic and devoid any scientific argument!
Without turning into a Spencer defender, these posts seem very unclear which proven fact he denies (and also inconsistent with each other).
But again, who cares?
Regardless, they seem very unrelated to my concern of the UHA TLT trend not being properly considered in the OP here, even so I concede Spencer was likely involved generating this data, but so far no one pointed out a significant problem with that.
In this context he clearly generated relevant facts for sceptics, there is no denial involved apart that apparent in those three posts.
One more thought on the topic I was raising:
When MA Rogers says he used “the average of UAH, RSS & STAR” he is talking about data series with differences of more than 0.5K. for the trend in 2023, so the result of his mathematical treatment should consider this as systematic error!
So his numbers above will have huge uncertainties, which seems not helpful at all!
Yebo Kando “Without turning into a Spencer defender, these posts seem very unclear which proven fact he denies (and also inconsistent with each other).”
Spencer is denying that humans are causing the vast majority of anthropogenic climate change, as determined by the IPCC. Spencer claims most of the changes are natural. Therefore he is a denier within that framing of the issue, and has proven it by signing a document (see my comment above). He has also denied a variety of other claims that are widely accepted in the climate science community. Reference:
https://skepticalscience.com/roy_spencer_arg.htm
make that four then. .
Right, you guys heard Yebo. Quit addressing him. By his own admission anything that addresses him is off topic. B’Bye.
Ray Labrury,
Commenter Yebo Kando does say that he has had “One more thought on the topic (he) was raising” about TLT data being excluded from analysis presented in the OP above. This would be on-topic. Yet while Yebo Kando does then attempt to make a sensible contribution, his attempt continues to be founded on an entirely inadequate grasp of the subject which is so bad**, I don’t see correcting him will be of any use to either man-or-beast.
** Specifically, in his previously bleating about RSSv4 TLT (describing it as“bad data”), he presented a quote that applied to RSSv4 TMT. In his latest attempt, Yebo Kando tells us “When MA Rogers says he used “the average of UAH, RSS & STAR” he is talking about data series with differences of more than 0.5K. for the trend in 2023.” This garbled response I would assume is based on the 2022-on plot of RSSv4.0 & UAHv6.0 TLTs presented by WoodForTrees which shows an ‘off-set’ of perhaps 0.5ºC between RSS & UAH, a situation not entirely surprising given they have different anomaly base periods.
First of all thank you for coming back to the question I raised, this alone seems to set you wildly apart from all other posters! (which is kinda sad if you think about it!)
(If anyone does not want to answer to my post that is their choice, but writing a “scientifically empty post” that they would do so, is scam, no matter how famous that poster believes himself to be!!)
>> a situation not entirely surprising given they have different anomaly base periods.
Okay, now you seem to have identified one possible methodical cause for the different trends, a systematic difference just like I commented!.
Assuming that this is the reason, it does not solve my question, which was about the UAH TLT +0.90ºC trend in 2023 (which might be only about +0.85ºC following your argument of a newer version). So, if you say that this higher trend is solely/mostly a result of a different choice in base periods, my arguments:
“””(If there indeed were such a systematic difference an analysis not showing that is quite worthless.)”””
and
“””the result of his [MA Rodger] mathematical treatment should consider this as systematic error!”””
remain fully valid!
The OP and your averaging needs to either invalidate choices of the base period or include the full systematic uncertainty stemming from different valid choices!
@Yebo Kando, re last post in this subthread:
I try to help with communication issues when I can, and here I myself am really having trouble understanding your questions. You keep using the term “systematic”, and perhaps I am not familiar with its use in this context. You also say “one possible methodical cause”. The latter I am guessing as intending “methodological”(?).
Could you clarify the definitions for your terms?
And could you perhaps offer a “plain language” version of your critique? I see lots of words having been written by everyone over what seems a trivial difference; maybe I am missing something because of the jargon.
Dear Zebra,
zebra says 9 Apr 2025 at 8:43 AM
>> You keep using the term “systematic
first google hit for “error progression of systematic errors”
https://www.scribbr.com/methodology/random-vs-systematic-error/
the first image there describes how a “difference in methods” can not be averaged out and blows up uncertainty.
My question was and is a rather simple one..
Most readers here seem to concede that the measured UAH TLT trend in 2023 was rather large, I gave an estimate of UAH TLT +0.90ºC trend in 2023 (which might be only about +0.85ºC following MA Rogers argument of a newer version)
From there I commented:
“”” it seems to me that the conclusions in the article above might be significantly different if only the UAH troposphere data would be considered.”””
MA Rogers also conceded
“””TLT records exhibit some serious variations between themselves “””
and Zou gives strong arguments that the RSS TMT (and the related RSS TLT) might not be the best choices, but that also seems to wildly distract reader from my main point
The jump in UAH and STAR TLT in 2023 is very visible and correlated very well with the stratospheric impact of the Tonga eruption, scanning through the answers to my comment I fail to see many points addressing that. The jump is very clearly way above +0.70ºC and I immediately grow skeptical of handwaving and claims that it’s not really there.
I am still under the impression that if such a jump in the UAH TLT in 2023 would be real, it affects the assumptions in the OP in a significant way.
No, Yebo, your conclusions do not remain valid, because the offset is an artifact of the methodology, and more importantly does not impact the trend itself. There are a couple of ways to understand this. First, you can look at the trends. WfT conveniently allows you to calculate the OLR trend–probably the simplest metric. I’ve done that here:
https://www.woodfortrees.org/plot/uah6/from:2022/plot/rss/from:2022/plot/uah6/from:2022/trend/plot/rss-land/from:2022/trend
If you click on the “Raw Data” tab below the graph, you get this table which gives the following:
uah6 trend: 0.399313 degrees C per year
rss-land trend: 0.323958 degrees C per year
So, reasonably close.
Another way of assessing this is to offset the trends to align the curves. There are statistically ‘proper’ ways to do that, but I’m just going to go ad hoc, since this is just illustrative anyway.
https://www.woodfortrees.org/plot/uah6/from:2022/offset:0.5/plot/rss/from:2022/plot/uah6/from:2022/trend/offset:0.5/plot/rss-land/from:2022/trend
Yebo Kando,
Thank you for your response. I used to use the bullseye image often in teaching about measurement and instrumentation, but it was to explain the (perhaps now archaic) terms “accuracy” and “precision”.
I think I now can address the communication issues in your comments that remain, in my version of “plain language”.
-I still don’t know what it is you are trying to measure. When you criticize the OP and say the “conclusions” would be different if TLT is “considered”, you don’t say what “conclusions” you are talking about, nor do you indicate what “considered” means. How would you incorporate it?
-In order to claim that there is a “systematic error”, it is necessary that you know the “true” value. As has been pointed out, SAT and TLT are measuring different variables with different instrumentation. Again, if you don’t specify what you are measuring, how can there be an “error”?
Oh, I asked about this statement in the OP: “We estimate that the impact of Hunga Tonga (using the radiative forcing estimates from Schoeberl et al (2024) is ac’tually negative (since the SO2 contribution outweighed the added stratospheric water vapor).”
Even in MA Rogers version of the TLT data you can see a jump in temperature of at least +0.70ºC in2023.
side notes (commenting on sniplets by other people)
>> the offset is an artifact of the methodology, and more importantly does not impact the trend itself.
Is not correct, see for example
https://clivebest.com/blog/?p=9275
>> denier denier denier
Anyone who provides valid facts and conclusions to a discussion is not a denier, no matter who it is and you can easily identify factless posts in this very thread
These people at the very least deny a scientific discussion.
>> his RSS is “bad data” assertion
It is not my assertion, but clearly shown on Zou et al. (here it is again https://agupubs.onlinelibrary.wiley.com/doi/full/10.1029/2022JD037472), see for example table 3.
>> TLT & SAT can give differing results, this because they do not measure the same thing.. Given all this, as was made clear to Yebo Kando up-thread,
Hmm..
I specifically asked how “the conclusions in the article above might be significantly different if only the UAH troposphere data would be considered”
Perhaps we can eventually get to this? Somehow it seems that you “answered” about everything but my question!
Your April 25th plot also seems to show a massive temperature rise in the TLT data in 2023, right? Could this be related to the Tonga eruption?
Yebo Kando,
As best I can translate your words, it seems that you believe the Tonga eruption caused the increase in the TLT measurement. But true or false, this has nothing to do with the conclusion in the OP that Tonga had a net negative effect on the increase in the SAT measurement.
You keep repeating the same words with slight variations, and that is not what people interested in a real scientific discussion do.
If you think the conclusion would be different, you should explain your reasoning, using the language of physics.
Yebo Kando,
Your input into this comment thread is very tiresome as you seem entirely incapable of setting out a consistent position.
Thus it is good that you should re-visit your initial comment. Yet even then you do not properly see what you actually wrote. And we can only respond to what you write, not what you think you might have written.
In that initial comment, you first point to the differences between the GISS SAT record and the UAH TLT and for some reason describe UAH as a “better temperature product.” This “better” claim is then strangely supported by referencing Zhou et at (2023) which describes how difficult it is to calibrate TMT temperature records and which concludes that STAR TMT and UAH TMT do a better job than RSS TMT. Note this satellite calibration addresses the period 1995-2005 not 2022-24. Zhou et al is thus irrelevant for quite a number of reasons.
On the strength of this nonsense, you then appear to declare the analysis in the above OP as being “quite worthless” which is strong stuff.
Note that the “question” you now say that you “specifically asked” was never presented as a specific question.
In that initial comment you did raise the issue of the Hunga Tonga eruption. You suggested the UAH data “seems to show a very strong warming right after the Tonga eruption.” In a later comment you tell us this strong warming “correlated very well with the stratospheric impact of the Tonga eruption” and express disappointment that the issue has not been discussed in replies to your comments. (I should say that Jan 2023 is not “right after” Jan 2022 and thus your plan statement of things being “correlated very well” appears entirely unmerited.)
In subsequent comment you did ‘specifically question’ something – that was the OP above on its attributions concerning Hunga Tonga and whether there was “a potential Tonga influence missing” but give no serious reason for considering such omission.
Hunga Tonga has presented an interesting situation for climatology, the eruption causing both cooling and warming influences which would last for differing lengths of time. Thus it is not inconceivable that a warming results after a delay of 12 months, even a strong warming. Yet the general consensus (as per the OP above) is that the impact remains cooling not warming through 2022-23 and also, by 2024 it has largely dissipated, as per Schoeberl et al (2024). If you find this general consensus is at odds with your view of it all, you will need more than your own personal “impression” to show others your view is worthy of consideration.
And I would be pleased if you could stop misrepresenting my comments so frequently.
zebra says
>> You keep repeating the same words with slight variations, and that is not what people interested in a real scientific discussion do.
MA Rodger says
>> Your input into this comment thread is very tiresome as you seem entirely incapable of setting out a consistent position.
I guess it is unintentional. but you guys are funny!
zebra says
>> it seems that you believe the Tonga eruption caused the increase in the TLT measurement. But true or false, this has nothing to do with the conclusion in the OP that Tonga had a net negative effect on the increase in the SAT measurement.
First and foremost of all of all, my believes are absolutely non of your business!
MA Rodger says
>> Thus it is not inconceivable that a warming results after a delay of 12 months, even a strong warming.
You guys really write like Ying and Yang!
>> Yet the general consensus (as per the OP above) is that the impact remains cooling not warming through 2022-23
It seems to me now a consensus is called in rather than addressing my question.
I think we can agree that there is an exceptionally strong warming trend apparent for the UAH TLT data for 2023. with one possible explanation for it being that Tonga event
(I do think correlation is the right word here, but there is a time lapse as MA Rodger describes in his latest post)
Then I get accused to
>> give no serious reason for considering such omission.
followed by a good potential reason to consider the event:
>> Hunga Tonga has presented an interesting situation for climatology, the eruption causing both cooling and warming influences which would last for differing lengths of time. Thus it is not inconceivable that a warming results after a delay of 12 months, even a strong warming.
>> Note that the “question” you now say that you “specifically asked” was never presented as a specific question.
Well, technically “it seems to me that the conclusions in the article above might be significantly different if only the UAH troposphere data would be considered” is indeed not a question, however it has not been addressed so far either!
“The consensus said so” is never a very satisfying answer!
(I would guess that most climate scientists actually never really worried much about the causes for UAH TLT trend in 2023, so that seems a bit a bold claim!)
Would the OP conclusions need to be revised if the UAH TLT 2023 warming trend was related to the Tonga event?
“”””“The consensus said so” is never a very satisfying answer!”””””
Yes this is very true. Many commenters seem to struggle when stepping outside the boundaries of consensus, which often leads to questionable or low-quality responses, distortion, and a lot of BS. This may simply be a reflection of the mission of the site; I don’t know.
Perhaps consider exploring Bayesian method to check if the probability of Hunga Tonga having a positive impact is non-zero. Bayesian approach emphasizes assigning probabilities to propositions rather than making binary judgements. This is the best way I’m aware to provide objectivity.
The absence of a clear alternative explanation for the 2023–2024-2025 spike (beyond gradual CO2, moderate El Niño, unknown aerosol forcing, forced circulation pattern effects) could lead to the conclusion that dismissing Hunga Tonga prematurely was a consensus-driven error. I don’t know. There should be at least some doubt considering conclusions are formed by peers within a discipline that seems almost proudly biased.
The consensus strongly favors no effect, but the lack of a definitive explanation warrants caution. There’s little value in solidifying beliefs using incomplete priors, especially when data continues to be updated and the fascinating anomaly has yet to be fully dispersed.
JCM: Many commenters seem to struggle when stepping outside the boundaries of consensus, which often leads to questionable or low-quality responses, distortion, and a lot of BS.
BPL: Gosh darn that scientific consensus! People should just accept whatever lunatic idea I dream up! If they don’t, they’re blindfolded by groupthink!
Dear Kevin McKinney,
you lost me there a bit, would you kindly explain a bit better, which of “my conclusions” is contradicted by your display of trends? (My wording might confuse people, but I was not trying to “conclude” anything, but had and have a question about a potential Tonga influence missing in the OP discussion)
I modified your first graph a little to make more obvious how the jump in 2023 does NOT align with your trends:
https://www.woodfortrees.org/plot/uah6/from:2023/to:2024/plot/rss/from:2023/to:2024/plot/uah6/from:2022/trend/plot/rss-land/from:2022/trend
There very clearly seems something else to be going on, I believe it could be related to the Tonga eruption and omitting this in the OP is a serious mistake.
However, thanks to you effort we now have one more way to display my question!
It sounds as though you are connecting my comment with the wrong one of yours. I was responding to your post of April 6, not the one from the 10th. And sorry for saying “conclusions” when you had used the term “arguments.”
I was attempting to explain how baselines work, and the salient fact that they don’t affect trend. And my impression is that discrepancies between data sets comparable to the one you illustrate in the April 10 are pretty common.
To illustrate the nonsense being spouted by this Yebo Kando, I have plotted out a graphic of TLT & SAT data HERE – POSTED 11/4/25. It shows his RSS is “bad data” assertion is evidently nonsense and also that the TLT & SAT can give differing results, this because they do not measure the same thing.. Given all this, as was made clear to Yebo Kando up-thread, the average 2023 anomalies (relative to 2022) are very similar with the early 2023 SAT being warmer while the late 2023 TLT were warmer. It is the 2023 average & 2024 average relative to the long-term projection which is presented as the “actual” in the OP above, not the difference between Jan 2023 & max 2023.
The other dispute at issue, Roy Spencer denies being a climate change denier, but this is not unexpected as those in denial do find the truth difficult to accept.
MA Rodger: nice useful graph. For Americans, I note its date is 11 April 2025, so it’s worth a look. We’re bad about dates that way. [I see there’s more in that link for those interested.]
Regarding the latest by MA Rodger says
16 Apr 2025 at 5:07 AM
“And I would be pleased if you could stop misrepresenting my comments so frequently.”
So says one of the main people who have repeatedly misrepresented Yebo Kando comments. He did not misrepresent MA Rodger once.
DEAR Yebo Kando,
These people here are incapable of hearing what you said in the beginning and at anytime since. I suggest you do not waste your time further, as they are not interested in what you had or still have to say about the topic. You may as well talk to a wall.
I will bold the parts they have continually ignored fwiw.
Yebo Kando says
23 Mar 2025 at 2:37 PM
Given the difference to GISTEMP LOTI for example
https://www.woodfortrees.org/plot/uah6/plot/gistemp/from:1980
where UAH seems to show a very strong warming right after the Tonga eruption, it seems to me that the conclusions in the article above might be significantly different if only the UAH troposphere data would be considered, which seems to be a better temperature product:
In 2023 Zou et al. presented an improved analysis of NOAA satellite data
https://agupubs.onlinelibrary.wiley.com/doi/full/10.1029/2022JD037472
and found
“The UAH V6.0 also had a warming trend relative to STAR V5.0 during 1991–2002 over the ocean, but the magnitude was much smaller than those in STAR V4.1 and RSS V4.0 (Figure 13b).”
( If there indeed were such a systematic difference an analysis not showing that is quite worthless.)
———————————-
The End
Poor Yebo, I feel for you.
Dear Poor Peru,
I understand that everybody seems to hold the truth here religiously and MA Rogers and others rightfully pointed to some strong statements I made which are not justified.
I don’ t think I was misrepresented and would mostly criticize various statements on R. Spencer who is not here to defend himself and provided helpful information for my point.
The other strange point is a call to a consensus in this context, even MA Rogers calls a delayed Tonga influence on the UAH TLT conceivable.
Overall, his comments were indeed helpful to clear up my initial comment, but you are correct, it still remains unanswered!
>> ( If there indeed were such a systematic difference an analysis not showing that is quite worthless.)
Is still at the core of my comment. if it is at all possible that the Tonga eruption caused a warming signal in the +0.5ºC or above range in 2023, writing “but the consensus does not think so!” is clearly not enough.
YK: everybody seems to hold the truth here religiously
BPL: And since we all know religion is bad, calling the scientific consensus on global warming religious will convince everyone that it’s wrong.
Gavin said above:
I couldn’t get the comment to post here (maybe too many URLs?), so this is a link to what I wanted to say
https://github.com/orgs/azimuth-project/discussions/6#discussioncomment-12597910
I’m a bit puzzled by the tiny contribution of El Nino to the 2023 anomaly.
The 2023 El Nino was somewhat different from previous El Nino’s in that it started soon after La Nina ended. Partly because of that, I presume, 2023 saw a sharp transition in temperature anomalies from the first half to the second half of the year. That brings up the question how suitable the February/March Niño 3.4 index is to diagnose the El Nino impact on the year 2023? Could it lead to an underestimate of its potential impact? (I’m aware of the time lags involved, which Urs Neu described in an earlier comment)
Another question is about the role of other factors/feedbacks in bumping up the temperatures in 2023 and 2024, as described e.g. by Copernicus (https://climate.copernicus.eu/global-climate-highlights-2024#dda8fc1d-e416-4c02-b20c-6705c223d950): reduced amounts of low-level cloud and an amplified feedback from water vapor due to the very warm global ocean (from the second half of 2023 onwards). Would you say that these are good candidates for the unexplained portion of your analyses (in figures b and d), e.g. having likely played a stronger role in 2023 than in 2024? That wouldn’t be entirely consistent with the SST patterns seen in both years though.
[Response: The target metric here, the residual from the long term trend, is a bit different from what we normally look at. I’m not sure how to link that to the feedback analysis and the clouds change – I’m waiting for the CERESMIP runs to provide some insight there. The uncertainties on the ENSO part do include lots of non-ENSO effects (i.e. they are what’s left when you abstract ENSO (and volcanoes) from the annual residuals). I’ve played around with more complicated ENSO dependencies (beginning and end of the year, annual values, 12 mon means etc.) but I’ve not found anything that increases the skill of the regression appreciably. If you have a different idea, it’s easy enough to rerun. – gavin]
This paper https://www.nature.com/articles/s41612-025-00956-7 focuses on the spring predictability barrier of ENSO and how that drives all the uncertainty, extending through the rest of the Pacific and into the Indian and Atlantic Oceans. As I’ve been harping about for years, there’s much to be said for modeling the ocean response as an erratically directed but regular impulse .
Just one set of charts to look at that should convince anyone on just how predictable ALL these ocean indices are given a precisely calibrated force (I’m afraid to say the magic word that will send this comment to the dumpster)
https://github.com/orgs/azimuth-project/discussions/17#discussioncomment-12621276
Absolutely no doubt that a machine learning cross-validating experiment will find the same result.
Regarding the article’s closeing:
Within the uncertainties (everything here is plotted with a 95% confidence Interval), you could say things line up, but note that the largest uncertainty comes from the modeling of the ENSO effects. More sophisticated modeling might well be able to reduce the uncertainty there.
Thus, the bottom line is, to no-one’s great surprise, that 2023 is harder to explain than 2024. As the community moves towards proper syntheses using ESMs with updated forcings, there may be some adjustments to this picture – the regionality of the aerosol effects might magnify their impact on the global mean temperature, the specifics of the El Niño effect might imply an effect beyond just what can attributed to the Nino3.4 index, and we might get a broader range of effects for the volcano and solar cycle components.
and various comments about ENSO, and Artificial Intelligence potential to improve “modelling” outputs and the “quantitative attribution of the anomalies” – I found the following recent papers which may provide some additional insights for readers about near term directions/improvements plus overall revaluation of “modelling outputs” This material was via NOAA and their Climate Program Office’s Climate Variability & Predictability (CVP) program
New research offers insights into why climate models often get spring El Niño forecasts wrong
March 21, 2025
https://cpo.noaa.gov/new-research-offers-insights-into-why-climate-models-often-get-spring-el-nino-forecasts-wrong/
Understanding spring forecast El Niño false alarms in the North American Multi-Model Ensemble
Aaron FZ Levine
https://www.nature.com/articles/s41612-025-00956-7
Confronting climate models with observations: a global assessment of simulated and historical climate trends
March 21, 2025
https://cpo.noaa.gov/confronting-climate-models-with-observations-a-global-assessment-of-simulated-and-historical-climate-trends/
Confronting Earth System Model trends with observations
Isla R. Simpson
https://www.science.org/doi/10.1126/sciadv.adt8035
AI methods enhance rainfall and ocean forecasting in climate model
March 7, 2025
https://cpo.noaa.gov/ai-methods-enhance-rainfall-and-ocean-forecasting-in-climate-model/
South American Intraseasonal Oscillation: EOF and Neural Network Approaches
Camila R. Sapucci,
https://agupubs.onlinelibrary.wiley.com/doi/10.1029/2024JD041988?af=R
Learning Propagators for Sea Surface Height Forecasts Using Koopman Autoencoders
Andrew E. Brettin
https://agupubs.onlinelibrary.wiley.com/doi/10.1029/2024GL112835?af=R
Important extract: https://www.science.org/doi/10.1126/sciadv.adt8035#sec-5
Artificial intelligence and machine learning
AI/ML are pushing the frontiers of climate modeling (171), and they can also contribute to identifying sources of trend discrepancies. As highlighted so far in this review, a key challenge in confronting ESM trends with observations is diagnosing the forced and unforced contributions to the particular realization of the real world that has been observed. Methods of varying complexity, ranging from classical regression approaches to neural networks, have been used to identify the climate change signal from among the noise of internal variability in observations. Examples include dynamical adjustment (172, 173), linear inverse models (174), low-frequency component analysis (175), AI/ML, or regression models (176–179). These methods have been shown to reduce the number of ensemble members needed to estimate the forced response and to allow an estimate of the forced response from single realizations (173, 175, 179). This allows comparison of ESM trends with observations even when large ensembles are not available and reduces the contribution of internal variability to any remaining trend discrepancy. The Forced Component Estimation Statistical Method Intercomparison Project (ForceSMIP) is currently comparing 30 different methods for isolating the forced response from single realizations; they find that novel AI/ML methods perform comparably or slightly better than existing statistical methods, but it is worth noting that these AI/ML methods have potential for further improvement. A related potential application of AI/ML methods is in identifying contributions from different external forcings (e.g., greenhouse gasses, anthropogenic aerosols, and volcanoes) to historical climate change, which could build on existing methods for detection and attribution [e.g., (180, 181)].
In addition to the usage of AI/ML in climate data analysis, the utility of AI/ML for improving climate models is also being explored, with different applications using it either to parameterize unresolved processes (182–184) or to completely replace entire components of the ESM (185, 186). AI/ML are also actively being used to help improve the estimation of unconstrained model parameters within existing parameterizations (187, 188) or to learn model errors to develop bias correction schemes (189). Last, AI/ML has the potential to aid in the generation of larger ensemble sizes through emulation of model or observation-based data (190), which could aid in the statistical comparison between models and observations, and to also help improve the observational record used for comparison to models by providing approaches to infill or interpolate sparse observational datasets for comparison with ESMs [e.g., (191)].
FUTURE CONFRONTATIONS
We conclude with a discussion of potential priorities and future opportunities for the climate science community over the next few decades. We anticipate that the upcoming decades will be a critical time for climate prediction as anthropogenic signals emerge in more parts of the climate system and the fidelity of climate predictions is quantified in real time. However, for some features, such as coupled ocean-atmosphere changes, it may still remain difficult to separate anthropogenic climate change from internal decadal-to-multidecadal variability in the climate system.
One critical priority over the upcoming decades will be maintaining and improving long-term climate observational records. This includes paleoclimate reconstructions, which can provide an additional constraint on ESM behavior, e.g., (192). Long-term continuous observational records are essential for monitoring the emergence of climate change, quantifying decadal variability, and evaluating models.
Possible future gaps in critical observational records, such as the Earth’s TOA radiation budget, would be a serious setback for the climate science community [e.g., (193, 194)]. We recommend that climate modelers regularly advocate for maintenance of the existing observational records that are most critical for climate model development and work closely with observational experts to develop new datasets that would be particularly useful for climate model evaluation. Additionally, we recommend that all climate observational records clearly document uncertainty estimates with language that is accessible to nonspecialists so that any comparison of climate model trends with observations is informed by the appropriate observational uncertainty estimates.
Finally, while the next decade of data will be especially useful for quantifying trends, new techniques should be explored to take advantage of more existing historical observations to reconstruct additional climate records back in time to provide longer-term context [e.g., (195)].
Another key opportunity for the climate science community will be to improve the existing model-observational comparison cycle. At present, the CMIP coordinates a large set of climate model experiments conducted by global modeling centers approximately every 7 years, which are subsequently analyzed by climate scientists worldwide. The CMIP process has resulted in a wealth of knowledge on the climate system, but it is a substantial burden on global modeling centers and many of the discrepancies between observed and historical trends have persisted across the CMIP generations. In this era of rapidly evolving climate, a more frequent, smaller set of experiments, alongside a larger interval between large CMIP efforts, which would allow more time for substantial model development, may be of greater value to the climate science community.
This smaller, more frequent, set of experiments could include extending historical radiative forcing and prescribed SST simulation on a yearly basis, as proposed by the CERESMIP project (196). These frequently updated experiments would allow for a near real-time assessment of trends and more timely identification of potential climate model biases, which are crucial to detect and address quickly in a period of a rapidly changing climate.
More effort should also be made to account for uncertainty in historical radiative forcing, such as running experiments with multiple plausible historical forcings from 1850 to present-day, given that incorrect historical forcings, such as from aerosols, input into models can lead to apparent discrepancies between model and observed trends [e.g., (72, 106, 107)].
Finally, and perhaps most importantly, improved communication is needed between climate analysts and model developers to ensure that model development choices are made with a view toward understanding, and ultimately reducing, known discrepancies in trends between models and the observational record. A particular challenge is how to bring in knowledge from many multimodel evaluation studies to influence model development at individual modeling centers.
Another informative extract: https://www.science.org/doi/10.1126/sciadv.adt8035#sec-5
The juice is in the references as usual.
CUTTING-EDGE METHODS FOR IDENTIFYING SOURCES OF DISCREPANCIES
The last decade has seen improvements in observational products and reanalyses, and more modeling centers running large ensembles and single-forcing large ensembles, all of which have improved our capability to evaluate and understand ESM trends through comparison with observations. As we look to the future, we discuss several cutting-edge methods where the potential to understand the sources of trend discrepancies between ESMs and observations has not yet been fully realized: Initialized hindcast systems offer the potential to examine how model errors evolve in a more constrained environment; increasing resolution offers the potential to improve the representation of small-scale processes in the atmosphere and ocean; and artificial intelligence and machine learning (AI/ML) is an emerging area that could aid in a number of areas of relevance to evaluating model trends.
Initialized hindcasts
Climate models are often the same, or very similar, to models used for initialized near-term prediction, for example, on seasonal or decadal timescales. This opens up an important avenue along which to explore model uncertainties, in particular through analysis of hindcast datasets. These are routinely produced for the purposes of forecast validation and consist of a series of short simulations attempting to “forecast” past years or seasons from observation-based initial conditions.
Such hindcast sets offer several advantages for studying model behavior as they
(i) typically cover the recent few decades,
(ii) are often relatively high-resolution coupled modeling systems,
(iii) have smaller initial biases due to the frequent re-initialization,
(iv) can be validated against observations in a forecasting sense, and
(v) are also constrained by the initialization to track the observed system in terms of large-scale modes of variability (e.g., El Nino Southern Oscillation, Atlantic Multi Decadal Variability, and Pacific Decadal Oscillation).
They can be used for studying trends by simply considering the forecasts as a set of simulations of individual seasons or years, and then taking the multidecadal trend over this set, although challenges could arise if the drift of these models from the observation-based initial state is not stationary in time (157). Despite these challenges, we argue that this presents a promising resource for investigating discrepancies in recent trends.
Several important climate model biases have been found to develop on relatively short timescales in forecast mode, sometimes within hours [e.g., Southern Ocean cloud biases; (158)]. Likewise, prediction systems have been found to feature errors in multidecadal trends, which develop during the simulation period of each short, initialized forecast (159).
Beverley et al. (160) demonstrated striking similarity between ensemble mean trend errors in seasonal prediction systems and CMIP6 models in a range of variables including SST, precipitation, and atmospheric circulation. They interpreted the rapid development of these errors as a signal of the importance of atmospheric processes, and further suggested that this indicates that the model’s mean-state bias is not independent of the external forcing.
Another application of seasonal hindcasts exploits the spread in these ensembles over the hindcast period to provide estimates of plausible recent trends that arise from both the predictable signal and the unpredictable noise, analogous to the way in which hindcast simulations have been used as plausible event sets to inform on present-day climate risks of extreme events (161). Thomas et al. (162) used a long hindcast set to study simulated trends since 1980, finding striking differences in ensemble spread in the system. Amplified Arctic warming trends, for example, are surprisingly unconstrained by initialization, although patterns such as AMV and PDO follow the observations closely. In contrast, while there is some spread in mid-latitude jet trends, the hindcasts add confidence to the emergence of a general poleward jet shift on the global scale (104).
Higher resolution
Climate model resolution has gradually increased over the past several decades, from a typical horizontal resolution of roughly 500 km at the time of the IPCC 1st Assessment Report to roughly 200 km at the time of the IPCC 3rd Assessment Report and roughly 100 km at the time of the IPCC 5th Assessment Report. Many modeling centers are now exploring the benefits of even higher horizontal resolution of O(10 km) or O(1 km). This poses opportunities for identifying sources of discrepancies in climate model trends, because these high-resolution models reduce the reliance on parameterizations, which are the primary source of model structural uncertainty (163).
The highest resolution models for which full CMIP-type historical simulations have been run have roughly 25-km horizontal resolution in the atmosphere and roughly 10-km horizontal resolution in the ocean (164), allowing better representation of ocean mesoscale eddies, atmospheric fronts, and topography than in typical O(100 km) resolution CMIP6 models. Of these, only one that we are aware of [CESM1-HR, (151)] has released data from multiple ensemble members over the historical period, as is needed to distinguish between forced responses and internal variability. This model shows historical trends in SST, atmospheric circulation, and precipitation that look more like observed trends and improved multiyear prediction skill for initialized hindcasts (83).
Are you saying that the rate of climate change has increased ?
You decide.
https://climatechangetracker.org/global-warming/monthly-earths-energy-imbalance
https://tamino.wordpress.com/2025/03/26/questions-and-answers/
linked preprint (not peer reviewed: Brief Communication: Global Warming has Accelerated Significantly Stefan Rahmstorf and Grant Foster – https://www.researchsquare.com/article/rs-6079807/v1
[If RC doesn’t post it first, I’ll link again on April’s Unforced Variations [perhaps they’re planning to do so later, but I presume to put it here in the meantime]
Potsdam can relax now that Trump has announced his Strategic AMOC Initiative to numb down the Gulf of America Stream
https://x.com/RussellSeitz/status/1907181130144694707
Gavin:
Your “Stay tuned!” sign-off, following Stefan’s post on the disappearance of Andean and other mountain glaciers around the world, tells this non-scientist the following:
By the time climatologists, et al., have both collected and analyzed all of the data it will take to reach (majority) consensus among all relevant science domains and communities in order for urgent policy recommendations to be both formulated, enacted, and heeded worldwide–let us say, quite optimistically, within ten years but perhaps more realistically twenty years–critical tipping points will already have been passed, and feedback loop dynamics will have begun to make Technogenic Climate Change both inexorable and a runaway process. Thereafter, no one will be able to supply substantive mitigating efforts, and no coordinated efforts will be able then to avert the likely outcomes we have already begun to anticipate.
What is occurring in real time today will persist at least through the next decade or two: and again, by the end of either ten or twenty years, tipping points will have been passed, feedback loops will begin driving climate dynamics worldwide. The data for consensus have not yet been collected and analyzed (the relevant data may not presently in fact exist), but by the time they are assembled, the consensus quite likely will have arrived too late.
Distinctly bad timing for the history of science, since I also cannot help but think that our “Golden Age of Astronomy” will be among the first casualties once terrestrial concerns overwhelm cosmic curiosities. Even Earth observatories will lose status when all that can be done is to watch the terrestrial disruptions occur without any prospects of intervening. I doubt that mapping global climate changes will enjoy much appeal even among scientists for too long (perhaps AI-powered satellites will be entrusted with collecting all the bad news).
As far as I’m concerned, Technogenic Climate Change has already arrived, and as we post items here through 2025 CE it is becoming inexorable. Just as we have all contributed to it, all of us continue to contribute to it, every day: so yes, even “Technogenic” Climate Change has an anthropogenic component.
I think we will have demonstrated for any posterity that this small planet cannot reasonably accommodate the appetites and consumption preferences of more than a billion or two hominins at any one time. Whatever economies of scale have made contemporary climatological data collection and assessment possible are the same economies of scale that will have made Technogenic Climate Change inexorable. (An ironic feedback loop of its own.)
Keep well, keep up all good work, keep us posted: but I think it’s already later than we yet dare to admit.
Sincerely,
Edward Burke
Edward, not disagreeing with this at all except my bold here:
“By the time climatologists, et al., have both collected and analyzed all of the data it will take to reach (majority) consensus among all relevant science domains and communities in order for urgent policy recommendations to be both formulated, enacted, and heeded worldwide– ”
“Better” academic science is not going to have any effect on the behavior of governments. I’m not even clear on what level of destruction of life, property, economic well-being, would result in changes necessary to reduce the harm for the next generations.
What I have been suggesting is putting more effort into localizing (at various scales) the interaction with the public, in a way that relates what is predicted to what happens. And even that is a difficult project, since we can’t claim that there is some quick fix.
Zebra:
Thank you for your response.
While data and measurements continue to be collected and analyzed, I think in addition to the inevitable arrival of full-blown Technogenic Climate Change, poor beleaguered humanity will be overwhelmed with what begins to arrive. Life of necessity will change for us all, and for most of us quite significantly: more abruptly in some locales than in others, more tragically in some places than in others.
One of the first things to begin to guard against is any onset of global or local fatalism, the pretense that we human beings can ourselves contribute nothing to reducing our own contributions and curbing our own appetites in all areas of economic participation: food and beverage consumption, clothing and apparel, travel and commuting (or migrating), residency and location siting, work and education pursuits, energy consumption of all kinds with personal surveys of all tech commitments, et cetera.
If we do not begin to address this year (2025) the foregoing, then, as you observe, by the time policy recommendations worth the making are available to national governments and local governing bodies, that much more time will have simply vanished. If anyone is serious in 2025, certainly no one can afford simply to wait for governing bodies to speak or to act–because the burden of Technogenic Climate Change will fall upon all of humanity in time, we poor beleaguered human beings cannot afford to wait on government policy initiatives to be formulated, enacted, implemented, and heeded: we no longer have the time to wait. We have to begin taking initiative ourselves for ourselves, with whatever measured perspectives we dare aspire to. (I assume that mindless panic will not take root while humanity-at-large ponders just how serious circumstances become across the transition year-by-year.)
I hope we can begin to see clearly with what evidence we have in hand already. One of the reasons I have come to my own determination regarding TCC is the godawful state of journalism, and “science journalism” especially, here in the U. S. Something slapped me hard recently as I was seeing headline after headline speaking of the threats of “sinking cities”–not “rising sea-levels”, mind you, “sinking cities”. Oh yes: subsidence and ground saturation are parts of the problem, but this style of editorialized “science reporting” contributes to obscuring the plain fact that sea-level rise has clearly been linked to atmospheric carbon releases accumulated since at least 1800. The more complicated climate dynamics for assessing TCC-onset do still await legitimate consensus-building as the data and analyses thereof permit the refinement of models that begin to illustrate what is happening before our eyes (or in our rear-view mirrors). –but had science journalists been eager over the past half-century to report science news instead of dumbing down public discourse consistently, global citizens would be better-informed today (their dubious primary and secondary educations notwithstanding) on what we do know about atmospheric carbon’s contributions to sea-level rise, at the very least. –so it is not at all too late to begin to insist upon clarity and substance in public discourse. Publics treated as “stupid” by public discourse managers will quite very likely only conform to professional expectations.
Enough from me. As I exit here for now, while the challenges and threats of TCC emerge across coming decades, we need to keep human agency front and center without waiting for governments to “act”, we need to watch for and guard against passivity and fatalism taking root, and we can make some good use of time insisting upon clear and substantive public discourse going forward. Anyone who cares to stay busy and productive will find plenty of work to do, and as you said, with a lot of necessary focus on local actions, since our localities are exactly where TCC will be visiting us.
The remaining nine months of this year, I have come to think and believe, will be just as critical as the next decade, the next two decades, and the next one or two centuries.
Do stay well and keep up all good work.
Sincerely,
Edward Burke
Given the godawful state of journalism, and “science journalism” especially, here in the U. S., how exactly can the public be expected to know what to do in response to climate change in their own lives?
Publics treated as “stupid” by public discourse managers including science journalists been eager over the past half-century to report science news instead of dumbing down public discourse consistently, will quite very likely only conform to professional expectations.
How can the public find plenty of work to do, or decide what is a positive action to take, when they have been so utterly confused and consistently misled by journalists and the media for several decades? There are many Illogical Points & Contradictions in Edward Burke’s comment that are decidedly unhelpful and irrational:
Overuse of “Technogenic Climate Change” –
The term “technogenic” is not commonly used in climate science; “anthropogenic climate change” is the correct term.
This suggests the author is trying to sound more intellectual or emphasize a point without adding real clarity.
“More abruptly in some locales than in others, more tragically in some places than in others.”
This is a vague, obvious statement that adds little to the argument.
Contradiction Between “Urgent Local Action” and “Awaiting Data” –
The author insists that immediate action is necessary because waiting for policies is not an option.
Yet, they also say that “complicated climate dynamics for assessing TCC-onset do still await legitimate consensus-building.”
If consensus and better models are still needed, how can they claim we already know enough to take decisive action?
Criticism of Science Journalism but Lack of Scientific Rigor in Their Own Writing –
They criticize journalism for failing to inform the public, but their own explanation is riddled with vague, overly complicated phrasing.
They fail to provide direct evidence for their claims, such as linking CO₂ emissions since 1800 directly to sea-level rise, which is a complex process influenced by multiple factors.
Misrepresentation of “Sinking Cities” vs. “Rising Sea Levels” –
The author implies that the media’s use of “sinking cities” obscures the reality of sea-level rise.
However, subsidence (land sinking) is a major factor in places like Jakarta and New Orleans, and it does not contradict sea-level rise—it exacerbates it.
The claim that this is a misleading editorial choice is overstated.
“Nine months of this year are as critical as the next one or two centuries.”
This is an exaggeration—nine months cannot possibly have the same weight as a century or two of global climate impacts.
The sense of urgency is understandable, but this kind of hyperbole undermines credibility.
The author is passionate but lacks scientific precision and writes in a convoluted, almost performative style that makes their argument weaker. While they have some valid points—such as the failure of science communication and the need for action—they undermine their message with contradictions, misleading claims, and dramatic overstatements.
Poor Peru:
I am tempted to observe “‘performative’ is as ‘performative’ does”, but let me resist that temptation.
This is NOT the forum for me to begin to explain fine points from my intellectual autobiography. You’ll have to take my word for it: I am no scientist, no mathematician, no journalist. When I write fiction that is not “merely” absurdist, I dabble (not so much in “science fiction” but more specifically) in “science satire” (either using a scientific trope to make some satiric point or satirizing some science or sciences outright).
While I am no journalist and no science journalist, still I can appreciate just how poorly “science journalists” in the U. S. typically perform. Very few seem to have any extensive science training, and even if they have received some science training, chances are quite good that their editors and/or producers have not. “Scientific literacy” is hardly the hallmark of American journalism of whatever style or practice (print, video), just as “science education” in the U. S. is not too terribly well informed or practiced in most public schools. That Americans typically are not well-trained for nuance and precision when it comes to science issues can come as no surprise. (In such circumstances deem me a “typical American” since I myself am a product of American public education and worked as a television news editor for three years.)
Since I am now ready to accept the inexorability of Technogenic Climate Change, I might as well also admit that I think we live (for the time being) in a brief era of “elective acceptance”. We are not compelled by evidence already available to accept or believe in the threatened consequences of TCC, but those of us who care to can begin to behave as if the conclusive and unambiguous evidence of the advent of TCC were available. In other words: I endeavor to be a realist, since what conclusive evidence and indications I have seen persuade me that TCC has already been set loose, even though most people are not yet willing to accept this. I understand.
You and I differ on interpretation: fine. I will continue to argue not only that the remainder of 2025 will be critical but that each and every year going forward will be just as (when not more) critical, as I trust the data will continue to be collected, measurements will continue to be made, and the resulting analyses will continue to suggest that TCC continues to unfold even before unbelieving or incredulous eyes. –just as I fully expect that the data acquisitions and analyses necessary for reaching unambiguous assessments and a global consensus will only come to pass by the time other tipping points will have been passed and other feedback loops will have been activated. (I am no philosopher, either, but the reason I say that the “nine months of this year are as critical as the next one or two centuries” is that this expresses my conviction that bad outcomes will only become worse outcomes the longer we wait for “definitive and unambiguous” declarations of “PROOF” that inexorable TCC has been unleashed.)
Instead of carping about my posts here at Real Climate, you might spend your time more productively applying your critical intelligence to those issues that you think matter.
Sincerely,
Edward Burke
Edward Burke suggests: ” you might spend your time more productively applying your critical intelligence to those issues that you think matter.”
I did. Disinformation and misrepresentation matters to me, which my prior comment makes clear because I posted it here. There is no such a thing as TCC nor Technogenic Climate Change. I do not “carp” I casually and respectfully exposed your fallacies and falsehoods. Your contradictions, misleading claims, and dramatic overstatements. “Physician heal thyself.”
Good day.
I had to look that term up. Never heard of it before.
https://climatenexus.org/climate-change-us/politics-and-policy/climate-change-technocratic-approach/
To Nigel and anyone lese,
My apologies, for the semantics errors above. Being such an uncommon unknown word when I searched the term “technogenic climate change” it morphed into the more common “technocratic” in search results. And I did not notice the change in the word.
So the link I offered above is a dead end of no use or relevance. This non-word “Technogenic” is a one-off creation by Edward Burke Roberts by the look of it.
eg Edward Burke 2023-07-24 11:40:24
My custom is to insist on naming the phenomenon “Technogenic Climate Change”, since I’m satisfied this complies with the standard of requisite specificity.
https://marginalrevolution.com/marginalrevolution/2023/07/superfreakonomics-on-geoengineering-revisited.html
https://thewichitan.com/tag/global-warming/
Sincere apologies for this unnecessary confusion.
Poor Peru:
You may not care for the framing, but I think “technogenic” is a perfectly useful word, especially in the specific context of climate change, since the climate changes we will continue to learn about and witness over coming decades and more are largely technogenic in origin.
The climate changes in evidence today are in no small measure the cumulative results of roughly two centuries of implementing industrial and manufacturing applications made possible by modern sciences, technologies, and engineering. It is thus more accurate to label climate change “technogenic” than merely “anthropogenic”, no matter how wittingly or unwittingly humanity-at-large accepted invitations by the decade and by the century to adopt the numerous technologies and applications that have contributed directly to climate change.
Granted, perfectly natural systems have churned along for two centuries in response to technogenic interventions and contributions: but what I think we will wind up discovering is that the global climate of the first half of the 19th century was much more finely poised to “tip” than any scientists of the day understood or appreciated (or took pains to understand, with very few exceptions) and that technogenic contributions began aggravating natural processes and altering natural climatological dynamics even by the end of the 19th century.
–and then of course there was that 20th century . . .
For my original argument from June 2019, see the essay “Naming the Scourge We Made” (under my “creative writing” anonym)::
http://fictionaut.com/stories/strannikov/naming-the-scourge-we-made
Hope this helps.
Sincerely,
Edward Burke (dba strannikov)
Regarding “The Technocratic Approach to Climate Change, Explained.” It says “The climate community is increasingly folding the technocratic and societal approaches together, recognizing that people are the foundation for climate change solutions. ”
So we effectively have a technological solution with renewable energy, and a capitalist free market delivery system, but this system has its inequities so you deliver the technology in ways that are affordable for low income people, so giving them discounts to buy heat pumps and so forth. I think it’s a good approach overall. Its practical, rather than too utopian leaning.
Unfortunately even this approach is resisted by The Trump Administration. They prefer to deny the climate problem exists, and solve the problems of low income people and so called ” trade imbalances” (which haven’t actually hurt America judging by how wealthy it is), with ‘Tariffs’, which will bring manufacturing back to America.
They don’t seem to understand this means significant inflation in the price of consumer goods, factories full of robots, and mostly thousands of low wage assembly line jobs. However it does happen to look like it would be a net benefit to billionaires owning factories, so I suppose that’s the underlying predatory plan.
N: However it does happen to look like it would be a net benefit to billionaires owning factories, so I suppose that’s the underlying predatory plan.
BPL: No. The plan is to shrink the US economy so it’s less of a threat to Russia. Stalin is said to have been more afraid of the $300 billion US GNP* than of the US atomic bombs. Putin is no doubt of the same mind.
The US is an occupied country. Russia is writing the script.
*Gross National Product, an earlier version of Gross Domestic Product GDP.
BPL, I assume you mean the new administration has discussed tariffs with Putin, and Putin encouraged Trumps tariff plans knowing it would shrink the US economy, and knowing Trump won’t understand this, and knowing he has influence over Trump. I think this would be entirely possible. However I think the new administration would have multiple motives for the crazy tariff plan. Basic psychology.
I think it’s a mistake to assume competence from the gang that held high-level discussions on Signal, deported a man by mistake but insist they “can’t” get him back from a client state, calculated “reciprocal tariffs” without including the tariffs they are ostensibly reciprocal to in the calculation, and is presiding over the biggest stock market crash in recent memory. There are some things they know, and much more that apparently they don’t and don’t care to learn.
That said, there are a couple of aspects to the economic destruction that may be worth considering. One is that this is functionally a transformation of American taxation: they are planning to replace a mildly progressive income tax-based regime with a regime significantly based on the regressive tariffs.
The second is that since China is the leading manufacturer of clean-tech gear, and exporter of certain rare=earth minerals important in clean tech. Therefore, the tariff regime is also a significant boon to Big Fossil.
Use of Signal was because they didn’t want a record of their conversations. As usual, the most dishonest reason is the correct one.
Even frequently-wrong, leftist Snopes knows that the Biden Administration directed government agencies to use Signal for encrypted communications. Read ’em and weep:
https://www.snopes.com/news/2025/03/27/biden-authorized-signal/
Kevin, you say its a mistake to assume theres competence in the new administration as in having a clever underlying plan (?). But the example you quote about moving towards regressive taxes sounds planned to the advantage of the wealthy so is competent in terms of achieving that goal. However I agree that the new administration have displayed a huge amount of incompetence.
I also agree about Tariffs being destructive. They might have worked 200 years ago to help establish a manufacturing base, but times change so much that some ideas are just no longer appropriate. Just look at the data: The countries with the highest tariffs over the last few decades are poor countries, and they are still poor countries with weak manufacturing sectors.
Sorry, nigel. I intended the “That said” to function as a “Nevertheless,” or something of the sort–an indicator that while incompetence is a feature of the Maladministration in general, that it’s possible even so that they did NOT miss the aspects I highlighted. IOW, those aspects were not offered as examples of said incompetence, but rather as possible exceptions to it.
MAGA world includes a WHOLE lot of crazy, and lots of willful stupidity as well, but not all the inhabitants are lacking in cleverness or competence.
Kevin McKinney: MAGA world includes a WHOLE lot of crazy, and lots of willful stupidity as well, but not all the inhabitants are lacking in cleverness or competence.
Lol. Hanlon’s Razor holds that we should not attribute to malice what can adequately be explained by stupidity. That doesn’t help much with Trumpism. There’s plenty of both in evidence, often in the same person!
Published: 07 April 2025
Global and regional drivers for exceptional climate extremes in 2023-2024: beyond the new normal
https://www.nature.com/articles/s41612-025-00996-z
Temperature anomalies during the latter half of 2023 (July–December) show a distinctive spatial structure (Fig. 1g, h) that is quite different from the much more spatially uniform pattern of warming over the last ~75 years (Supplementary Fig. 3) and resembles a positive El Niño-Southern Oscillation (ENSO) phase in the tropics29. Regional SSTs averaged over each of the four regions in Fig. 1h (indicated by boxes) highlight different times of emergence of abnormal record-breaking conditions for each region (Fig. 2a–d).
and
SSTs in the extratropical Northwestern Pacific first exhibited abnormal record-breaking conditions in early 2022, with most months since September 2022 continuing through June 2024 passing the AB test. ( “Abnormal record-Breaking (AB) test”)
The subtropical Northeastern Atlantic first showed abnormal record-breaking conditions in May 2023, continuing unabated through May 2024.
In the tropical Pacific, on the other hand, abnormal record-breaking conditions occurred between June and October 2023, though the anomalous SSTs in this region were on par with those observed during the 2015/16 Super El Niño (dark blue lines). However, neither of the two most common El Niño indices (i.e., Niño 3.4 and Niño 3) were record breaking in 2023 (Supplementary Fig. 4). The 2023 warming in the tropical Pacific is broader in latitude than the warming in the previous Super El Niños.
Abnormal record-breaking conditions began in the Southern Ocean in February 2023, lasting through September 2023. The Southern Ocean anomalies reach abnormal record-breaking conditions first, at the start of the Southern hemisphere summer. The earlier emergence of AE anomalies (atmospheric energy (AE) (Fig. 1d)) in the Southern hemisphere is evident in Supplementary Fig. 2.
Global energy perspective
What led to the record-breaking warmth of 2023? A central factor is Earth’s energy budget, which describes the difference between incoming solar radiant energy absorbed by Earth and outgoing thermal infrared radiation emitted to space (Fig. 3a, b). Both quantities show large fluctuations on interannual times scales associated with ENSO fluctuations, consistent with earlier literature30,31,32. During El Niño phases the EEI drops rapidly, even turning negative during the 2010 and 2016 events, indicating a net Earth’s energy loss.
However, over the past two decades, an exceptional trend in EEI (Fig. 3b) has been observed from satellite TOA radiation, in-situ ocean, and satellite altimetry and space gravimetry measurements3,4,33,34. This extra energy input has rendered the system significantly warmer, particularly within the ocean below 100 m (see Fig. 3d).
This prolonged build-up of energy into the climate system is associated with an unprecedented increase in TOA absorbed solar radiation (ASR) that is only partially compensated by a weaker increase in outgoing longwave radiation (Fig. 3a). The ASR changes have been linked to decreases in low and middle cloud fraction in middle-to-high latitudes in the northern hemisphere and decreases in middle cloud fraction in the southern hemisphere 1.
and
The abnormal record-breaking conditions in 2023 thus resulted from the combination of the long-term positive EEI trend, the 3 year La Nina conditions, and the switch to El Niño. A recent analysis of outputs from the Climate Model Intercomparison Project Phase Six suggests that the transition from a multi-year La Nina to an El Nino substantially increase the EEI 43.
The long-term trend in EEI is due to a positive radiative forcing resulting from continued emissions of well-mixed greenhouse gases and reductions in aerosol emissions in some parts of the northern hemisphere due to air quality legislation 21,44,45,46. A recent assessment suggests that climate models fail to capture the exceptional global mean temperature increase in 2023 47 or the modeled probability is extremely low 40. A key reason may lie in the models’ representation of the unprecedented observed changes in Earth’s energy budget.
Gavin, Zeke et al: Zeke – you published a blogpost in early February on the high January anomaly in ERA-5, despite, ENSO going to neutral/slightly negative. This has only continued. The Feb number was +1.59C above pre-industrial, and the March number was +1.60 above pre-industrial. I can only assume the ENSO-driven anomaly is ~0 now. To extend your above analysis to Q1 2025, with my best guesses just eyeballing:
Total Anomaly above smooth curve: +0.25C
Expected Anomaly: +0.10C (from your 2024 numbers minus ENSO)
Is this about right? If so, we’re back in the realm of a +0.15C mis-match (maybe more?). That’s a lot. The world has been above +1.5C (rel to pre-industrial) 20 out of the last 21 months according to Copernicus:
https://climate.copernicus.eu/surface-air-temperature-march-2025
JCM asserts above [18 Apr 2025 at 1:43 PM]: “conclusions are formed by peers within a discipline that seems almost proudly biased.”
So, in your view climate physicists as a whole are “proudly biased”? Perhaps you have some remotely on point shred of evidence to your assertion to provide us with?
You seem to think that scientific consensus is some political act arrived at in concert. Consensus in science is quite different: It arises when an assertion has been put forward, has been attacked by all interested and qualified* peers with relevant skills/knowledge many of whom have their own ideas, and no competing assertion by another qualified* expert appears to explain things better or even as well,
Face it: There is no conspiracy to bias anything at all by climate scientists directed by Dr. Warm hiding under an extinct volcano. (I cannot say the same about the various propagandists who camp out here. But their audience is not scientists.
______
*Qualified in this context means having published something scientific peers also publishing in the field consider of value.
jgnfld says
19 Apr 2025 at 8:52 AM — where denial and ignorance is bliss resides. Old Scientists don’t Retire-they just fall back upon their egos and life long biases once they stop thinking properly.
Absolutely JCM — you’re raising a profound and necessary question about the human side of science: how bias seeps in, even among the most rigorous thinkers, and how critical it is to guard against it to avoid flawed consensus.
Here’s how I would frame from a Poor Peruvian Perspective more sharply:
“How do leading scientists themselves describe the natural bias inherent in the scientific process — and why is becoming aware of these biases essential to preventing flawed or premature consensus across scientific disciplines?”
Below are some thoughtful, powerful quotes by well-known scientists and thinkers who speak directly to this issue for the EDIFICATION on one jgnfld whose memory seems to be failing him. :
1. Richard Feynman (Nobel Prize-winning physicist)
“The first principle is that you must not fool yourself — and you are the easiest person to fool.”
— Richard Feynman, Caltech commencement address, 1974
This quote is often cited in discussions of scientific integrity. Feynman was highlighting how self-deception and confirmation bias are major hazards even (or especially) among scientists. His point: the bias is internal — and recognizing it is the first defense against faulty science.
2. Thomas Kuhn (Author of The Structure of Scientific Revolutions)
“Normal science… often suppresses fundamental novelties because they are necessarily subversive of its basic commitments.”
— Thomas Kuhn, 1962
Kuhn argued that scientific communities are prone to internal inertia. Once a dominant paradigm is established, it tends to resist challenges — even when new evidence emerges. This “consensus inertia” can itself be a form of collective bias.
3. Carl Sagan (Astrophysicist and science communicator)
“Science is more than a body of knowledge; it’s a way of thinking. It’s a way of skeptically interrogating the universe.”
— Carl Sagan, The Demon-Haunted World
Sagan often warned that science isn’t just about collecting data — it’s a discipline of self-skepticism. He recognized that without constant vigilance, scientists can easily drift into groupthink, mistaking prevailing assumptions for truths.
4. Barbara McClintock (Nobel Laureate in Physiology or Medicine)
“If you know you are on the right track, if you have this inner knowledge, then nobody can turn you off… but if you’re not sure, then you might get swayed.”
— Barbara McClintock, quoted in Evelyn Fox Keller’s A Feeling for the Organism
This shows how personal conviction must be balanced with openness to being wrong. Without awareness of bias, conviction can harden into dogma.
5. Peter Medawar (Nobel-winning immunologist and philosopher of science)
“The intensity of the conviction that a hypothesis is true has no bearing on whether it is true or not.”
— Peter Medawar, Advice to a Young Scientist
Convictions — even deeply held — are not immune to bias. Medawar’s point is that feelings of certainty in science are dangerous unless they’re matched with rigorous, unbiased validation.
Now jgnfld would you like these woven into a structured paragraph, or expanded into a brief article-style argument for the forum?
I can also dig deeper for quotes in specific fields like climate science, psychology, or medicine if that’s your focus is so inclined.
(with a broad Peruvian smile whilst I gaze upon the forlorn melting Peruvian Glaciers not privy to these grandiose self-important discussions here)
imho RC’s Quote of the Year thus far:
“There should be at least some doubt considering conclusions are formed by peers within a discipline that seems almost proudly biased.”
–JCM
@ https://www.realclimate.org/index.php/archives/2025/03/wmo-update-on-2023-4-anomalies/#comment-832203
Additional Refs about Bias in Science:
Poor Peru says
19 Apr 2025 at 9:19 PM
https://www.realclimate.org/index.php/archives/2025/03/wmo-update-on-2023-4-anomalies/#comment-832250