One more dot on the graphs for our annual model-observations comparisons updates. Given how extraordinary the last two years have been, there are a few highlights to note.
First, we have updated the versions of a few of the observational datasets: UAH TLT/TMT are now on version 6.1, and the NOAA NCEI surface temperature data are now version 6. We use the same collations of Hansen81/Hansen88/CMIP3/CMIP5/CMIP6 model output as previously. The comparisons cover surface air temperatures, sea surface temperatures, tropospheric atmospheric temperatures (TLT, TMT), stratospheric temperatures, and a few variations on these themes that have been of interest in the past. (It would be nice to have some non-temperature variables in the mix – feel free to suggest some if you can point to (or post) an archive of the models historical+projected results).
With respect to the GMSAT, it’s striking how close the real world is to the Hansen et al. (1988) ‘Scenario B’ (this scenario had ‘business as usual’ concentration rises in CO2, but too much growth in CFCs and CH4. However, the prize for most skillful projection still goes to the CMIP3 ensemble; even after 20 years, it’s still pretty much spot on.
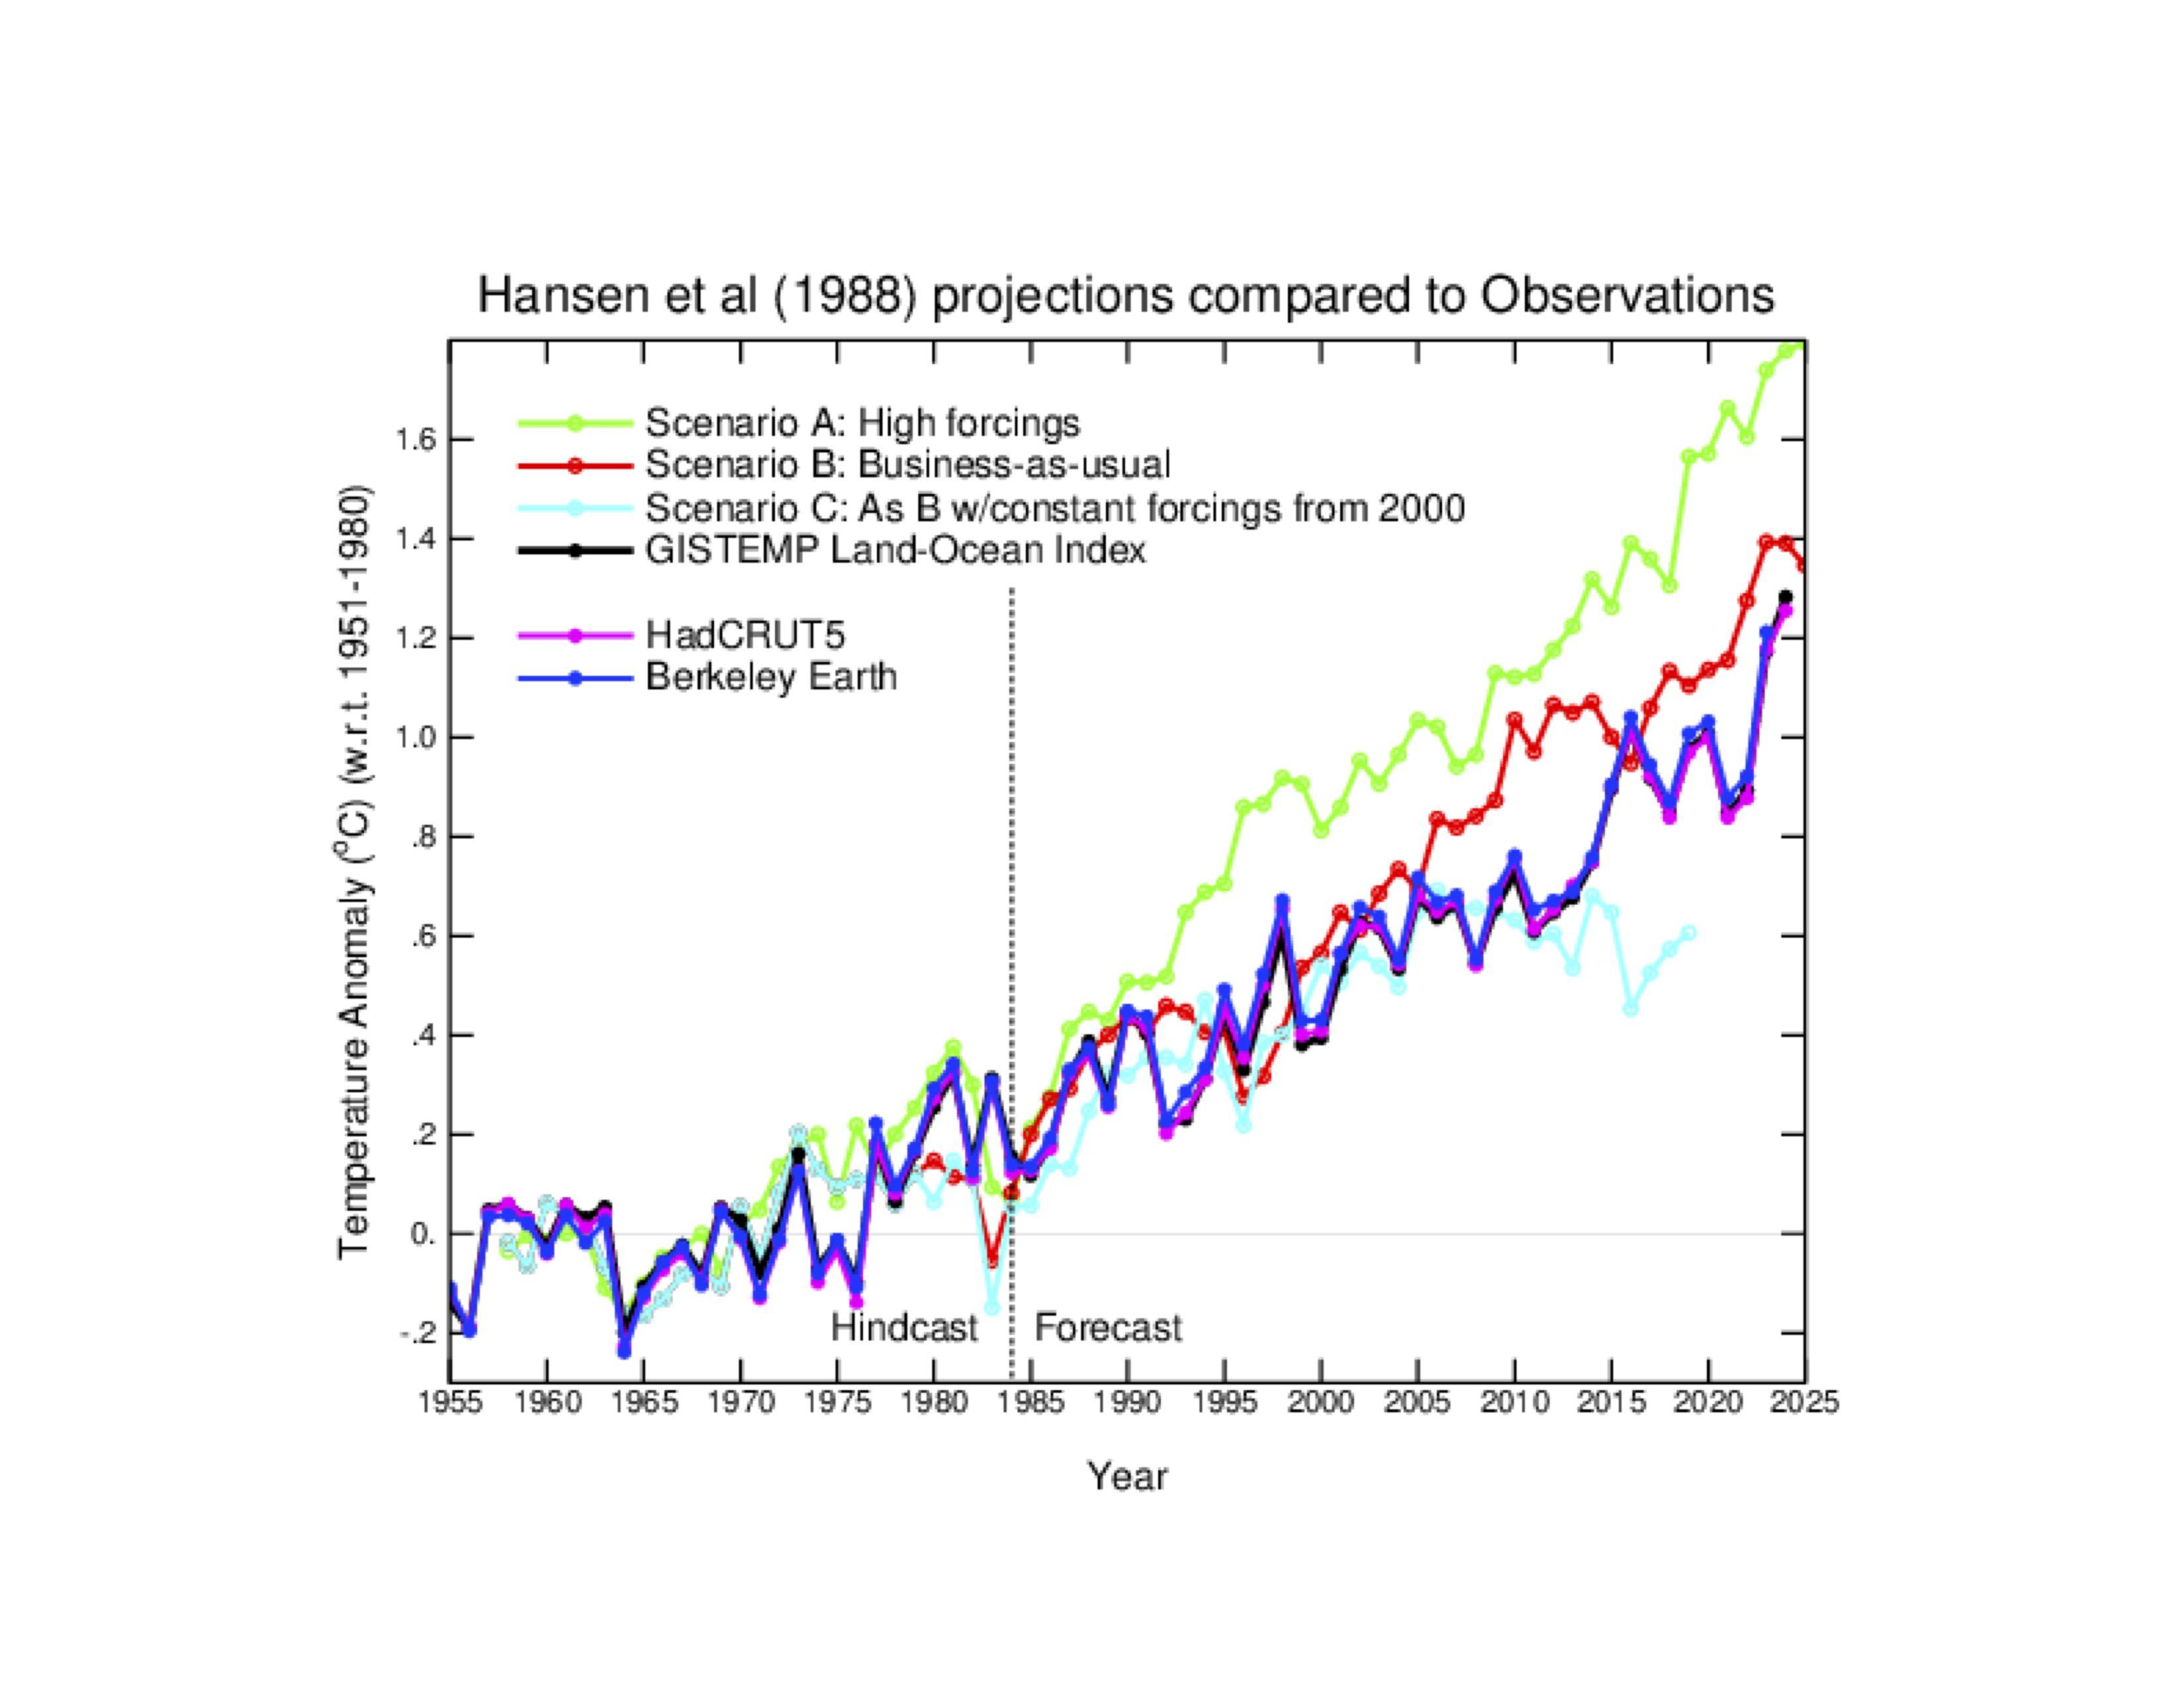
The detailed issues that lead to some angst around the CMIP5 models – mis-specifications of the forcings, the importance of the SST/SAT blend vs. SAT trends have somewhat faded in importance. These are/were real issues, but they are small compared to the ongoing trends. With respect to CMIP6, the observations (across a swath of temperature related diagnostics) are still best matched by the sub-sample of screened models (i.e. discarding those that ‘ran hot’).
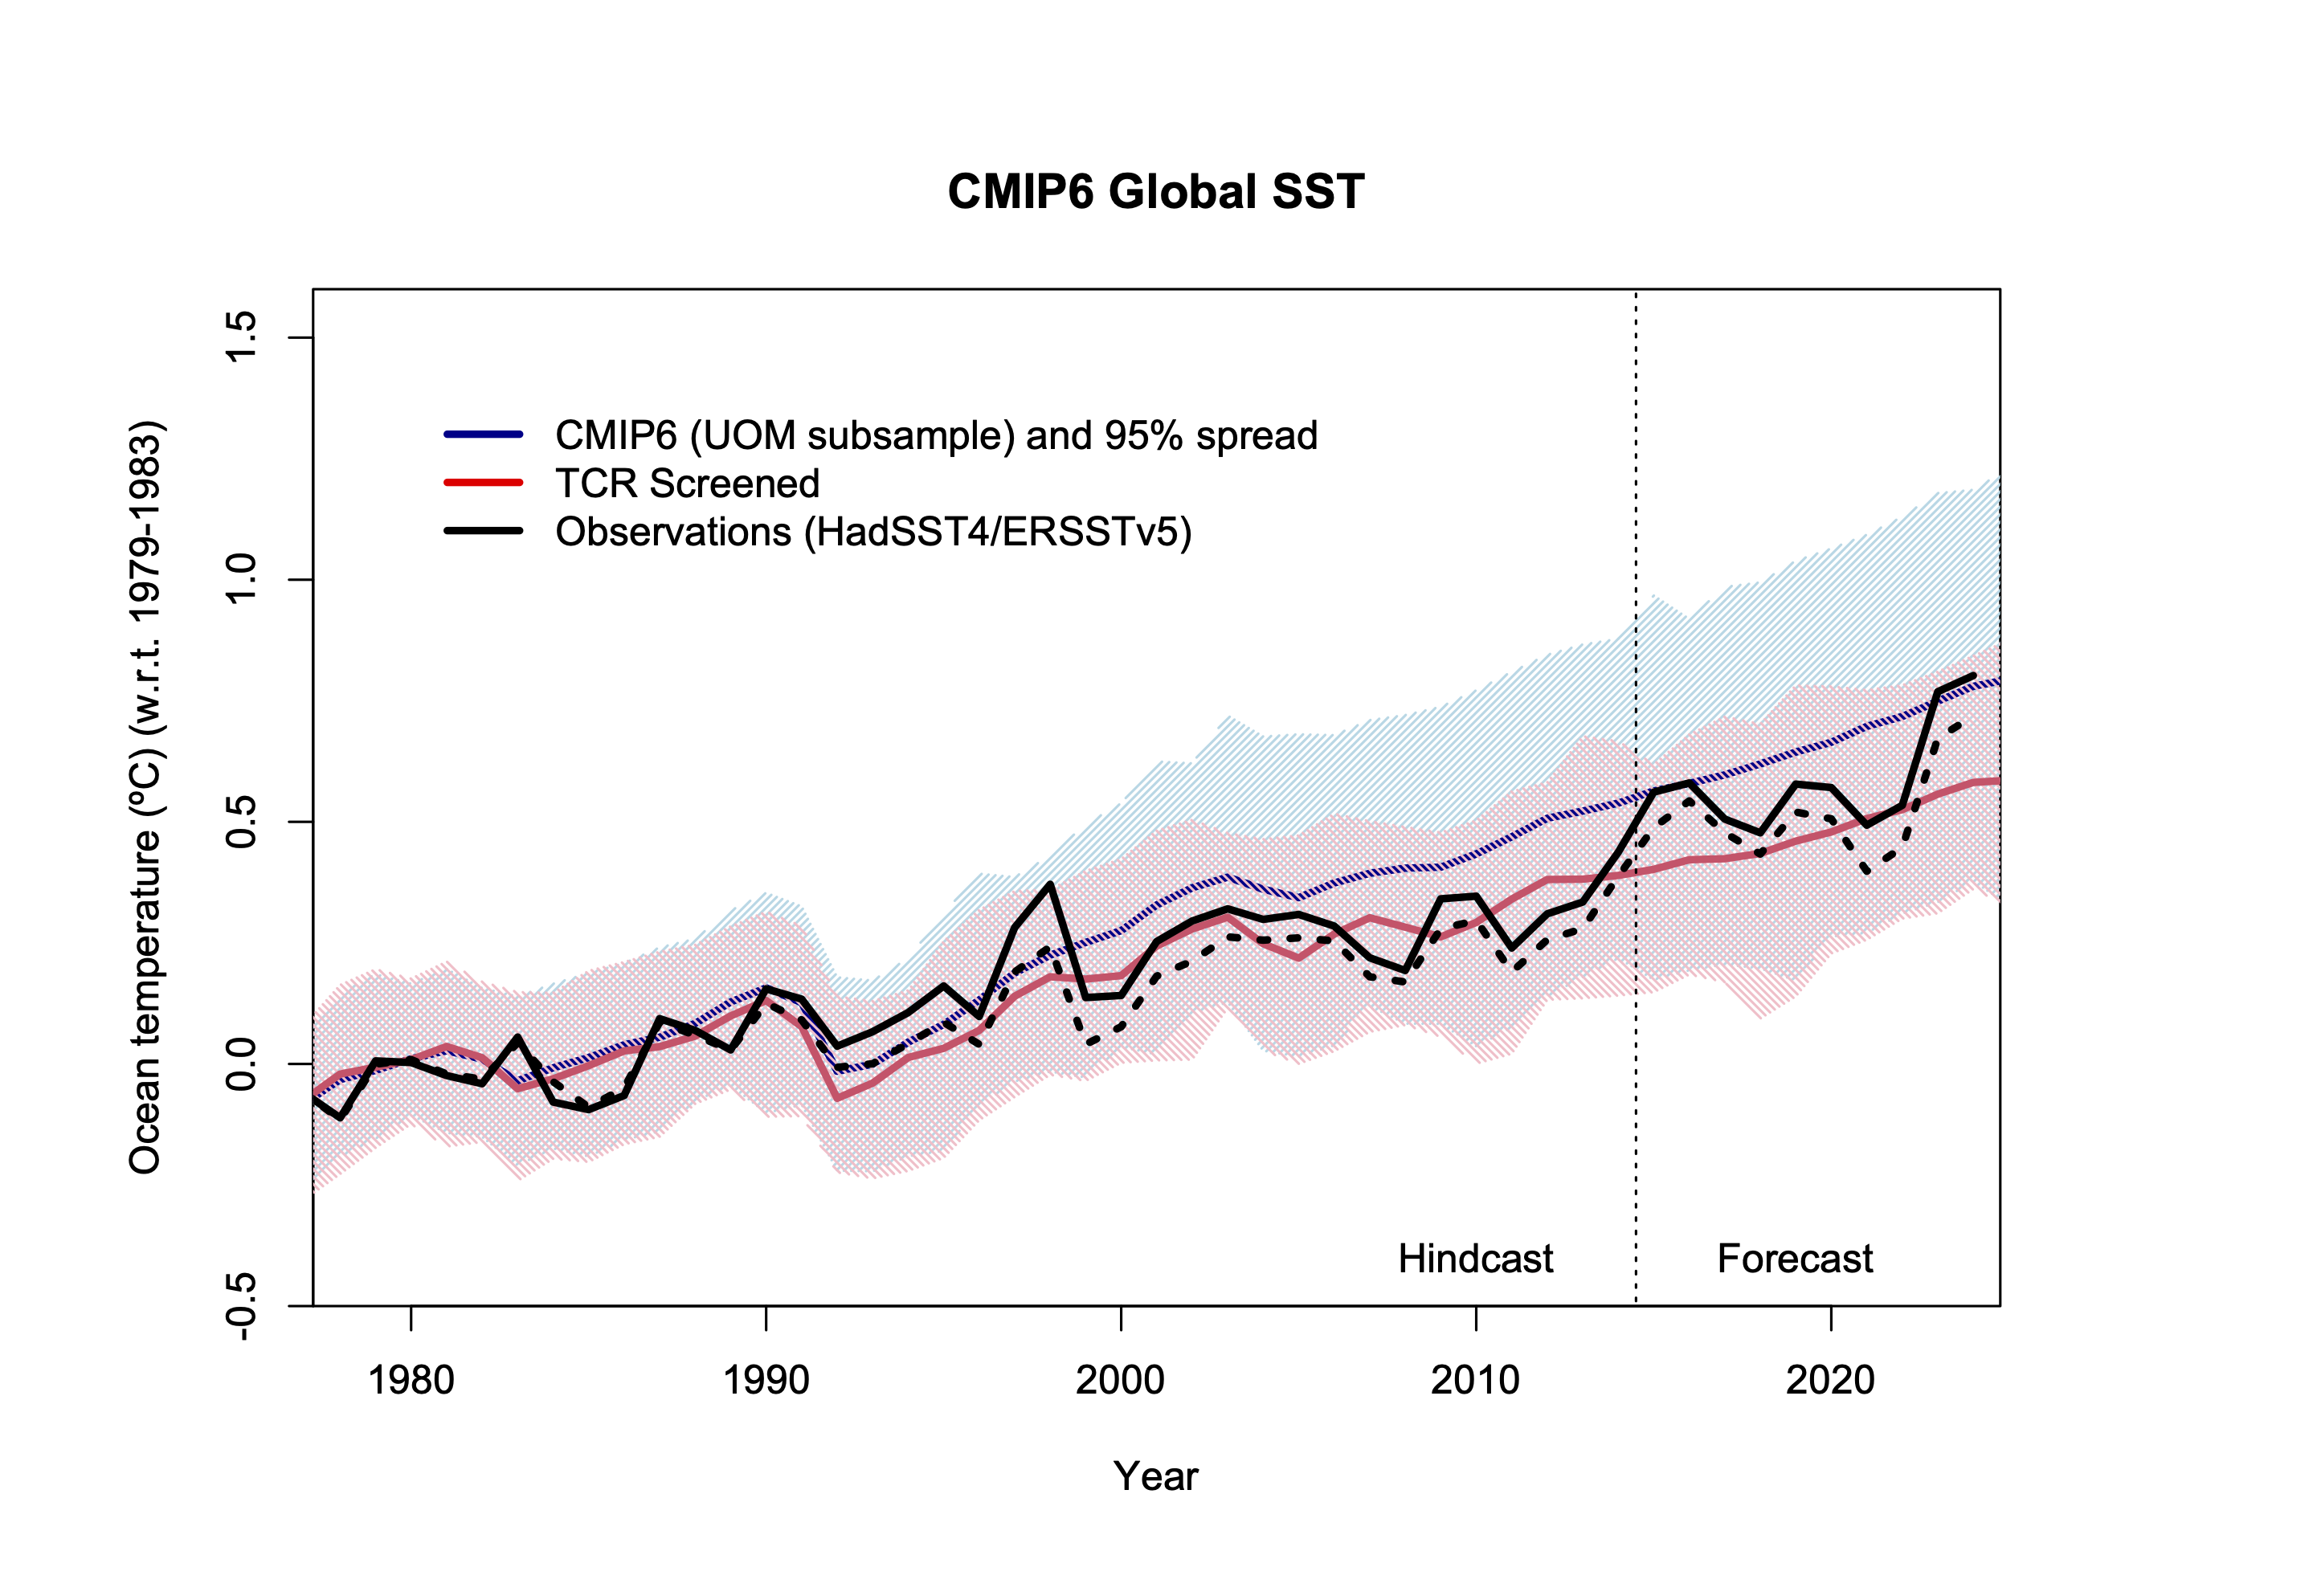
The updates with respect to the atmospheric temperature profiles (MSU/AMSU derived diagnostics), have become slightly more favorable to the models, though the structural variation between the RSS data and the UAH/NOAA STAR retrievals is still clear. For the sea surface temperature, the real world seems to warming at the upper end of expectations, but still (just!) within the screened spread.
One of the main reasons to maintain these comparisons is to see where discrepancies arise. To that end, multiple versions of the observational data are obviously useful since they can give an estimate of the structural uncertainty (this has been very important in the MSU/AMSU comparisons for instance). In other instances, we have less concerns about the observational data, but we are concerned that the models are not being given the right inputs. For example, since the internal variability in stratospheric temperatures is much less than in the lower atmosphere, incorrect forced signals can emerge faster. I think we may be seeing some of that in the SSU comparisons…
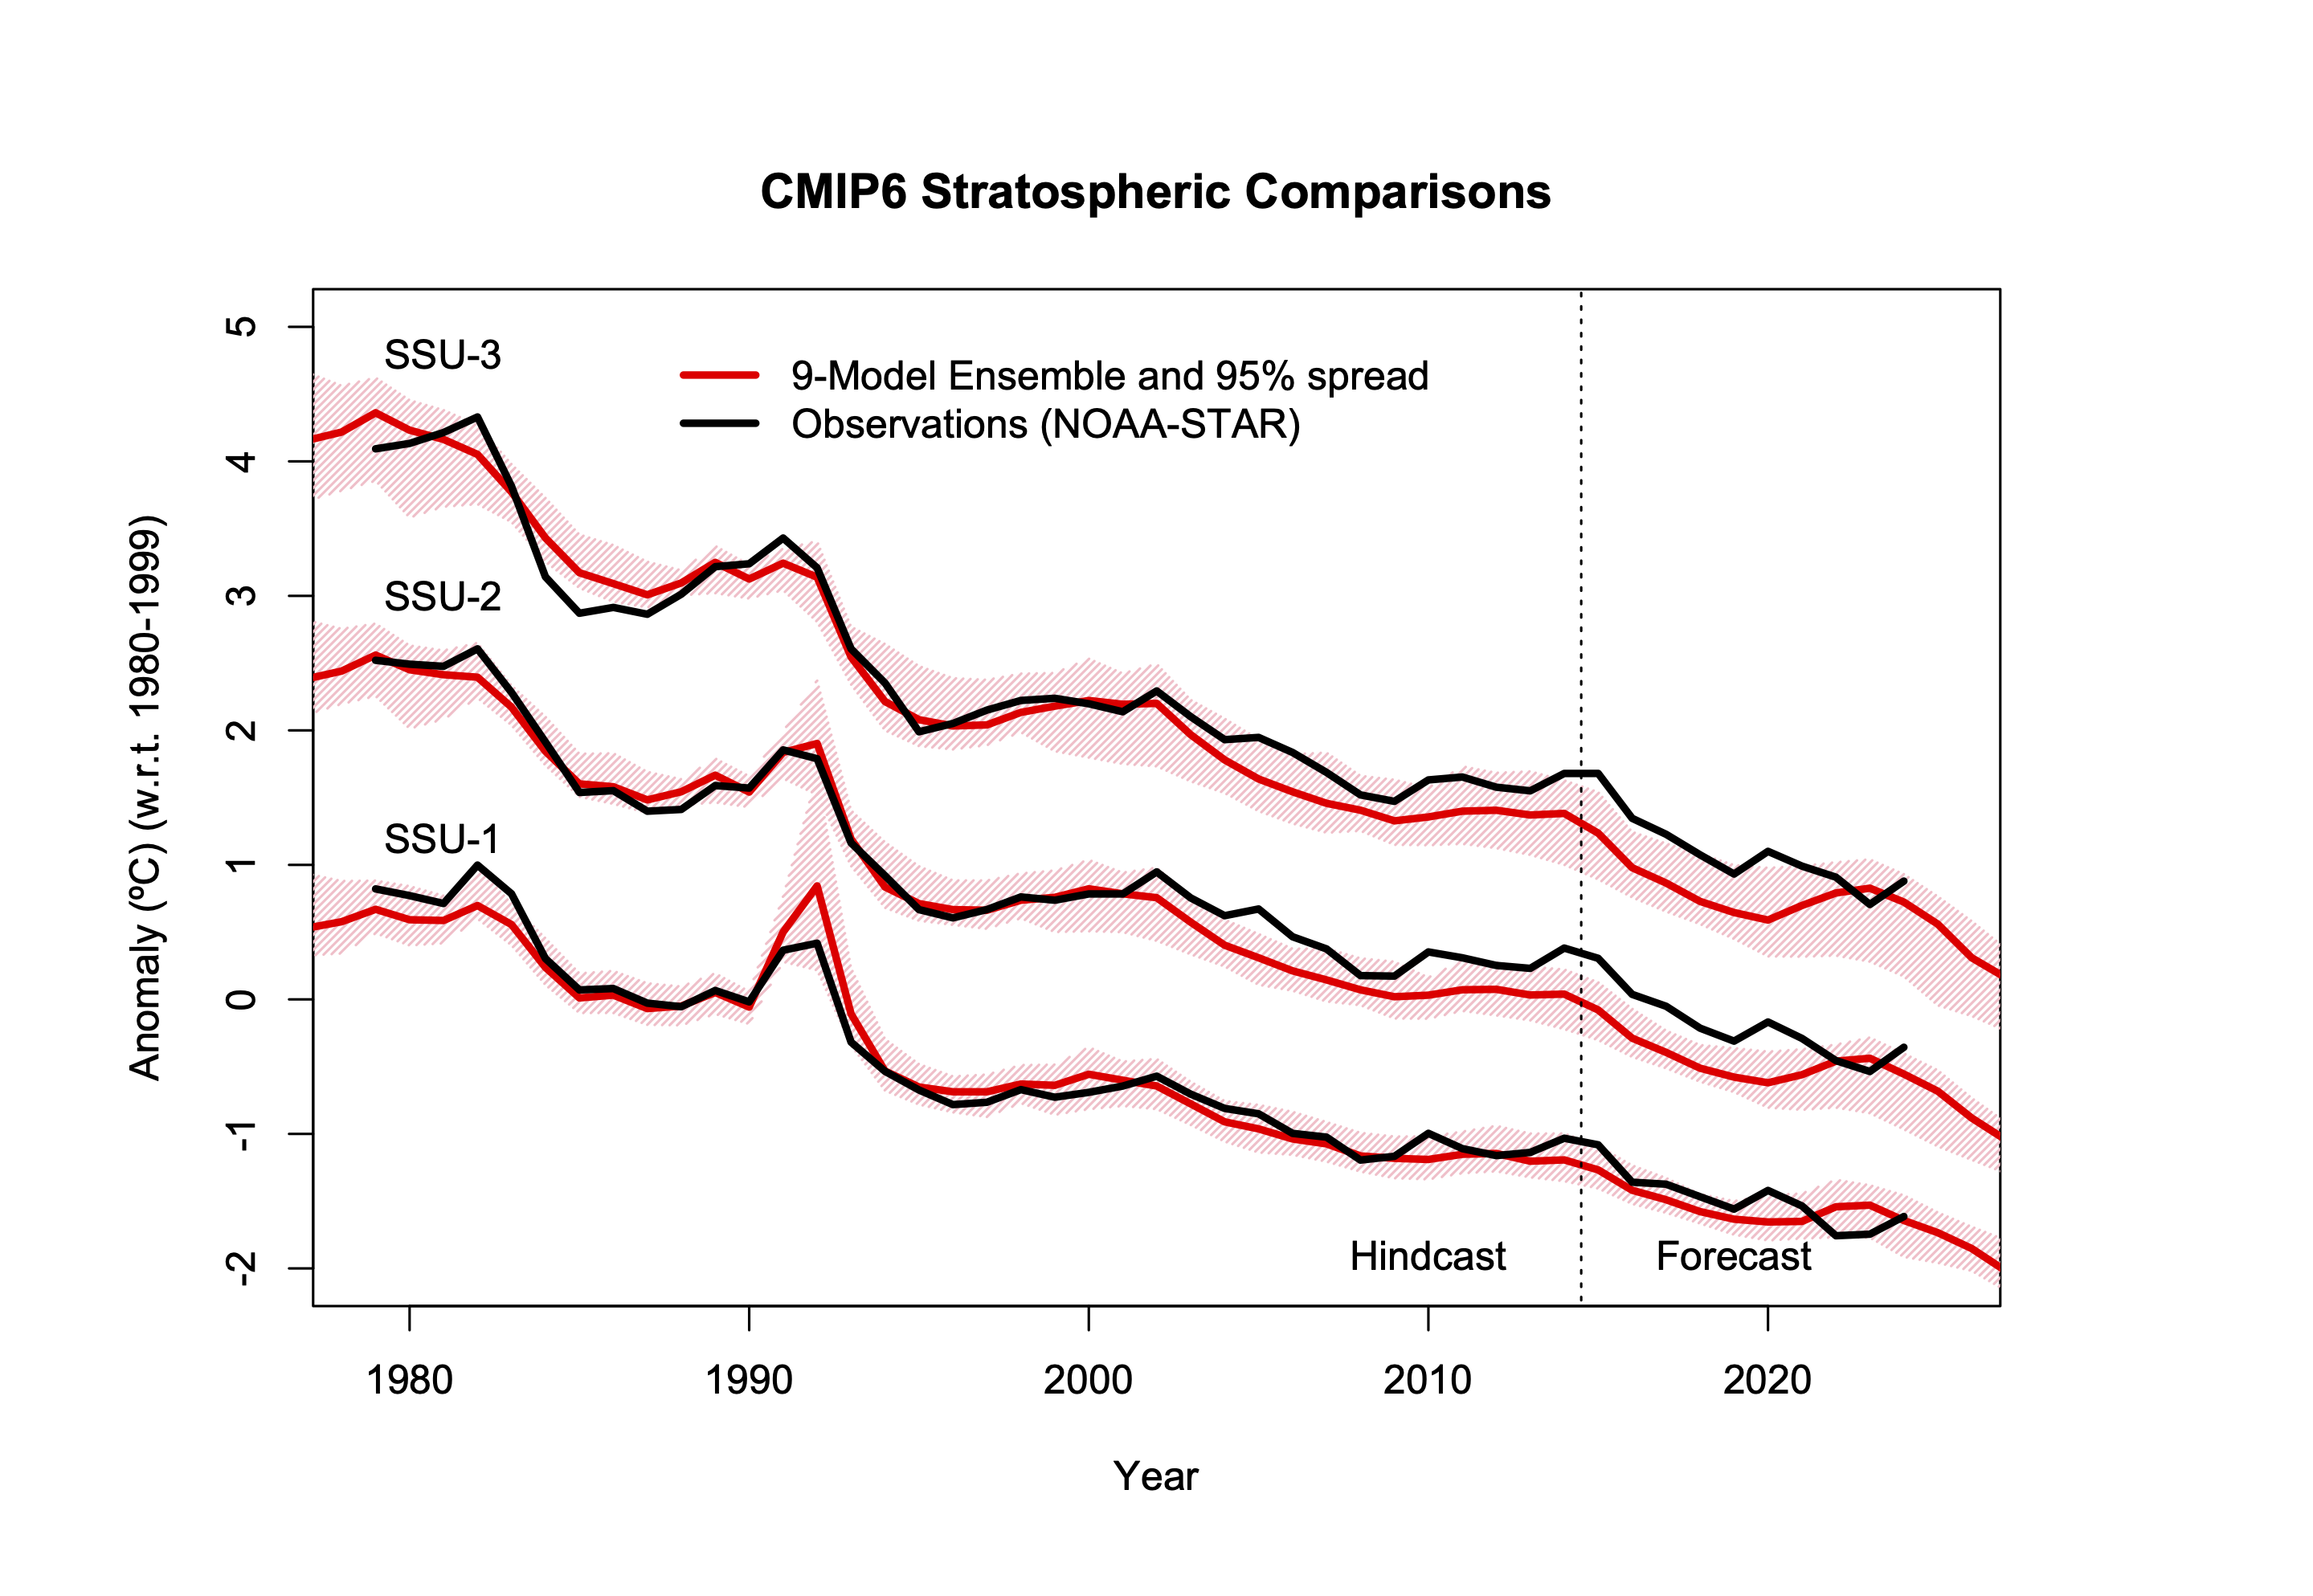
The match to the models is very good over the historical period (to 2014), but post 2015, there is some mismatch between the model variance and the obs. There are two potential issues – the timing of the solar cycle 25 (a solar max warms the stratosphere) – which happened earlier and bigger than expected by CMIP6, and the presence of the Hunga Tonga volcano (from 2021) which is having complex impacts on the stratospheric temperatures. Nonetheless, the long term trends are still well-modeled.
As always, if someone knows of expanded model diagnostics and relevant observational data sets to compare with, let me know and we can add it to the page.
Thanks as always to the data centers who provide the observational data, the CMIP committees who organised this storage of the outputs, the modeling centers that did the runs, and the authors who produced the derived data sets we are using directly here (full refs on the above listed page).
See you next year!
Not a scientist, just an interest in weather models… However one aspect that is becoming important is the number of high winds we are seeing. Of course this is directly related to the overall temperatures, but it is also becoming the cause of a number of wildfires across the Western US, and the intensity of hurricanes.
I have not run across any models that try to predict how the continued global warming will affect these winds, but it seems like that information would be useful for predicting trends towards future disasters.
This is also affecting the arctic blasts we are seeing so spotlighting the trends towards rapid cooling in areas, especially when those downward spikes are sudden and severe, may be a good indicator of how the climate has shifted. For example, here in Colorado a few years back we had one day where the temperature dropped by 70F overnight, killing off otherwise hardy pines. And on the opposite side, I watched the temperature rise by 50F over a period of less than four hours one morning. What happens to the plant life if these trends get worse or more frequent?
S: I have not run across any models that try to predict how the continued global warming will affect these winds, but it seems like that information would be useful for predicting trends towards future disasters.
BPL: I don’t know of a time series for global average winds, although I have seen some estimates. Perhaps some exist for winds in particular areas. If you can find one, you can then apply time series analysis to see how it might be related to temperatures or other factors.
I’m not sure I’D want to try THAT time series analysis without a lot of time and resources (and a grad student or two!)! Just operationalizing wind fields in some sensible and well defined way kicks the math to a whole new level!
Send a note to Tamino…he could likely do it in a few days!!!
Just a quick thought, Wind Turbines start to rotate circa 15mph and feather at circa 55mph, however once the turbine rotates it also SUCKS” primarily around the windfarm area, once the wind flows over the blades it also accelerates and can carry the moisture from the surrounds into the clouds/atmosphere.
E Terry: once the wind flows over the blades it also accelerates
Ain’t the wind turbines working in the opposite manner? I mean – taking the energy FROM the wind, and by doing so – LOWER the windspeed in their wake?
Are you sure that you are not talking about the ceiling fan?
Wind turbines are extracting energy from horizontal windflow. Yes, the net effect would be lower horizontal wind speed. However, they can also convert a portion of the horizontal energy into eddies that promote vertical mixing downstream.
J. Pollack – “they can also convert a portion of the horizontal energy into eddies”
– enough to ” carry the moisture from the surrounds into the clouds/ atmosphere”?
– and more effectively than the eddies forming in the absence of the wind farm – from the stronger wind making eddies from a shear with vegetation – with the resulting eddies forming closer to the ground/vegetation. i.e. closer where the water for evaporation is?
Piotr, regarding whether a wind farm can result in vertical motion to “carry the moisture from the surrounds into the clouds/atmosphere”
“and more effectively than the eddies forming in the absence of the wind farm – from the stronger wind making eddies from a shear with vegetation – with the resulting eddies forming closer to the ground/vegetation. i.e. closer where the water for evaporation is?”
I do have a specific example where this would appear to be the case. In the Great Plains of the U.S., a nocturnal low-level jet commonly forms in the warm season. Frequently, there will be a convective outbreak downstream of where this jet encounters a surface boundary, and the air is forced to rise, initiating convective instability. (In some places, there is a nighttime precipitation maximum because of this, rather than the usual late afternoon convective maximum.) The low level jet can penetrate to a few hundred meters above ground level, where it would be intercepted by a wind farm – but not surface vegetation. The wind farm would tend to anchor the surface boundary and also induce a more abrupt vertical motion by increasing the boundary layer depth and roughness.
Two caveats:
I am not stating that this mechanism will operate effectively in other weather conditions, although in general some of the horizontal kinetic energy intercepted by a wind farm would be converted to vertical energy.
This is contrary to E. Terry’s original proposed mechanism, which relies on stronger velocity around the turbine blades. I am proposing that the net extraction of horizontal energy in effect blocks the wind to some degree. This erects a quasi-orographic barrier that intercepts a prevailing windstream and directs it more vertically.
Piotr, this paper reported a five-fold increase in H2O fluxes.
I used the search string “wind farm turbulent fluxes” on Google Scholar.
Re: John Pollack: Thanks John. Your explanation makes much more sense the perpetuum mobile of E. Terry rendering laws of thermodynamics obsolete (the wind after extraction of energy by a wind turbine having higher velocity (hence more energy) than before the turbine).
And as per your caveat and the paper found by S. Emmerson – the results are far from universal – different during day than night, depending on the direction of the wind, local weather patterns and s such – won’t necessary extrapolate from the flat land covered with crops in the US to the rest of the continents .
Still things may be more complicated than passive “quasi-orographic” blocking -since the paper found by S. Emmerson – says that the effects very much smaller when turbines were off.
SR Emmerson “this paper reported a five-fold increase in H2O fluxes”
Thanks. As far as I can see – it was the maximum effect (during night in specific wind directions). And the paper doesn’t say that it ” can carry the moisture from the surrounds into the clouds/atmosphere” as E. Terry claims.
If anything, the paper says that at night – when the effects are stronger, the latent heat flux (=moisture flux”?) is TOWARD crops, i,e,. downward, not upward
And even that effect wasn’t particularly significant – “indicate negligible impact on crop yield”
Not sure where you’re getting that data from, but both bounds you give are too high, from what I can tell.
15 mph is roughly 6.7 m/s, and as you can see at the link below, even the slowest ramping turbine I found was already pushing a megawatt or so at that speed.
https://en.wind-turbine-models.com/powercurves
(Correction: that page, unlike many, doesn’t give you the model whose power curves were graphed in the URL–I picked a 5-MW Gamesa, with ~3.5 MW offerings from Enercon, GE, Nordex and Vestas, if you want to see the curves.)
Power began to be generated at about 4 m/s (9 mph), and they all cut out in the general vicinity of 20 m/s, or 45 mph.
Thank you for all the interesting work. However it would be nice if some high resolution versions of the figures were available, as I like to show some of them to my students in class (Climate change Biology course).
[Response: All of them are 300 dpi png files on the main page. Is that not sufficient? – gavin]
i) Open Image in New Tab and ii) Save As. (or some such).
They are okay but still a bit blurred when projected onto a big screen in a classroom. I might be too picky. Thanks anyway.
I agree – they don’t look good. Bigger PNGs, or maybe SVGs, could be much better.
There are programs that are able to sharpen images, Gimp (which is free, but sometimes seems only a little more user friendly than a rabid dog) or perhaps even your phone’s photo gallery. Perhaps you will have to convert from one image format to another, but as long as you don’t over-sharpen the results should be more in line with what you are looking for.
So maybe I’m looking at the wrong files. The image cmip6_sst-600×414.png is 600×414 pixels at 72 dpi. Resizing it (I went for 300 dpi) and fiddling with unsharp masking helped some as a quick fix.
It looks like there are on-line AI tools that will let you up-sample and enhance images for free. I can’t vouch for any, but maybe worth a try.
Hi, I’m a media person who deals with visual files often. I agree. These are kind of low res for these days. Especially for full screen TV and projection. And my software tools reveal them as 72 DPI.
Thanks for these graphs, BTW. So helpful.
[Response: They are uploaded as 300dpi, so maybe I need to tweak something… Update: I tweaked the settings, they should be full resolution now. – gavin]
“There are two potential issues – the timing of the solar cycle 25 (a solar max warms the stratosphere) – which happened earlier and bigger than expected by CMIP6”
That’s embarrassing to mention sunspots. Attributing solar sunspot cycles to climate variation is the equivalent of prescribing Ivermectin to a medical condition. Perhaps worse because you guys claim to understand the physics.
Not sure I understand your point. You seem to be denying the link between the solar cycle and fluctuations in temperature. I thought it was well established that the 11 year sunspot cycle does give rise to an 11 year cycle in global temperatures, but that is overlaid on whatever other trends are apparent: in this case, a steady warming trend. But perhaps I have missed something. Perhaps you could clarify? And in what sense does the posting misunderstand the physics, as you seem to imply? Thank you.
The key is how much solar cycles influence climate variability. Not very much. Your comparison to Ivermectin is unwarranted.
It’s not clear if the current sunspot cycle had much to do with this particular heat spike, but in general sunspots do increase the temperature in the stratosphere. The effect is very nonlinear.
https://localartist.org/media/StratCooling.png
Paul Pukite: “ That’s embarrassing” , “equivalent of prescribing Ivermectin”, “you guys claim to understand the physics”
Extraordinary claims demand extraordinary evidence. Your seething contempt toward Gavin and other “you guys” is as extreme as they come. Yet your extraordinary evidence is …absent.
So put your money where your mouth is – PROVE beyond ANY doubt (“extraordinary evidence”) that the solar cycle does NOT have any effect on the Earth temperature
Since you described Gavin’s “a solar max warms the stratosphere”, to be “embarrassing” and “equivalent of prescribing Ivermectin” – how hard could this be for you, Mr. Pukite?
Not so.
See, for example, Foster and Rahmstorf, 2011:
https://www.researchgate.net/publication/254496419_Global_temperature_evolution_1979-2010
” When the data are adjusted to remove the estimated impact of known factors on short-term temperature variations (El Nino/southern oscillation, volcanic aerosols and solar variability), the global warming signal becomes even more evident as noise is reduced”
https://www.merriam-webster.com/dictionary/hubris
WHUT I am still willing to read your research on ENSO when it has been published in a non-predatory peer reviewed journal.
Note the quote specifically mentions stratospheric temperatures “(a solar max warms the stratosphere) “. IIRC there is a big increase in UV associated with sunspots and that UV is absorbed by ozone in the stratosphere. So while it has a modest effect on surface temperatures, I can see why it would have a greater impact on the stratosphere. So it seems pretty reasonable to me (especially as there is less internal variability in the stratosphere, so small changes in forcing will be more easily detected there).
in re to Paul Pukite, 28 Jan 2025 at 2:25 AM,
https://www.realclimate.org/index.php/archives/2025/01/comparison-update-2024/#comment-829608
Dear Paul,
The relationship between climate variations and sun activity cycles was the Ph.D. thesis topics of notable Czech astronomer Ladislav Křivský in the year 1948:
https://www.astro.cz/spolecnost/sin-slavy/ladislav-krivsky.html
40 years ago, I read in one of his books an explanation why the power output of Sun is slightly higher at the maximum of sunspot number than in minimum of teh solar cycle (although sunspots are colder than the rest of chromosphere.
It is because the opposite effect of much less remarkable hot solar flares accompanying the sunspots prevails. It appears that respectable information sources like
https://www.weather.gov/fsd/sunspots
https://www.climate.gov/news-features/understanding-climate/climate-change-incoming-sunlight
https://www.landgate.com/news/the-impact-of-sunspots-and-solar-flares-on-solar-energy
https://spaceplace.nasa.gov/solar-activity/en/
still share this view.
I therefore join Rory Allen in asking you for clarification of your assertions.
Best regards
Tomáš
Especially embarrassing in the context of sunspots having zero effect on the ocean’s thermocline, which is clearly sensitive to mechanical forcing, such as from the strong lunar tidal effects operating on the reduced effective gravity environment along the thermocline interface.
That’s the physics. In physics, we learn what has a 1st-order impact on behavior, and what has 2nd-order, 3rd-order, etc influences. So tidal and the annual cycle is likely forcing ENSO to 1st-order, and sunspots 3rd-order. Wind may be a 2nd-order forcing as it has been shown that thermocline changes lead changes in the prevailing wind, see https://www.nature.com/articles/s41598-019-49678-w. The wind would therefore lag as the pressure differential set up by the (up/down)welling thermocline causes the shift in the winds (i.e. wind is caused by a pressure gradient).. That places it at 2nd-order at best.
Tidal forcing as mentioned by Munk & Wunsch for abyssal processes is therefore the only remaining possibility to drive the erratic ENSO behavior. See this paper by Wunsch for applicability to AMOC in the other RC thread http://ocean.mit.edu/~cwunsch/papersonline/wunsch_2000_moon_climate_nature.pdf
Gavin: “a solar max warms the stratosphere ”
Paul Pukite: “That’s embarrassing” , “equivalent of prescribing Ivermectin”, “you guys claim to understand the physics”, “Especially embarrassing in the context of sunspots having zero effect on the ocean’s thermocline”
Not everything revolves around your hobby horse, ENSO. “ Stratosphere” is NOT in “the ocean thermocline“. “Especially embarrassing” it is only for somebody who has just lectured Gavin, who unlike him, publishes in the best scientific journals, about …. HIS ignorance.
P.S. I might have unearthed archival footage from
your Ph.D. defense , Paul. Or was it the latest, not entirely successful, grant application?
Piotr said:
“Not everything revolves around your hobby horse, ENSO. “
I have several hobby horses when it comes to Earth sciences, Piotr. I spend time researching them dependent on how challenging they are to solve, ENSO being one of the most challenging. That’s the way it is in science, the toughest nuts to crack gain the highest notoriety and sink the most time and effort. The geophysical fluid dynamics encompassed in ENSO involves aspects of solving the Navier-Stokes equation, which is listed as one of the 10 Clay Mathematics Institute millennium problems. https://www.claymath.org/millennium/navier-stokes-equation/
My underlying hobby-horse is trying to piece how it all fits together. https://geoenergymath.com/2024/11/10/lunar-torque-controls-all/
ENSO may be the last piece of the puzzle,
“The geophysical fluid dynamics encompassed in ENSO involves aspects of solving the Navier-Stokes equation, which is listed as one of the 10 Clay Mathematics Institute millennium problems. https://www.claymath.org/millennium/navier-stokes-equation/”
The highly specialized and simplified form of the Navier-Stokes equations that you employ, including terms dropped at solution time, are in no ways whatsoever related to the formulation that is explicitly and completely specified in the Clay problems. The Clay problem does not in fact address solving the equations. Instead, the Clay problem addresses mathematical proof of existence and uniqueness of solutions to the complete formulation of the transient, 3-dimensional, incompressible flow equations. The Navier-Stokes formulation explicitly specified in the Clay problem almost never appears when solving of the Navier-Stokes equations are presented. Approximations for the shallow-water form for flows on a rotating body, and in which a term arising from the rotation is dropped, are no different than the thousands of “solutions to the Navier-Stokes equations” that have been developed over the past 170 years by engineers, mathematicians, and scientists.
Navier-Stokes, primitive equations, shallow-water wave equations, Laplace’s tidal equations, & Euler equations are all variations of fluid dynamics with various terms included. Perhaps the breakthrough on massive geophysical fluid dynamics behaviors such as ENSO will come from the observations of an inverse energy cascade, where the larger the spatial extent or scale the more coherent the structure appears. This is opposed to a turbulent breakdown at finer scales. The Clay Institute deals with pure math problems whereas there are still plenty of applied fluid dynamics math problems to solve.
Existence and uniqueness proofs of PDEs such as Navier-Stokes are the core approach of much of the mathematical study of the subject. Although useful, they don’t provide a lot of information to an actual flow calculation. Moreover, in general, the complete study of applications such as GFD requires the posing of the NS equations together with stochastic forcing. That is a different theoretical problem than that considered by the Clay Institute.
Jonathan David said:
What stochastic forcing? The annual forcing is immense and deterministic, as is the Coriolis effect, which effectively reduces certain classes of turbulence. Tidal forcing is deterministic and has been shown to be the causal leading indicator for equatorial subsurface waves, the latter being the source of ENSO — not wind, which is a lagging indicator (Lin & Qian, 2019). Further, ENSO is a large collective spatio-temporal standing wave behavior with largely fixed node locations, which indicates that an inverse energy cascade (IEC) is likely operable. IEC suppresses smaller-scale turbulence at the expense of tending toward larger scale behavioral shapes. In support of that premise, check this recent paper out: “Sign-Indefinite Invariants Shape Turbulent Cascades” https://bpb-us-e1.wpmucdn.com/wp.nyu.edu/dist/0/18842/files/2024/09/PhysRevLett.133.014001.pdf
Of course this is all just conjecture unless modeling studies can cross-validate against results. It’s not difficult to use only half of the 145-year historical record of climate indices for training to test and thus cross-validate against the other half. Moreover, a common-mode set of basis tidal factors can be used across the spectrum of climate indices, including ENSO, PDO, EMI, IOD, AMO, and NAO, to essentially model each by only changing the final standing wave modulation factor. https://geoenergymath.com/2024/11/10/lunar-torque-controls-all/ In the greater scheme of things, this is a greater practical breakthrough than any piddly $1M prize for solving the Clay N-S problem. The Clay prize is merely a reminder to us how challenging the field of fluid dynamics is.
Paul Pukite: I have several hobby horses
So what – we are talking about the one that you have been obsessing about here. With that attempt to change the subject shot down, we can return to my challenge to your intellectual and ethical integrity:
====
Gavin: “a solar max warms the stratosphere ”
Paul Pukite: “That’s embarrassing” , “equivalent of prescribing Ivermectin”, “you guys claim to understand the physics”, “Especially embarrassing in the context of sunspots having zero effect on the ocean’s thermocline”
me: “ Stratosphere” is NOT in “the ocean thermocline“. “Especially embarrassing” it is only for somebody who has just lectured Gavin, who unlike him, publishes in the best scientific journals, about …. HIS ignorance.
==================
So put the money where your mouth was, Mr. Pukite – PROVE that your attack on Gavin was NOT based on:
a) your inability to understand the difference between “stratosphere” and “ocean thermocline”, nor
b) your intense envy/inferiority complex with respect to the people who unlike you – publish in the best peer-review papers.
====
“Especially embarrassing in the context of sunspots having zero effect on the ocean’s thermocline,”
so tell me, how does that affect STRATOSPHERIC temperatures, which was the subject of discussion in the quote?
Doubling down is not a good approach, especially if you make it clear you haven’t properly read the passage you were criticising.
Paul, I read your “Attributing solar sunspot cycles to climate variation” again, and if I use the dictionary definition of verb “attribute”, it appears that you think that they were claiming climate variation is the cause of solar cycles.
Is that what you think they were saying? Because as others have noted, it would be accurate to attribute a bit of climate variation to solar cycle changes in insolation – and they said “a solar max warms the stratosphere”
Scores of climate change deniers, AGW skeptics, or whatever you want to call them prefer to apply sunspot variation as an alternate theory to the GHG model. They do this (IMO) because:
1. Mainstream climate scientists keep citing solar variations as a contributing factor (however marginal it may in fact be).
2. Sunspots have shown larger variability in the past, i.e. Maunder Minimum.
3. There is no good model for predicting sunspot cycles, so they can claim that climate predictions are equally uncertain.
Think of all the deniers that push sunspots as an alternative model of climate change : Zharakova, Soon, Scafetta, etc. And Svensmark, who gained it more legitimacy by being able to secure time and funds at CERN to do iffy experiments.
It was Gavin himself that posted this RC article (w/MM) “The Trouble with Sunspots” https://www.realclimate.org/index.php/archives/2006/09/the-trouble-with-sunspots/
That was in 2006 and I had been blogging for a couple years already so took note of those kinds of observations by Gavin, Michael, and others as to the marginal impact of sunspots on climate variability.
I’m not going to get involved in subjective prose wars, as people like Piotr always attempt to smear me with. So did I apply the word “attribute” or “attribution” correctly? If you all think that is all that is important, all I can do is sigh.
To Dikran: read my Wiley text “Mathematical Geoenergy”. It was peer-reviewed and a lot of sweat went into that work. I was able to elaborate on topics to a greater length than I could in an ordinary research article. The blog I write now, updates the findings, https://geoenergymath.com/2024/11/10/lunar-torque-controls-all/, and continues my research into solidifying a unifying concept, which the monograph started. There is a possibility that the publisher could even revise as a new edition, which book forms allow. The John Wiley editor made a good call in guiding the book through publication — half is on FF/oil depletion which is standing the test of time, continually updated on the POB blog by my co-author. BTW, we are doing this with no outside funding.
Good luck to all in the Trump generation – we will do OK ;)
Hi Paul. “So did I apply the word “attribute” or “attribution” correctly? If you all think that is all that is important, all I can do is sigh.”
Sorry, I grew up in a family with teachers and lawyers, and words do matter – so you didn’t read things backwards – but you object to mention of a cyclic component of overall temperature fluctuations, seeming because dishonest climate messaging abuses solar cycles. Well, they abuse all the rest of the science while they’re not ignoring it instead, so I don’t see why Gavin and the rest should avoid even pointing out that it’s there. Problem with that approach is when something minor is left out – the deniers pounce again. Not mentioning things isn’t going to improve the quality of what gets out to the public, unfortunately.
Here’s a nice, detailed piece about solar cycles and our temperatures from the NOAA site, published in 2009 – I recommend readers look quickly.
https://www.climate.gov/news-features/understanding-climate/climate-change-incoming-sunlight
And a TSI graph https://www.climate.gov/media/13199
I suggest reading quickly because the NCEI pages at NOAA have a banner message that might be benign, but mischief on federal sites has already begun under the new “management”.
Here’s their warning: “Please note: Due to scheduled maintenance, many NCEI systems will be unavailable February 4th, 12:00 PM ET – February 6th, 8:00 PM ET. We apologize for any inconvenience.”
I’ve been in IT for decades and scheduled maintenance during the business week isn’t what I typically plan for. I’ll certainly spend some time late this week looking for what’s still there.
b fagan said:
Well, they leave out the major annual/seasonal signal from the model without fully appreciating the implications of that decision. Consider this logical assertion born from experience: `For modeling of time-series, it may be important to leave a Fourier component in place during the fitting process since a physical model may require that as a non-linear mixing term. Whereas if that Fourier sinusoidal coefficient is filtered out, there is no remnant of that term, so the amount of mixing can’t be calibrated. Give examples of where that may happen.` I know of some applications where this is an important consideration, but this is what DeepSeek responded with given that prompt: 3. Climate Science: Ocean Tides and Atmospheric Oscillations
Scenario: Ocean tides and atmospheric oscillations (e.g., El Niño-Southern Oscillation, ENSO) exhibit periodic behavior driven by gravitational forces and ocean-atmosphere interactions.
Importance of Fourier Components: The Fourier components of these systems correspond to tidal harmonics or climate modes. Non-linear interactions between these components (e.g., tidal mixing or ENSO teleconnections) are critical for understanding the system’s behavior. Filtering out these components would eliminate the ability to study how these interactions influence climate variability.
It is obvious that the annual and ENSO contributions are at least 100x stronger than the minor impact of sunspot variations, yet they don’t get included in any projections. As I have mentioned before here, this is an important consideration mentioned by others, such as from this NASA JPL proposal by Claire Perigaud where this was deemed critical but the project was not funded, in her words “proposed solutions were not considered because of various factors including economic and scientific pressure to publish and continue the standard agenda” Read the full response in the wayback archive:
https://web.archive.org/web/20201101002715/http://www.moonclimate.org/docs/forenote.pdf
The standard agenda seems to be to pay lip service to inconsequential factors such as sunspot variations while ignoring, albeit perhaps out of limited analytical capabilities, the actual much stronger factors governing the temperature variability.
bfagan to P.Pukite: “you object to mention of a cyclic component of overall temperature fluctuations, seeming because dishonest climate messaging abuses solar cycles”
I don’t think he objects to mentioning a cyclic component as a way to question/dilute the
dominant role of GHGs in driving GW, and therefore absolve the human emissions of those. He merely objects to questioning/diluting the dominant role of GHGs in driving GW
using …. not his favourite cyclic component, ENSO (ENSOscillation!).
To support this are the past discussions in which Mr. Pukite vehemently resisted the message that the oscillations around the mean have very little influence on the long-term (climatological – 30 years walking-average (a.k.a. a “trend”) that is AGW. Quite the contrary, he advocated shifting the research interest and resources AWAY from GHGs and AGW and to his ENSO, and promising that his better prediction of the timing of the next El Nino can save countless lives!
And if you thought that it meant “very many” lives – you could not be more wrong – when asked to suggest realistic ways to save very many lives. PP first tried and failed, and then went all …semantic – yes, the same guy who condescendingly sighs at you:
PP “ I’m not going to get involved in subjective prose wars[…] So did I apply the word “attribute” or “attribution” correctly? If you all think that is all that is important, all I can do is sigh.
a few months back rested his ENTIRE defense on … an obscure use of word “countless” – he lectured me that when he advocated shifting resources from studying AGW to ENSO by promising saving “countless” lives, any reasonable reader would have known that he DIDN’T promised saving very large number of lives, but obviously saving … “ unknowable number of lives“.
I can already imagine Paul’s elevator pitch to the head of NOAA:
– “If you only shift the resources from Gavin’s group modelling AGW to my studies of ENSO, I promise you to save no, not very many lives, but in fact … unknowable number of lives maybe many, maybe few, maybe none – no-one will ever know! What do you say to that?”
Then again, in the new Trump reality the answer may be:
Go ahead, my boy, in our tremendous Trump OAA, we no longertolerate anti_American data and studies of the so-called “Global Warming”. ENSO, evaporation and solar cycles it is !
As Tommy Lee Jones said in The Fugitive “I don’t care”.
My only objective is to correctly model natural climate variability, and if I subjectively tilt towards trying to marginalize approaches that don’t seem productive, that’s fine and in the tradition of scientific discourse.
For example, yesterday I created a PubPeer entry where I pointed out how a 6 year cycle in measurements needs to be more carefully evaluated. https://pubpeer.com/publications/AF152648650A8CD29C9EF1FDCCB97B#
Like sunspots, this is also not a productive course to take. Don’t be chasing these phantoms.
Paul Pukite: “ As Tommy Lee Jones said in The Fugitive “I don’t care””
I have posted FALSIFIABLE arguments questioning the fairness of your attacks onto others: ====
– Gavin: “a solar max warms the stratosphere ”
– Paul Pukite: “ That’s embarrassing” , “equivalent of prescribing Ivermectin”, “you guys claim to understand the physics”, “Especially embarrassing in the context of sunspots having zero effect on the ocean’s thermocline”
===
and demonstrating your double standards:
===
– your dismissal for bfagan questioning the imprecision of your scientific language, while in the earlier discussion your ENTIRE defense of your claims was based on… the semantic – that when making promises that we “can save countless lives” with your ENSO research you DIDN’T mean promises of saving “very many lives”, but merely …unknowable number of lives i.e. maybe many, maybe few, maybe none at al.
– you attacking others for using solar CYCLES to question/dilute the dominant role of GHGs in driving GW, after your presence on RC is devotes to using …. ENSO _cycles_ to question/dilute the dominant role of GHGs in driving GW,
===
To these _falsifiable_ arguments questioning your logic and character you respond with “I don’t care“. Which is consistent with your other posts on RC: you do not come here to learn anything – not about the climate sciences, not about yourself – you are here only to inflate your ego – by promoting your interests as important to the humanity (“can save countless lives“) and by demonstrating your contempt to the top climate scientists (if you understand the climate change better than them – then you must be really really smart!).
Instead of using a pop-culture meme, aimed at making you look cool by associating you with that cool Tommy Lee Jones’s character, I’ll suggest you dig deeper. How about Socrates: “Life unexamined is not worth living“?
Or at least – find a more psychologically-accurate association – perhaps with Melania Trump and her “ I really don’t care, do you? “? Not so cool now, eh? ;-)
“Enhancing Societal Value of Early Warning Early Action and Anticipatory Action Frameworks Using NOAA’s Oceanic Niño Index”
https://link.springer.com/article/10.1007/s13753-025-00625-6
The topic of the quote was STRATOSPHERIC temperatures, not surface temperatures. Sunspots are more likely to have a stronger effect on STRATOSPHERIC temperatures than surface temperatures (e.g. via changes in UV).
I am not paying $200 for a book that doesn’t even mention ENSO in the blurb or the table of contents. I’ll read a peer review journal paper though. Have you submitted the work on ENSO to a journal where ENSO is squarely within the scope of the journal (and hence can expect an expert peer review)?
Thanks for your interest in the book Mathematical Geoenergy. The modeling of ENSO is clearly described in the online blurbs and table of contents. See, for example, here: https://agupubs.onlinelibrary.wiley.com/doi/10.1002/9781119434351.ch12
Because of the way scientific publishing works, one can always get full access to the book contents through a university or though a student, faculty, or alumni online account. Otherwise the cheapest option is to get temporary access to the chapter PDF for $10, link above.
I note you ignored the part about the discussion being about STRATOSPHERIC warming rather than surface warming, and hence your initial post being unfair and factually incorrect.
Actually, no, I don’t have access to the book via my institution. The book is unlikely to have been reviewed by an expert on ENSO as it is only a subtopic of one chapter.
I notice you didn’t answer my question about whether you had submitted your ENSO work to a peer reviewed journal where ENSO was within the scope.
Can you just admit that you misread the original quote (which was about STRATOSPHERIC temperatures) and that your intemperate response was factually incorrect? I suspect not.
I did submit a paper to Physical Review Letters long ago. This is the response that I had archived in my email:
So I submitted the research to an AGU monograph series published by John Wiley. The editor helped guide it through peer-review. An AGU board of reviewers considered my responses sufficient for it to be published. Sorry if that does not meet to your standards.
I note you still haven’t acknowledged that your original comment was factually incorrect because the quote was about STRATOSPHERIC temperatures rather than surface temperatures. At this point it is difficult not to conclude that the evasion is deliberate.
I see you have been less than complete in your submission history
https://esd.copernicus.org/preprints/esd-2020-74/
Not accepted. First review was pretty excoriating:
“To be blunt, trying to shoehorn ENSO into a periodic tidal framework stretches reality
to fit someone’s preconceived theory. Only the most motivated reasoning can believe
this.”
and also mentions lack of proper validation, which IIRC is an issue I have raised before.
“The best way to see the non-tidal nature of ENSO is to note that its behavior is well-
represented in models of the coupled ocean-atmosphere system ranging from the ide-
alized (e.g. Cane and Zebiak 1987 MWR) to modern GCMs … none of which contain
tides. These models DO have predictive skill, which is regularly tested by issuing de-
tailed public forecasts. ”
As I said, I doubt your book was peer reviewed by someone with expertise on ENSO (unlike the above discussion paper).
The latest “Deep Research” variations of LLMs generate quite detailed reports of findings. This is one submitted for the prompt “Explain tidal forcing behind ENSO using derivations based on reduced effective gravity on equatorial thermocline.”
https://geoenergymath.com/wp-content/uploads/2025/02/tidal-forcing-and-enso-dynamics_.pdf
That used Gemini Advanced 1.5 Pro with Deep Research. It raises the question of how much future LLMs will use knowledge spread across sources of information ranging from blogs to peer-reviewed articles.
Dikran mentions: ” non-tidal nature of ENSO”
This is an eye-opener https://geoenergymath.com/2025/01/31/tidal-gauge-differential/
Barring the very long-term rise, tidal gauges primarily measure effects derived from tidal effects. This raises the idea that ENSO is a behavior derived from non-linear tidal effects, The journal ESD Ideas should be about bringing to the fore ideas that are not comprehensively explored by the earth sciences community — and that’s what their charter says “present innovative and well-founded scientific ideas in a concise way (no more than two pages, including one figure or table) “
There be no better example of confirmation bias than getting an LLM to summarise your blog back to you as if it actually meant anything!
Your repeated evasion, after I have pointed it out, demonstrates that it is indeed deliberate. I don’t know how you expect your scientific theories to be taken seriously when you can’t even admit to a simple error (misreading) on a blog. Your choice, of course.
The stratosphere contains only about 1% of the atmospheric mass of the total atmosphere and is stratified to boot so it has little interaction to layers below it. As I said, mentioning sunspots at all is really pointless — see Gavin’s RC post from 18 years ago “The Trouble with Sunspots”, which I linked above.
But certainly, if you want to discuss the stratosphere, start with the origins of the QBO, which I can explain in the same peer-reviewed publication as ENSO. Sadly, in the research literature, one will find the same misleading attribution of sunspot cycles to aspects of QBO behavior, but little to be found on its synchronization with tidal forcing.. Happy to discuss that.. A recent paper out titled “Turbulence in the tropical stratosphere, equatorial Kelvin waves, and the quasi-biennial oscillation” https://www.pnas.org/doi/abs/10.1073/pnas.2409791122
That paper indicates smooth responses on forced gradual plateaus and more turbulent responses on reversing transitions, which may be a key to understanding the fluid dynamics, and how to deal with Laplace tidal equations at the semi-annual synchronization points.
In Re to Paul Pukite, 11 FEB 2025 AT 3:37 AM,
https://www.realclimate.org/index.php/archives/2025/01/comparison-update-2024/#comment-830124
Dear Paul,
I do not understand why you think that for promoting your hypothesis, you need to discredit anyone who mentions the influence of solar activity on climate variability. This phenomenon seems to be well-proven by previous scientific research. Moreover, I do not see any conflict with your hypothesis yet.
For me, your effort looks quite ridiculous and I doubt that it supports your credibility.
Best regards
Tomáš
PP: The stratosphere contains only about 1% of the atmospheric mass of the total atmosphere and is stratified to boot so it has little interaction to layers below it.
BPL: Almost none of that is correct. The stratosphere comprises 20% of the atmosphere, its composition is about the same as the troposphere (aside from almost no water and a lot of ozone), and it isn’t stratified,
“The stratosphere contains only about 1% of the atmospheric mass of the total atmosphere and is stratified to boot so it has little interaction to layers below it.”
Sort of progress, at least now you have now (sort of) acknowledged that stratospheric temperatures were the topic of the discussion, but are still evading the point that your very harsh criticism “Especially embarrassing in the context of sunspots having zero effect on the ocean’s thermocline” was incorrect as sunspots *DO* have a significant effect on stratospheric temperatures, which was the data under discussion.
Sorry, I have seen this sort of rhetorical evasion again and again on climate “skeptic” blogs, perhaps you should ask yourself why you are adopting the same tactics, rather than just admit that sunspots do affect stratospheric temperatures. You have the last word if you want.
Tomáš Kalisz 12 Feb “ Dear Paul, I do not understand why you think that for promoting your hypothesis, you need to discredit anyone who mentions the influence of solar activity on climate variability. ”
That’s because, you are Pukite minus the obsession with ENSO:
Your “Dear Paul” attacks the mainstream science (here Gavin’s) for the same reason you do
– because you are buffoons who do not understand what you read and/or
– you are poor souls in quest for ego validation – if mainstream climate science does not get the importance of [PP – ENSO/TK – water vapour or anything else but GHGs; choose applicable] then YOU (PP; TK, choose the applicable) are really smart, since YOU figured out something the best climate scientists in the world either couldn’t or refused to^*
—–
* the neat MAGA thing about the latter is that it requires the global conspiracy of scientists to keep the truth hidden from the societies.
TK: This phenomenon seems to be well-proven by previous scientific research.
Didn’t stop you in your “anything but GHG” denialism…
TK: Moreover, I do not see any conflict with your hypothesis yet.
That’s because you are projecting your motivations onto Dear Paul.:
For HIM – everything else is a competition to the climatic importance of El Nino. Hence he went here after the solar cycles
.
For you, the “ANYTHING but GHGs” denier – the more the merrier (as long as it diverts attention and research money from the mainstream science talking about the urgent need to reduce GHGs)
TK: For me, your effort looks quite ridiculous and I doubt that it supports your credibility.
Good one, Tomas ;-) The pot never considers himself black.
in Re to Piotr, 12 Feb 2025 at 4:31 PM,
https://www.realclimate.org/index.php/archives/2025/01/comparison-update-2024/#comment-830172
Hallo Piotr,
I indeed do not understand quite often what I read. If repeated reading does not help and I would like to grasp the point, I usually try to ask questions.
I suppose that the same may apply for scientists who signed the letter to Science
https://arxiv.org/abs/2501.17208
that I copy-pasted into my post of 7 Feb 2025 at 9:39 AM,
https://www.realclimate.org/index.php/archives/2025/02/unforced-variations-feb-2025/#comment-830032
I may be well a buffoon. Nevertheless, do you think that physicists and biologists who raised in this letter their concern that record temperatures observed during the last two years might have resulted from a “biospheric feedback” did so for their ego validation? And, do you read their letter as an “attack” on mainstream climate science?
I do not believe in a global conspiracy of climate scientists. Nevertheless, in view of previous discussions on this website, I tend to share the concern that mainstream climate science may suffer from a confirmation bias, by assuring itself how well the models fit with observed development of global mean surface temperature, and neglecting the possibility that this fit might have been in fact achieved on expense of a very poor fit with development of global hydrology. As it appears that we, unfortunately, do not have a good global reconstruction of the past precipitation and their distribution between land and sea yet, I can imagine that this “vicious trade-off” may indeed remain invisible.
I do not think that any of the scientists who undersigned the brief to Science proposes that climate science has to ignore the role of rising concentration of greenhouse gases in global warming and/or that they suggest that reduction of anthropogenic greenhouse gas emissions is a bad idea. I share, however, their concern that policies for global warming mitigation focused solely on greenhouse gases may fail if there in fact was/is also another anthropogenic contribution through an “ecosystem (disruption) forcing”, which we will left unfixed or, in the worst case, even enhance due to our ignorance, e.g. by treating forests as “biomass” source for fossil fuel replacement or by unsustainable agricultural practices.
Greetings
Tomáš
TK: “If repeated reading does not help and I would like to grasp the point, I usually try to ask questions.”
I was talking about when you and Pukite can’t understand what you read, yet you are so certain that you undertood it, that you base on this understanding your attacks on other people:
See Pukite attacking Gavin:
– Gavin: “a solar max warms the stratosphere ”
– Paul Pukite: “ That’s embarrassing” , “equivalent of prescribing Ivermectin”, “you guys claim to understand the physics”, “Especially embarrassing in the context of sunspots having zero effect on the ocean’s thermocline”
Or Tomas Kalisz attacking Gavin
– Mark Matson ask Gavin for : “the Y-axis to start at zero, and the X-axis going further back in time”
– Gavin produces exactly that – a figure with …. “the Y-axis starting at zero, and the X-axis going further back in time” (years 0-2020)
– Tomas Kalisz: “your graphics does not respond to the request”, “assertion having no support in the graph”, “your answer was not very helpful”, “ absence of any meaningful answer” “[replying] with a meaningless graphic”.
Those are NOT the words of somebody who acknowledges his not understanding, and who is humbly asking for help in understanding. With you attempt to deflect with false humility swept asunder, we can return to my post:
=====
P: Your ”Dear Paul” attacks the mainstream science (here Gavin’s) for the same reason you do:
[ because you are buffoons who do not understand what you read and/or]
– you are poor souls in quest for ego validation – if mainstream climate science does not get the importance of [PP – ENSO/TK – water vapour or anything else but GHGs; choose applicable] then YOU (PP; TK, choose the applicable) are really smart, since YOU figured out something the best climate scientists in the world either couldn’t or refused to^*
—–
^* the MAGA flavour of the latter is that to sustain it – the denier needs the global conspiracy of scientists trying to keep the truth hidden from the societies.
TK: This phenomenon seems to be well-proven by previous scientific research.
Didn’t stop YOU in your ”anything but GHG” denialism…
TK: Moreover, I do not see any conflict with your hypothesis yet.
That’s because you are projecting your motivations onto Dear Paul.:
– For P. Pukite – everything else is a competition to the climatic importance of El Nino. Hence he went here after the solar cycles
.
– For you, the ”ANYTHING but GHGs” denier – the more the merrier (as long as it diverts attention and research money from the mainstream science talking about the urgent need to reduce GHGs)
TK: For me, your effort looks quite ridiculous and I doubt that it supports your credibility.
Good one, Tomas ;-) The pot never considers himself black.
============
in Re to Piotr, 15 Feb 2025 at 11:15 PM,
https://www.realclimate.org/index.php/archives/2025/01/comparison-update-2024/#comment-830287
Dear Piotr,
In its entirety, the question asked by Mark Matson on 3 Dec 2024 at 11:55 AM and the reply by Dr. Schmidt
https://www.realclimate.org/index.php/archives/2024/11/twenty-years-of-blogging-in-hindsight/#comment-827818
read:
“What would add context to the Keeling Curve above is a delineation of anthropogenic and non-anthropogenic CO2 contribution to the atmospheric CO2. A change in the scale of the Y-axis to start at zero, and the X-axis going further back in time will also clarify the magnitude of of the contributions.
[Response: Like this? https://www.realclimate.org/images//co2_ghe1.pdf – gavin]”
I think that the core idea of the proposal made by Mark (which I have understood rather as a question) was the “delineation” of the curve in the sense of splitting it into several contributions, not shifting the axis etc. which would ALSO “clarify the magnitude of the contributions”.
Although the reply provided by Dr. Schmidt might have been understood as a hint that the question as asked may be improper, because there is a consensus that the ENTIRE rise of the Keeling’s curve is caused by anthropogenic CO2 emissions, I was somewhat disappointed by his omission of the possibility that “delineation” of the curve another way (e.g., by splitting it into contributions from fossil fuel combustion and from other sources (that include also “biomass” combustion as a fossil fuel replacement) could be perhaps still helpful and instructive.
Therefore, I still hope that my objection (that his reply was not helpful) was not an unfair attack against Dr. Schmidt, nevertheless, I would like to apologize that I expressed my disappointment about a missed opportunity somewhat impolitely.
Best regards
Tomáš
P.S.
As showed the discussion about isotopic patterns of various CO2 sources that followed, splitting the Keeling’s curve into a “fossil fuel combustion curve” and “other sources curve” may not be as easy as I thought. It seems therefore well possible that, contrary to my original assumption, there is no publication showing the possible development in the ratio of contributions from various sources to the entire trend yet.
Paul Pukite: In stating “,,,embarrassing to mention sunspots. Attributing solar sunspot cycles to climate variation is the equivalent of prescribing Ivermectin to a medical condition”, you appear to characterize human Ivermectin use as the height of folly.
In the interest of accuracy, Ivermectin is proven and noncontroversial treatment for a number of human medical conditions. That Covid is not one of them is perhaps the source of your misunderstanding.
Ivermectin is applied by contrarians as a all-in-one hammer where every medical problem looks like a nail. Sunspots play the same role in Earth sciences. Contrarians claim sunspots are the solution to every climate problem. My recommendation is not to feed that thought process.
One can say the same thing about my argument for tidal processes as a one-size-fits-all solution to earth science conundrums. The key distinction is that tidal forcing is highly deterministic and therefore has potential for predictability. This is borne out by many geophysical processes that synchronize precisely to tidal cycles, such as variations in length of day and the polar wobble frequency. Alas, contrarians will not align with such an argument because it does have predictability, which is the last thing they want to see, preferring uncertainty and doubt to feed their narrative of science unable to make long-term predictions.
Paul Pukite: “ Ivermectin is applied by contrarians as a all-in-one hammer where every medical problem looks like a nail. Sunspots play the same role in Earth sciences. Contrarians claim sunspots are the solution to every climate problem.”
If you are in the hole, Mr. Pukite, stop digging. You used your analogy to Ivermectin NOT against some nebulous “contrarians”, but against a very specific target – Gavin Schmidt, I quote:
Gavin “There are two potential issues – the timing of the solar cycle 25 (a solar max warms the stratosphere)
You, after QUOTING Gavin:
PP: That’s embarrassing to mention sunspots. Attributing solar sunspot cycles to climate variation is the equivalent of prescribing Ivermectin to a medical condition. Perhaps worse because you guys claim to understand the physics.
And not satisfied, you followed up next day:
PP: “Especially embarrassing in the context of sunspots having zero effect on the ocean’s thermocline”
You have been on this forum long enough to read many 10s? 100s? of Gavin posts. And after reading so many Gavin’s post honestly believe that Gavin … is a contrarian who dismisses the dominant role of GHGs in AGW by “ claiming sunspots are the solution to EVERY climate problem ” ??
This leaves two possibilities:
– either you are an arrogant idiot – one who hasn’t understood A THING from the 100s? of Gavin’s posts, and based on your own inability to read – you contemptuously lecture Gavin on _his_ “embarrassing” ignorance, and compare _him_ to the antivaxers pushing Ivermectin?
-or you are just another pathetic troll in search of ego gratification – if I, Paul Pukite, can call out Gavin Schmidt on his “embarrassing” ignorance, and portray him as WORSE than an antivaxer, then surely I, Paul Pukite, must be of superior intellect.
And as with other ego-gratifying losers – when challenged, you don’t even have the balls to admit it and instead, you double down and/or try to redirect the discussion onto a tangent.
By their fruits you shall know them – Paul Pukite, the man he really is.
Paul Pukite- The development of anthelmintics (Ivermectin being the most effective) was significant enough to earn a Nobel Prize in Med/Phys. ‘Ivermectin for health conditions’ is nothing like sunspots and climate change. The adoption of Ivermectin for Covid by the nutcase crowd has given it a reputation as a fake drug which is absolutely undeserved. In the interest of accuracy, at least, best to own your error.
Richard Creager,
The legendary Galileo Galilei discovered sunspots. Alfvén won a Nobel prize on associated solar corona research. Doesn’t mean sunspots have anything to do with AGW.
Yet, this stuff keeps popping up from climate change deniers:.
https://cdn.bsky.app/img/feed_thumbnail/plain/did:plc:2ge3m52s47jdba642nmukk3q/bafkreiaoykz2atuddp766s2celq4f5rfvrae4tm6c7hzrnlkn5tr7vrmbu@jpeg
where Milloy claims “Cosmic rays clear up the climate hoax”
There’s a more recent RC post by Gavin “Why are so many solar-climate papers flawed?”
https://www.realclimate.org/index.php/archives/2020/03/why-are-so-many-solar-climate-papers-flawed/
Gavin asks:
Richard, best to own your conformation bias and not die trying to defend this hill.
OTOH, the TRULY SIGNIFICANT solar (i.e. annual) signal when non-linearly interacting with tidal forces can explain natural climate variability, along with other geophysical phenomena =>
https://geoenergymath.com/2024/11/10/lunar-torque-controls-all/
Paul Pukete, Im not sure why you are so dismissive of the effect of sunspot cycles. My understandibg is the 11 year sunspot cycle causes changes in the solar radiation reaching earth that can alter temperature by about 0.1 degrees c. Small but not insignificant. Longer cycles can be more significant. The longer term sunspot cycle in recent decades has been a cooling cycle so obviously can’t explain the warming trend.
I agree the denialists falsely blame global warming since 1900 on solar cycles and come up with all sorts of crazy theories on it.
NigElj said:
” Im not sure why you are so dismissive of the effect of sunspot cycles. “
I’m not the only one that is dismissive. The main contributors of this RealClimate blog have long criticized the the undue focus on sunspots as a contributor to climate change
“Why are so many solar-climate papers flawed?”
https://www.realclimate.org/index.php/archives/2020/03/why-are-so-many-solar-climate-papers-flawed/
“The Trouble with Sunspots” https://www.realclimate.org/index.php/archives/2006/09/the-trouble-with-sunspots/
“More Solar Shenanigans”
https://www.realclimate.org/index.php/archives/2024/03/more-solar-shenanigans/
“The Lure of Solar Forcing”
https://www.realclimate.org/index.php/archives/2005/07/the-lure-of-solar-forcing/
“Recent Warming But No Trend in Galactic Cosmic Rays”
https://www.realclimate.org/index.php/archives/2004/12/recent-warming-but-no-trend-in-galactic-cosmic-rays/
“There is little evidence for a connection between solar activity (as inferred from trends in galactic cosmic rays) and recent global warming.”
‘Cosmoclimatology’ – tired old arguments in new clothes
https://www.realclimate.org/index.php/archives/2007/03/cosmoclimatology-tired-old-arguments-in-new-clothes/
“Why the continued interest?”
https://www.realclimate.org/index.php/archives/2009/10/why-the-continued-interest/
So don’t blame me. I’ve read this blog for years and have learned well how to be dismissive.
Paul Pukite. I did not say I can’t understand why you are so dismissive of the effect of sunspot cycles on our recent climate change since the 1970s. I said I’m not sure why you are so dismissive of the effect of sunspots, meaning in a general sense, surely obvious in my next paragraph where I mentioned the effect of the 11 year sunspot cycle. Do you disagree that it changes temperature by about 0.1 degrees? But obviously it cannot be causing climate change it’s just a short term cycle.
I haven’t seen any evidence that climate change since 1970 is caused by sunspots. / solar irradiation Your links are great and seem irrefutable to me.
“Attributing solar sunspot cycles to climate variation”
That would indeed be insane, since it gets the causal relation backwards. But who has done this?
Hi Gavin, is there a site that i can get the maximum and minimum worlds average temperatures on a yearly basis?
Cheers.
Simon,
If you’re after annual averages of daily high temperature and daily low temperature (which would apply only to land SAT), Berkeley Earth have both graphed out and link to the data HERE.
If you’re after the average over the land and oceans, you are presumably after the absolute temperature version of the monthly or perhaps daily global SATs showing the annual cycle with its max & min. The absolute temperatures require the temperature of the anomaly base by month or perhaps day. This will require a bit of data manipulation by you and the absolute anomaly base data can be well tucked away. For GISTEMP this page appears to show it. Berkeley Earth show it in the header to the data HERE. (Note there are two sets of anomaly data.) ERA5’s Climate Pulse site graphs out absolute daily global temperature and below the graph is a download button for the 85 years of daily data.
Thanks MA Rodgers
It would be helpful to provide the conversion from 1979-1983 to 1850-1900 baselines.
It would have been helpful if the antebellum United States had launched weather balloons or satellites so that we’d know the 1850-1900 baseline. As it is, surface temperatures are about the only thing measured well enough to provide a global baseline for 1850-1900, and even then just barely.
Dan Miller,
The 1979-83 anomaly base applies to the SST data. HadSST4 & ERSSTv5 understandably show the warming a little different back in the nineteenth century (see graphic HERE). 1979-83 relative to 1850-1900 come out as HadSST = +0.42ºC & ERSST = +0.32ºC.
I wouldn’t know how to show the combined uncertainties from each observation dataset, but note the wide confidence limits around Berkeley Earth’s rigorously QA’ed 19th century measurements and even through the first half of the 20th, compared to more recently:
berkeleyearth.org/wp-content/uploads/2025/01/2024-Global-Time-Series-1536×846.png
As Dr. N-G says, As it is, surface temperatures are about the only thing measured well enough to provide a global baseline for 1850-1900, and even then just barely.
Gavin briefly discussed the choice of baseline last month (realclimate.org/index.php/archives/2025/01/2024-hindsight). He’d prefer 1880-1899, but:
The people have spoken, and they have collectively agreed that ‘pre-industrial’ can be thought of as the average of 1850 to 1900.
My link to the BEST full time series with error bars isn’t stable. The graphic appears on their most recent global temperature update:
berkeleyearth.org/global-temperature-report-for-2024/
While the globally averaged T anomaly is managed to be kept on track at the surface and stratosphere, how do the screened models compare to the mechanisms of energy accumulation, i.e. the ambiguous forcing and feedbacks observable as TOA all-sky trends of absorbed solar radiation and canonical greenhouse effects? (a la CERESMIP). Thanks
NASA have provided a handy explainer Paul (minus the physics of why more sunspots = more irradiation): https://spacemath.gsfc.nasa.gov/sun/Earth8.pdf
If one takes the NASA GISTemp annual (J-D) anomaly data from 1970 forward and plots the year-over-year rate of change values the strong upward trend becomes substantially lowered…moderated. Perhaps someone can explain that phenomenon.
If one actually shows their work to experts, then experts have a much easier time explaining what you’ve done to you that you didn’t understand.
What specific variables did you construct using what specific level of aggregation” What was the level of significance of your “substantially lowered” value?
Should be only about a 10 line R-script to show your work. Please do said and show the world.
Probably something to do with wishful thinking, unreliable memory, confirmation bias, and looking at it through a mirror while standing on your head and squinting through a tiny gap in your fingers, Ken.
Interesting post. But I’m afraid that the hopeful “see you next year” will demand a whole lot of political activism from all scientists and rightminded citizens against the current administration, ie. the sadopopulist fossil oligarchs who won the last US elections, since they are now engaging in a total war against both science and democracy: https://www.nature.com/articles/d41586-025-00266-1 . “Researchers in the United States are reeling after the administration of new president Donald Trump issued an order on 27 January that froze all federal grants and loans. A federal judge in Washington DC temporarily blocked the order late today, but it had already spurred many US universities to advise faculty members against spending federal grant dollars on travel, new research projects, equipment and more.
The Republican-led administration issued a subsequent memo today attempting to clarify what is and is not covered by the freeze, but it included no information specific to scientific funding, leaving many scientists just as confused as when the order was issued.”
The discussion about whether this is fascism or not is rather irrelevant, since the catastrophic results in the longer run will be the same anyway.
Mostly it will mean that US research will be ignored just like Russian genetics research was ignored during the Lysenko era.
I have started referring to Soviet Science – only that which matches the accepted ideology. Even if short-term funding returns to NIH, the writing is on the wall.
Nevertheless, Soviet science did make some contributions. Let’s not underestimate it just because it was ideologically controlled (not that that’s good thing for science, of course).
Not in genetics, much. Vavilov saved lots of seeds from destruction (and starving Russians) which became a huge basic resource.
Dobzhansky did some good work on population genetics but left Russia because of those “ideological controls”. (Ya’ think that’s not happening already in the US???–there are free places left on the globe, you know.). A couple of others in population genetics.
But population genetics is more stats and modeling than lab science.
Soviet diktats affected not only biology, but also chemistry. Researchers were not allowed to investigate rare earth chemistry, as this was not deemed “useful” for the proletariat. This led to some rather nervous moments when the Soviet nuclear program needed to understand actinide chemistry (which is similar to rare earth chemistry) to extract Plutonium for the Soviet bomb. OTOH, Moscow had an actual deliverable H Bomb before the US…but didn’t know it.
Well, a little bit to early, maybe? There seems to be some resistance even in the US. See fx. https://www.404media.co/archivists-work-to-identify-and-save-the-thousands-of-datasets-disappearing-from-data-gov/ . Maybe this link is useful to some here on this site?
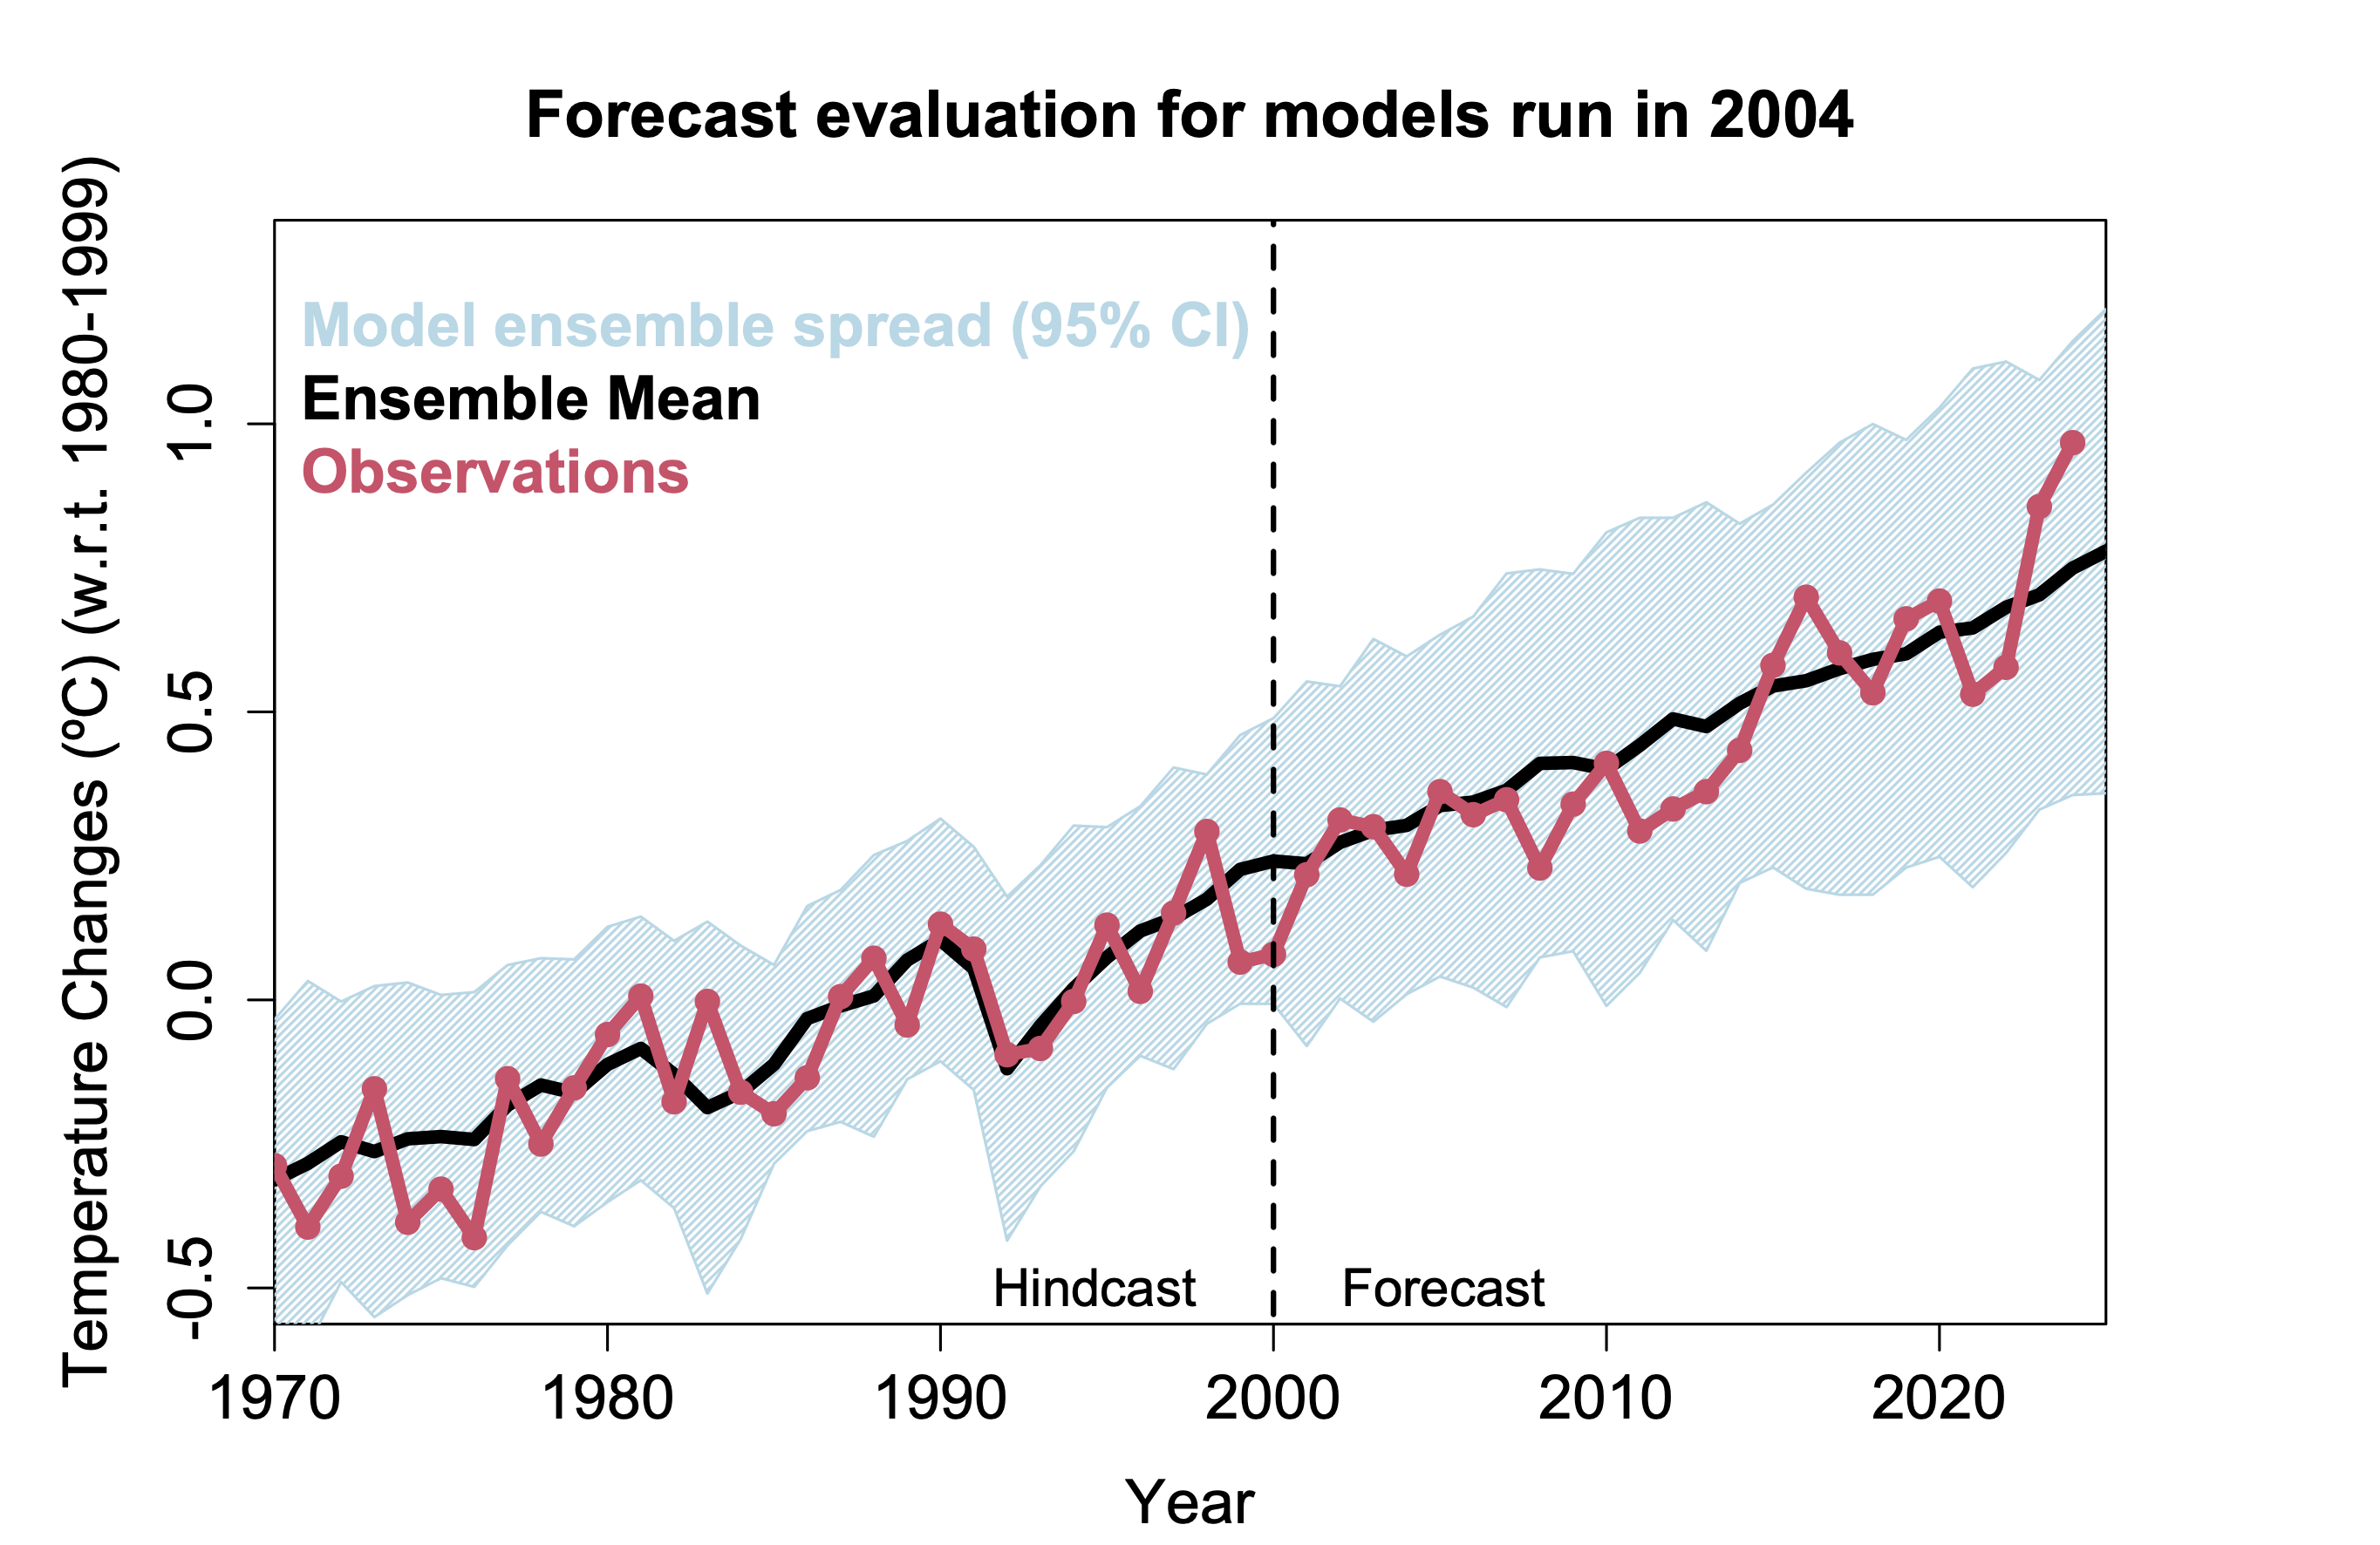
The model data comparison graph of the forecast models run in 2024, the warming trend follows the ensemble mean quite well from 1970 – 2005, then droops below the ensemble mean from about 2005 – 2015 (during the so called pause) and rises above the ensemble mean from 2015 – 2024 by a very roughly similar amount. Has anyone looked at whether whatever caused the drooping period during the so called pause has reversed to cause the recent temperatures to rise above the ensemble mean? I ask as a non expert.
Either way we clearly have a massive anthropogenic warming problem, caused in large part by burning fossil fuels. And I realise there are several possible explanations for the anomalously high temperatures last couple of years.
Gavin wrote: “See you next year!”
I hope so. The way things are going right now, by next year research into climate change may be illegal in the Republic Of Trump (a.k.a. The ROT). Perhaps you’ll be posting from Europe.
Hi Gavin,
Thanks for all these comparisons.
You mention in the CMIP5 post 2005 the RCP4.5 is used, but in CMIP6 you only mention the SSP is used from 2015. Is this all SSPs or only SSP2-4.5? If the latter would it be worth looking at the other scenarios, or would there be little difference over 10 years?
In the CMIP6 plot would it be possible to use a different colour for the “new climate model (CMIP6)” mean , I find it difficult to see on top of the TCR model spread. This non-TCR limited values seems to be spot on for 2024!!
Paul Pukite: “ subjective prose wars, as people like Piotr always attempt to smear me with ?
Huh? “ The stratosphere ” is NOT the same as “ ocean’s thermocline “, Mr. Pukite – ergo the difference between these two is NOT “subjective”.
Quite the contrary – it is as objective as they come, and as such – is central to the logical testing of your “proof” of Gavin’s “embarrassing” ignorance of the Earth’s physics, I quote:
– Gavin: “a solar max warms the stratosphere ”
– Paul Pukite: “ That’s embarrassing” , “equivalent of prescribing Ivermectin”, “you guys claim to understand the physics”, “Especially embarrassing in the context of sunspots having zero effect on the ocean’s thermocline”
And what does it tell about you, Paul Pukite – that my QUOTING you YOUR OWN WORDS – you characterize as an attempt to …. SMEAR YOU? You are what you write, Mr. Pukite.
Re: “(It would be nice to have some non-temperature variables in the mix – feel free to suggest some if you can point to (or post) an archive of the models historical+projected results).”
I’ve cited the IPCC 1990 report before. But I understand if the RealClimate team think it’s best not to add it, if there are plenty of temperature comparisons already:
https://www.realclimate.org/index.php/archives/2025/01/unforced-variations-jan-2025/#comment-829310
In terms of non-temperature variables, they could look at northern hemisphere sea ice extent, as suggested by Roger Pielke Sr:
figure 2 of: https://www.science.org/doi/10.1126/science.286.5446.1934
https://pielkeclimatesci.wordpress.com/2012/04/20/sea-ice-prediction-update-to-2012/
https://pubpeer.com/publications/8AB53E8AC964263F1FD8F80B4B8AC6
He elsewhere also suggested ocean heat content, but his reasoning on that is sketchy:
https://pielkeclimatesci.wordpress.com/2007/04/04/a-litmus-test-for-global-warming-a-much-overdue-requirement/
Or, better yet, skip over the useless analysis by Roger Pielke, and go directly to Tamino’s post(s) showing more up-to-date and more correct information.
https://tamino.wordpress.com/2012/04/23/do-the-math/
DOAK: It’s important to recognize the difference between Pielke Sr. and his son Pielke Jr. Senior is a real climate scientists and is not altogether phony. Junior is a political scientist engaged in denial of earthly and scientific reality for profit and fame. Of course he is loyal to his son, and that is sad.
Oh, I agree that Pielke Sr.’s commentary was unreliable and I’m aware of Tamino’s apt criticism of it. Pielke Sr. didn’t account for basic points like how internal variability biases comparisons over very short periods of time, in which a multidecadal forced response has not had enough time to build up. I mentioned Pielke Sr. because that would undermine other contrarians’ possible complaints about including that projection.
There’s also a PubPeer thread that covers how a ‘models vs. observations’ comparison could be done for that paper:
https://pubpeer.com/publications/8AB53E8AC964263F1FD8F80B4B8AC6
The modeled projections in figure 2 start at different absolute values for sea ice. That could be addressed in a comparison to observations by focusing on quantified trends with CIs, or by showing the sea ice as an anomaly relative to a baseline period.
Gavin, if it’s not a huge hassle, could you also update the figure from this post? https://www.realclimate.org/index.php/archives/2024/04/much-ado-about-acceleration/; especially the one that shows CMIP6, obs, and the Hansen et al 2023 projections? Could come in handy with the new Hansen paper.
[Response: Done! https://www.realclimate.org/images/compare_obs_plus_hansen-1536×1131.png – gavin]
Is there an update to plot sea level graph data to temperature, as has been done by Vermeer and Rahmstorf in 2009 https://www.pnas.org/doi/10.1073/pnas.0907765106 and another study from 2014 https://sites.stat.washington.edu/peter/statclim/bolin_2014.pdf Has this been done with more recent data and projections, see for instance here https://climatestate.com/the-exponential-growth-of-global-sea-level-rise/
More recent data should provide more precise results, i.e. when accounting for the current acceleration since 2023.
I think in too many cases here, it’s time to revive the classic description:
“not even wrong”
This would be better than detailing at length and repeatedly the parts of these arguments which are irrelevant to the conditions in which we find ourselves at this present. Please stop empowering dumb stuff: keep it short and don’t repeat.
Susan Anderson, I agree with the majority of your views on things, but I don’t like the phrase “not even wrong”. Too many people would take it literally or miss the point. Scientists and academics forget the average IQ is 100. Just tell it like it is and keep it simple; “Its wrong.”
One of the problems with science communication has been excessive complexity and “nuance” and one reason the denialists (and Trumps team) score points is they keep the messaging short, simple and impactful, and obvious. Of course its mostly lies, but that’s not the point.
nj, good points. I’m impatient with excessive detailing of what should be straightforward. I guess what I was aiming for was to get through to some who are inclined to go over and over similar points. For those proficient in scientific argumentation (which I am not), right or wrong, it does come across as navel gazing rather than advancing the discussion.
Here’s a thought: how’s about ‘not even right’ (just kidding).
—
One reason I keep harping on weather trends is lies don’t work.
I suppose we could instead use the common synonym for “not even wrong”: bullshit. It is perhaps cruder than Pauli’s eloquent phrase, but it is a reasonable translation to the language of the great unwashed.
In science:
“Right” is provisional until something better comes along
“Wrong” can at least be corrected
Bullshit is forever, because it strives to be so vague and so devoid of prediction that it cannot be refuted. It just sits there in the treads of your shoes and stinks.
Thanks Ray. I want good people to stop detailed deconstruction of ‘bullshit’ which wastes their own and everyone else’s time.
I would avoid the trope ‘great unwashed’ because these people are not defined by their state of cleanliness but by their embrace of lies, ignorance, and delusion.
Propaganda isn’t generally effective UNLESS it lacks nuance and complexity.
It’s reasonably easy to engage the lizard brain with simple click-bait lies. Oh, like “I never heard of Project 2025” or “I’ll drop egg prices tomorrow” or “I’ll end the war in Ukraine in 24 hours” as these are things that lizard brains can react to regardless of any truth.
Tomas Kalisz In its entirety, the question asked by Mark Matson on 3 Dec 2024 at 11:55 AM and the reply by Dr. Schmidt”
This would be relevant ONLY if the REST of the quote invalidated the part that I quoted:
– Mark Matson asking for: “the Y-axis to start at zero, and the X-axis going further back in time””.
IT DOESN’T
Tomas Kalisz ” I think that the core idea of the proposal made by Mark was the “delineation” of the curve in the sense of splitting it into several contributions, not shifting the axis etc. which would ALSO “clarify the magnitude of the contributions ”
By capitalizing ALSO and dismissing the Gavin graph, you imply that “clarification of the magnitude of the contributions” – was an … afterthought to the main request of the “delineation”.
In fact Gavin’s graph does BOTH – you COULDN’T “clarify MAGNITUDES of A and B, if you were not able to separate (“delineate”) them first.
SO being able to QUANTIFY A and B is not an icing on the cake as – it is the damn cake!
That’s the reason why M. Matson didn’t request a graph that would do ONLY delineation – he DID request the graph that allow NOT ONLY separation of A and B, but “ALSO” quantification of those A and B:
– extending the Y axis to 0 ppm – is needed to get the total amount of CO2 (=A+B)
– while “going further back in time”, in this case 2000 yrs back in time – the anthropogenic contribution was negligible gives as the “non-anthropogenic contribution” (A= 280 ppm).
This from the extended by Gavin Keeling curve- Mark got
– “delineation” – EVERYTHING above 280 ppm is “anthropogenic”, and for each data point “we can ALSO clarify the magnitude of the contributions” – for instance at pCO2 of 420 – anthropogenic component = 420-280= 140ppm, non-anthropogenic component =280ppm. Should be too difficult to understand even to a complete ignoramus.
But apparently not to Tomas Kalisz – this guy thinks he knows BETTER what Mat Matson was asking for when he asked Gavin for the specific modifications of the Keeling graph, and being himself a semi-illiterate ignoramus unwilling to pick up a textbook – attacks one of the best climate scientists Gavin for …. providing the very graph that Mat Matson has requested, and for ignoring Kalisz’s ignorant demands for answers:
– “your graphics does not respond to the request”,
-“ assertion having no support in the graph”,
– “your answer was not very helpful”,
– “ absence of any meaningful answer”
-“[replying] with a meaningless graphic”.
Tomas Kalisz about Gavin Schmidt
Could you be any more ignorant and arrogant, Mr. Kalisz?
In Re to Piotr, 17 FEB 2025 AT 3:59 PM,
https://www.realclimate.org/index.php/archives/2025/01/comparison-update-2024/#comment-830324
Hallo Piotr,
Thank you very much for your thorough explanation. I admit that I (incorrectly) understood Mark Matson exactly as you described it. You are right that Dr. Schmidt, actually, provided exactly what Mark asked for.
In this respect, my objection that his answer was not meaningful was indeed unfair and I apologize therefor.
I would like to add only that for plain people like me, a simple answer “There is a broad consensus that the rising trend of the Keeling curve is entirely caused by anthropogenic CO2 emissions.” would have been more straightforward and better understandable than the provided link.
Greetings
Tomáš
TK,
We can figure out the quantity of anthropogenic emissions every year by applying chemical stoichiometry to the known total of fossil fuels burned (and, on a smaller scale, cement poured). Deforestation also adds some, and we can figure that out from log-cutting statistics.
TK: You’re getting there. Well done.
However, I would not describe your lengthy expositions and demands for personal instruction as ‘plain’. To me, they come across as obscure and it is an effort to accept that you do not mean to obfuscate. But if you accept that simple statement, you may dismiss any complaints from this old lady kicking the tires, who ventures in where angels fear to tread.
Arguments over whether reality is real are exhausting, a field of dragon’s teeth. It snares the innocent as well as those guilty of troublemaking for fun and profit.
In Re to Susan Anderson, 18 Feb 2025 at 11:45 AM
https://www.realclimate.org/index.php/archives/2025/01/comparison-update-2024/#comment-830343
Dear Susan,
I used the word “plain” to emphasize that I am not a scientist. On the other hand, my training in macromolecular chemistry included also physics and physical chemistry. That is why I sometimes react with questions to physics- and/or chemistry-related assertions that I do not understand or that seem to contradict teachings I learned years ago.
Greetings
Tomáš
Tomas Kalisz “ my objection that his answer was not meaningful was indeed unfair and I apologize therefor.”
The question is whether the apology is sincere, and not just the tactical retreat in the no-win situation. And its sincerity we will gauge on whether you learn from your baseless attacks on others and from now on wait with attacking others UNTIL you are certain that you understand what the discussion is about. Otherwise, the above would become just another throw-away apology, as inconsequential as the one from Dec. 31 by Dharma (it changed nothing in Dharma subsequent posts).
TK: my objection that his answer was not meaningful was indeed unfair and I apologize therefor.
P: The question is whether the apology is sincere, and not just the tactical retreat in the no-win situation.
BPL: Piotr, forgive me, but while I recognize your point, I think it wouldn’t hurt to be gracious anyway. We may disagree on whether politeness matters, but I’ve come to appreciate it in the face of deniers who are very much not polite. For instance, here’s a rant from a denier in 2009:
“If you had any scientific evidence that human CO2 causes global warming, you would have produced it by now. Ergo, reality eludes you. Don’t believe or argue with me. There are many, many scientists who once rubbed shoulders with the AGW idiots like brothers that can’t take enough showers now to wash off the stink–they’ve come clean and have acknowledged that global warming alarmism is nothing but a hoax. Amaze us all and admit that simple fact. While you’re at it, why not admit that GCMs have been shown to have zero predictive ability? Oh wait, you can’t: that requires an understanding of math. It’s a lot easier for you to stick to the a Leftist-libs’ kind of ‘truth’ and continue sticking science and the search for objective truth in the back.”
TK is a breath of fresh air compared to that.
BPL 21 Feb.
P: The question is whether the apology is sincere, and not just the tactical retreat in the no-win situation.
BPL: Piotr, forgive me, but while I recognize your point, I think it wouldn’t hurt to be gracious anyway.
One swallow does not make a summer, Particularly that It’s not the first summer: TK admitted of being wrong before. And then immediately went back to being himself. Not a unique pattern here – see the Doomer Previously Known as Dharma, who wrote one thoughtful post on Dec.31 and then return a few days later as if nothing happened. So both the history and analogy are not on the side of the genuine intellectual and ethical breakthrough.
Still, by not giving him a blanket absolution, but conditioning it on his future posts – I think I have left the possibility of real CHANGE open – it’s up to him he accepts it or not.
BPL: “We may disagree on whether politeness matters, but I’ve come to appreciate it in the face of deniers who are very much not polite”
Yes, we differ. I don’t suffer the deniers or doomers gladly – nor do I differentiate them based on their politeness – if anything – superficial politeness is often used to deflect/delay the criticism:
Wikipedia: Sealioning is a type of trolling or harassment that consists of pursuing people with relentless requests for evidence, often tangential or previously addressed, while maintaining a pretense of civility and sincerity
The difference between Tomas and say Dharma – is that he is better able to stay in character.
When the “Dharma” reappears as a new persona he STARTS sounding like Tomas – a polite, complimenting the other people, who painting himself as to be somebody merely looking for answers, But Dharma is not as patient (as disciplined?) – he soon he drops the mask of politeness, intellectual openness, and civility (see Dharma’s “Escobar” turning from defending Tomas against our criticism to being scathing to him, all in the space of two posts).
So as opposed to giving Tomas the unlimited benefit of the doubt – I put a testable condition
on accepting his apology as sincere – whether he learns from his mistakes and changes his behaviour or not.
So far – the signs are not good – in the subsequent discussions that he has learned nothing and hasn’t changed at all. Summary of one below.if interested
Piotr
==== In the Feb UV thread:
– P: “the large effect of WV make the climate MUCH MORE VULNERABLE to our changes in the … GHG emissions, not LESS vulnerable”
-TK dismisses it as a … “strong belief”, and “in fact, [a] misleading” one.
– I point that it is not “strong beliefs” in lieu of facts, but a conclusion of a falsifiable argument based on the scientific literature data and challenge him to prove otherwise
– Tomas, UNABLE to do it – tries … to make it into the case of my … wounded pride – explaining to me that he didn’t accuse ME of misleading others, but that … I was mislead (by Schmidt et al 2010 I’ll presume?) into formulating my …”in fact misleading” argument.
I.e. the same arrogant ignorance (his claim of my argument being misleading is based on Kalisz’s inability to read/understand the posts he comments), the same lack of intellectual humility requiring that one has to make sure that it is not us who are missing the point, the same evasion of the responsibility for his words. the same projection of own motives onto the others – (assuming that it is all about ego, not about the truth – that I responded only because I perceived it as an attack on myself, not because I was defending the underlying argument against baseless dismissal) .
In Re to Piotr, 22 Feb 2025 at 12:02 PM,
https://www.realclimate.org/index.php/archives/2025/01/comparison-update-2024/#comment-830508
and 22 Feb 2025 at 12:03 PM,
https://www.realclimate.org/index.php/archives/2025/01/comparison-update-2024/#comment-830509
Dear Piotr,
I wonder why you decided replying to my post of 21 Feb 2025 at 9:14 AM,
https://www.realclimate.org/index.php/archives/2025/02/unforced-variations-feb-2025/#comment-830450
on a different place, although you could reply directy under my post, and why you additionally reply in two further comments mentioned above, which are, moreover, identical to each other.
Could you be so kind and keep the discussion in a single thread?
To enable it, I respond only to the first one of your three reactions, the post of 22 Feb 2025 at 5:34 PM,
https://www.realclimate.org/index.php/archives/2025/02/unforced-variations-feb-2025/comment-page-2/#comment-830519
Thank you for your understanding.
Best regards
Tomáš
As the situation is developing (Trump/Musk/Thiel etc. now saying “check!” to the remaining democracies using Putin and Netanyahu, Bin Salman etc. as levers…) detailed discussions of denialist stuff is just a waste of time and energy. There seems to be some important resistance even in the US. See fx. https://www.404media.co/archivists-work-to-identify-and-save-the-thousands-of-datasets-disappearing-from-data-gov/ . Maybe this link is useful to some here on this site?
Paul Pukite 20 Feb – quotes … an abstract of some paper ;-)
Now SHOW, Mr. Pukite how is this relevant to your past claims here: QUOTE THE SECTION, where they say that a better prediction of the onset of the next El Nino would “ save COUNTLESS lives”. [ (c) P Pukite]
Not mentioning that they seem to be satisfied with … the EXISTING historic data of ENSO – they use a statistical indicator derived from “73-year time series of the NOAA’s Oceanic Niño Index (ONI)”- apparently not needing the modelling of the mechanisms of ENSO and not condition saving COUNTLESS LIVES on replacing
it with the breakthroughs of Paul Pukite!
Heck, I don’t know whether they even know that you exist – not a Pukite in sight – not in the text, not in their close to 70 references. Michael H. Glantz and Ivan J. Ramírez – shame on you!
Piotr complains that I used a hyperbolic term in describing the humanitarian benefits possible if better capabilities were in place for predicting the next El Nino. Yet, he doesn’t need me for creating hyperbole. Consider this 2023 paper “The 1780s: Global Climate Anomalies, Floods, Droughts, and Famines”
https://sussex.figshare.com/articles/chapter/The_1780s_global_climate_anomalies_floods_droughts_and_famines/23306246/1/files/41091620.pdf
The hyperbolic part was how the India subcontinent famine is described:
Can this happen again with an El Nino? Considering just population growth in India, the 600,000 number would be over 4 million deaths updated to show the scale of the El Nino impact. I don’t know how many lives could be saved with an ENSO analysis that could predict an El Nino event several years in advance, but it likely is a countless number. Keep on parsing Piotr, I don’t care.
Paul Pukite – Piotr complains that I used a hyperbolic term in describing the humanitarian benefits possible if capabilities were in place for predicting the next El Nino.
“Complains”? I have questioned your self-promotion – your claims that diverting the research interest and funding from AGW to ENSO – “can save COUNTLESS lives”, You, after failing to provide the plausible mechanism for saving COUNTLESS lives – you tried get out on …semantics: that by “saving COUNTLESS lives” you didn’t mean “very many” but an …unknowable number of lives. I have questioned the honesty of this claim – Occam’s razor suggests that advocating for a research by promising saving VERY LARGE number of lives is much more likely than promising the action which
success can not be demonstrated since it the effect is … unknowable.
In response you …. stopped answering, periodically breaking the silence when you found something you thought would allow you to snatch the victory from the jaws of the past defeat:
– a few months ago you quoted an interview with Gavin, but when asked … you were unable to show how it supports your claim of saving COUNTLESS lives. To make things worse – you were calling on the scientific credibility of the VERY SAME person, whose credibility a few month later you claimed was worse than those of …. anti-vaxers pushing Ivermectin as an alternative to COVID vaccines? Trying to eat the cake and still have it?
Now comes your latest attempt to save your face:
P.Pukite: “ Consider this 2023 paper “The 1780s: Global Climate Anomalies, Floods, Droughts, and Famines”: the droughts of 1789-92 were part of an El Niño event with global ramifications [claiming 600,000 lives in the famine in Madras presidency”
Done, I considered it. But before I answer let’s agree on the meaning of words first – could you confirm that you lied when lecturing me that by “saving countless lives” you obviously DIDN’T mean “very many”, but “unknowable number of lives” (i.e. maybe many, maybe few, maybe none at all)?
Because if you can’t admit that you lied there – HOW “600,000 lives lost in Madras presidency” is NOT “very many”, but an “unknowable number”, instead?
https://www.bloomberg.com/news/articles/2025-02-25/el-nino-la-nina-forecast-weather-agencies-grapple-with-prediction-challenges
Making progress in terms of prediction. It’s a vital part of climate science.
Paul Pukite: ” Making progress in terms of prediction. It’s a vital part of climate science. ”
Only for those who believe that maximizing profit margins of the players on the futures markets is “vital part of climate science”.
PP: Bloomberg: “Predicting the onset and intensity of the weather-roiling El Niño and La Niña events is crucial for global markets”
Again, crucial for the PROFITS of the players on the futures markets. I.e. still the NOT a proof for the much more ambitious promise of “ saving COUNTLESS LIVES ” made by the same P. Pukite.
Nor the answer to my post from 22 Feb, to which Mr. Pukite pin his “reply”.
https://bsky.app/profile/timinthecle.bsky.social/post/3lj3o4aicj22u
Piotr won’t like this headline from the Independent :
“This hurricane season might be kinder than the last. But, DOGE cuts at NOAA could still impact the ability to save lives“
I guess the cheerleading for basic climate science research on tropical equatorial dynamics wasn’t hyperbolic enough, and so that’s why it’s being cut?
Now ask me if DOGE cost-cutting is going to effect any of the research I do.
Follow-on breaking news
https://x.com/GarrettHaake/status/1895246997529211199
This is sad to hear
https://x.com/MatthewEovinoWX/status/1895234162115916033
Paul Pukite: Piotr won’t like this headline from the Independent
Why? “Saving lives” by providing a better warning about the path and strength of the given hurricane making the landfall in the next few days – has NOTHING to do with your promise to “save COUNTLESS lives” by a better prediction of … when the new El Nino will begin.
The SAME goes for your earlier quote from Bloomberg – improving profits of the futures traders is not the same as ” saving COUNTLESS lives” that you were supposed to prove.
And the SAME goes for your two other posts – National Weather Service saves lives through their weather advisory about weather hazards happening in the next few days or few hours (tornado warnings). The ability to do so is UNAFFECTED by whether you can determine that the world would enter in the ElNino conditions 6 months from now as opposed to 5.5 months from now. Thus the ideologically-motivated Musk and Trump attacks on NOAA and related organizations like National Weather Service – does NOT vindicate your claim that the better prediction of the timing of the next El Nino “ can save COUNTLESS lives“.
Nor adding up additional, tangential to your thesis, quotes – would replace addressing the criticisms to your EARLIER claims. In a discussion – you can’t replace the quality (of your arguments) with quantity.
It was well over 3 years ago that I made the “could have … saved countless lives” remark. The context was in terms of being able to predict an El Nino or La Nina event in a deterministic setting — as if they were as predictable as tides (a la high tide and low tide) and that if we had made that connection early on.
I mentioned the Skull Famine in this blog post thread already, linked to a lengthy El Nino event. There was also The Great Famine (1876-1878), a global catastrophe that resulted in ~30 to 60 million deaths worldwide, linked to a severe El Nino event as well . Severe drought in India, China, and Brazil lead to widespread starvation. Consider this passage from the Columbia Climate School – https://lamont.columbia.edu/news/what-caused-great-famine:
I never mentioned this earlier because this is stuff that’s in the historical record and anyone can look it up. So the question is : do we want to be able to predict the next La Nina + El Nino combination years in advance? Can we put a price tag of having that capability? Is it in terms of saving lives? Saving money? Saving people from undue hardship? Or is it just in having the knowledge and allowing people access to the information?
According to the latest I heard from the DOGE cost-cutting, they have decided to save parts of NOAA and NWS directly related to warning systems and public safety. So, in the harsh “reality” of the MAGA world, if you want to stay funded it’s best to have a rationale that involves saving lives.
Maybe to Trump and the MAGA crowd all that matters is to avoid the next hurricane or tornado breathing down your neck. Perhaps El Nino events or long-term climate change are too vague a threat and those research programs will get cut. One of the communication specialists at the NOAA ENSO blog announced he was fired https://bsky.app/profile/dawndailey.bsky.social/post/3lj7uxrqdhs22
This was his last ENSO blog post: https://www.climate.gov/news-features/blogs/enso/how-good-have-models-been-predicting-enso-21st-century
BPL 21 Feb.
P: The question is whether the apology is sincere, and not just the tactical retreat in the no-win situation.
BPL: Piotr, forgive me, but while I recognize your point, I think it wouldn’t hurt to be gracious anyway.
One swallow does not make a summer, Particularly that It’s not the first summer: TK admitted of being wrong before. And then immediately went back to being himself. Not a unique pattern here – see the Doomer Previously Known as Dharma, who wrote one thoughtful post on Dec.31 and then return a few days later as if nothing happened. So both the history and analogy are not on the side of the genuine intellectual and ethical breakthrough.
Still, by not giving him a blanket absolution, but conditioning it on his future posts – I think I have left the possibility of real CHANGE open – it’s up to him he accepts it or not.
BPL: “We may disagree on whether politeness matters, but I’ve come to appreciate it in the face of deniers who are very much not polite”
Yes, we differ. I don’t suffer the deniers or doomers gladly – nor do I differentiate them based on their politeness – if anything – superficial politeness is often used to deflect/delay the criticism:
Wikipedia: Sealioning is a type of trolling or harassment that consists of pursuing people with relentless requests for evidence, often tangential or previously addressed, while maintaining a pretense of civility and sincerity
The difference between Tomas and say Dharma – is that he is better able to stay in character.
When the “Dharma” reappears as a new persona he STARTS sounding like Tomas – a polite, complimenting the other people, who painting himself as to be somebody merely looking for answers, But Dharma is not as patient (as disciplined?) – he soon he drops the mask of politeness, intellectual openness, and civility (see Dharma’s “Escobar” turning from defending Tomas against our criticism to being scathing to him, all in the space of two posts).
So as opposed to giving Tomas the unlimited benefit of the doubt – I put a testable condition
on accepting his apology as sincere – whether he learns from his mistakes and changes his behaviour or not.
So far – the signs are not good – in the subsequent discussions that he has learned nothing and hasn’t changed at all. Summary of one below.if interested
Piotr
==== In the Feb UV thread:
– P: “the large effect of WV make the climate MUCH MORE VULNERABLE to our changes in the … GHG emissions, not LESS vulnerable”
-TK dismisses it as a … “strong belief”, and “in fact, [a] misleading” one.
– I point that it is not “strong beliefs” in lieu of facts, but a conclusion of a falsifiable argument based on the scientific literature data and challenge him to prove otherwise
– Tomas, UNABLE to do it – tries … to make it into the case of my … wounded pride – explaining to me that he didn’t accuse ME of misleading others, but that … I was mislead (by Schmidt et al 2010 I’ll presume?) into formulating my …”in fact misleading” argument.
I.e. the same arrogant ignorance (his claim of my argument being misleading is based on Kalisz’s inability to read/understand the posts he comments), the same lack of intellectual humility requiring that one has to make sure that it is not us who are missing the point, the same evasion of the responsibility for his words. the same projection of own motives onto the others – (assuming that it is all about ego, not about the truth – that I responded only because I perceived it as an attack on myself, not because I was defending the underlying argument against baseless dismissal) .
In Re to Piotr, 22 Feb 2025 at 12:02 PM,
https://www.realclimate.org/index.php/archives/2025/01/comparison-update-2024/#comment-830508
and 22 Feb 2025 at 12:03 PM,
https://www.realclimate.org/index.php/archives/2025/01/comparison-update-2024/#comment-830509
Dear Piotr,
I wonder why you decided replying to my post of 21 Feb 2025 at 9:14 AM,
https://www.realclimate.org/index.php/archives/2025/02/unforced-variations-feb-2025/#comment-830450
on a different place, although you could reply directy under my post, and why you additionally reply in two further comments mentioned above, which are, moreover, identical to each other.
Could you be so kind and keep the discussion in a single thread?
To enable it, I respond only to the first one of your three reactions, the post of 22 Feb 2025 at 5:34 PM,
https://www.realclimate.org/index.php/archives/2025/02/unforced-variations-feb-2025/comment-page-2/#comment-830519
Thank you for your understanding.
Best regards
Tomáš
Piotr, I do wish you’d stop boring us.
Russell 23 Feb “Piotr, I do wish you’d stop boring us”
So … you are reading my posts??? Who would have thought given your dead silence pretty much EVERY TIME I have challenged your claims. When the going gets tough, the tough change the subject and complain how they are bored? ;-)
Piotr: Russell knows his material and doesn’t waste his time endlessly deconstructing every sentence and every claim, particularly in areas not related to his particular skills. That makes him interesting.
You should find something more useful to do with all the time you spend here. Particularly when you go over and over and over the same material. [I should take my own advice, though I don’t spend much time here but elsewhere.] Proving “somebody is wrong on the internet’ is not a useful activity, particularly when it is repetitive. Being ‘right’ is not enough.
https://xkcd.com/386/
Susan Anderson 26 Feb: “ Russell knows his material“. I beg to differ. A testable example below.
SA: “ He doesn’t waste his time endlessly deconstructing every sentence and every claim” Nor does he “waste his time” on replying to …. simple falsifiable arguments that challenge his facts and/or his logic. Testable examples below.
SA: “That makes him interesting.” A matter of taste – I find him the opposite – a bully, arrogantly lecturing others based on his own ignorance. Petty and intellectually undisciplined. Unable to face criticism. The very antithesis of the Feynman’s first principle: “You must not fool yourself, and you are the easiest person to fool”. See below.
To avoid two monologues based on our subjective opinions – here are some recent examples of R. Seitz posts against which we can test our opinions of him:
1. RSeitz, UV January. in response to …. nobody in particular:
“ How does The Traveller’s Club betting book lay the odds on The New Yorker, The Nation and PBS Newsr surviving the 6th Extinction long enough to threaten a 7th should the globe shun their choices , culinary and political , in the 2028 election? ”
To me – a tangent unrelated to climate, petty snide barbs against … his ideological opponents. To you? “That makes him interesting“?
2. Russells “scientific” contribution in response to Gavin (the entire context for those interested in: Nature 2023: Part II :
R. Seitz: “ Goessling et al. research recalls the hazards scientific and moral of focusing on atmospheric forcing to the exclusion of albedo.”
Sloppily formulated for somebody with a scientific background – it took two posts from BPL and Russell tangent on “ the physics of s radiative forcing in geopysical solids and liquids [differing] from radiative forcing in gases ” – just to find out that he … does not consider clouds …. “atmospheric forcing”;
More importantly – the above Russel’s attack on Gavin and mainstream science is based on his own faulty logic, ignorance, and arrogance:
Here is why: for the mitigation of AGW only the forcings need to be considered, and from among them only these forcings that we COULD change enough to achieve significant reduction in AGW without massive economic and environmental damage.
Albedo is NOT one of these:
i) you can’t increase the ice and snow albedo in any other way than by reducing GHGs
ii) the only way to increase the land albedo in any significant globally way would be to …deforest the remaining forests (since croplands, pasturelands, and deserts have higher albedo than forests). And whatever the resulting cooling – would be reduced if not offset, by the resulting increase in emissions of GHGs and decrease in cloudiness.
iii) as for albedo of clouds – it is NOT forcing but a feedback with GMST – reduce GHGs -> reduce GMST -> increase, thanks to Clausius Clapeyron, cloudiness.
The ONLY, and a regional at that, possibility to increase cloudiness without reducing T- is via increase in cloud condensation nuclei (CCNs) over the otherwise oversaturated oceanic air masses – and the only practical way to do it is to … make the ships burn MORE dirty fuel – increasing SO2 conc. in the ships exhaust. The resulting cooling would be limited in size, and with pollutants washing away with the very droplets they helped to condense – the pollution would have to be resupplied at massive levels … forever.
And all that at the price of … increasing the acidification of the ocean, increasing the toxic air pollution from burning dirtier fuels, and multiplying the respiratory deaths from the massively increased air pollution in the densely populated coastal areas.
And that’s the reason, my dear Russel – why to mitigate AGW, we have “several international conventions” on reducing GHGs, and none on increasing albedo. The only relevant convention – is the recent one about REDUCING, not increasing, SO2 emissions from the ships fuel.
Therefore, contrary to Russell Seitz’s claim – a sign of moral and scientific failure is not Gavin’s and IPCC focusing on the GHG reductions, but in you and other “anything but GHGs” proponents who advocate shifting our focus and resources AWAY from the most effective strategy – and toward the one completely ineffective and/or coming with the prohibitive environmental and health costs.
So much for “ Russell knows his material” and for him being “interesting“.
Please note that if your comment repeats a point you have already made, or is abusive, or is the nth comment you have posted in a very short amount of time, please reflect on the whether you are using your time online to maximum efficiency. Thanks.
Re Russel Seitz Mar 1
If my falsifiable challenge ^* to the logic of your never retracted, and shown to be baseless, attacks on Gavin and his colleagues – you perceive as … “abusive” to you – then I am the least of your problems. One can tell a man by the way he handles the unpleasant truths^*..
And don’t worry about my time – all it takes is a quick repost of the questions that you evaded in the past. Like this:
===
^* For the mitigation of AGW only the forcings that we can realistically change enough to achieve significant reduction in AGW. Reducing GHGs fits the bill, ALBEDO is not – either is not a forcing (WV, clouds) or we can’t change it massive downsides (increasing clouds by massive increase in air sulfur pollution). Thus contrary to Mr. Seitz’s claim – moral and scientific failure is not in Gavin’s and IPCC focus on the GHG reductions, but in the anything but GHGs deniers like Seitz, JCM or Kalisz advocating SHIFTING the focus and resources AWAY from the most effective strategy (GHG reductions) and toward the completely ineffective and/or having huge env. price (massive increases in albedo or in land evaporation).
====
TK: Could you be so kind and keep the discussion in a single thread?
I have. This thread:
– TK: “my objection that his answer was not meaningful was indeed unfair and I apologize therefore”
– P: “The question is whether the apology is sincere”
– BPL: suggest to give TK the benefit of the doubt
– P: “One swallow does not make a summer, I put a testable condition on accepting his apology as sincere – whether he learns from his mistakes and changes his behaviour or not. His subsequent [posts] suggest that he has learned nothing and he has not changed at all. Summary of one [these posts] below [in the footnote], if interested”.
So seeing the sincerity of your apology questioned with your own subsequent posts – your ENTIRE line of defense is to that they are … from another thread ? ;-)
In Re to Piotr, 24 Feb 2025 at 9:20 PM,
https://www.realclimate.org/index.php/archives/2025/01/comparison-update-2024/#comment-830596
Dear Piotr,
in my post of 18 Feb 2025 at 4:00 AM
https://www.realclimate.org/index.php/archives/2025/01/comparison-update-2024/#comment-830334 ,
I wrote:
“Hallo Piotr,
Thank you very much for your thorough explanation. I admit that I (incorrectly) understood Mark Matson exactly as you described it. You are right that Dr. Schmidt, actually, provided exactly what Mark asked for.
In this respect, my objection that his answer was not meaningful was indeed unfair and I apologize therefor.
I would like to add only that for plain people like me, a simple answer “There is a broad consensus that the rising trend of the Keeling curve is entirely caused by anthropogenic CO2 emissions.” would have been more straightforward and better understandable than the provided link.”
This way, I was going to close the long thread started by a question asked by Mark Matson on 3 Dec 2024 at 11:55 AM
https://www.realclimate.org/index.php/archives/2024/11/twenty-years-of-blogging-in-hindsight/#comment-827818 .
I have nothing to add thereto. If you want to change the original subject (which was the Keeling curve and various proposals how it perhaps could be splitted to show contributions from various CO2 sources to the overall rising trend) to a discussion about my character, feel free to do so without my participation.
I added the reference to my post of 21 Feb 2025 at 9:14 AM,
https://www.realclimate.org/index.php/archives/2025/02/unforced-variations-feb-2025/#comment-830450 ,
because I (perhaps erroneously) assumed that by citing therefrom, you try to discuss with me.
So my intention was merely to navigate you to my reply of 22 Feb 2025 at 5:34 PM,
https://www.realclimate.org/index.php/archives/2025/02/unforced-variations-feb-2025/comment-page-2/#comment-830519
that I, for the sake of clarity, posted directly under your objections that you raised in another separate post of 22 Feb 2025 at 5:34 PM,
https://www.realclimate.org/index.php/archives/2025/02/unforced-variations-feb-2025/comment-page-2/#comment-830519 .
Greetings
Tomáš
Re: Tomas Kalisz 26 Feb: i didn’t ask you for repeating, blow by blow, the history of this discussion.
I have asked you a simple question:
“ So seeing the sincerity of your apology questioned with your own subsequent post – your ENTIRE line of defense is …. that this post was … from another thread ? ;-) ”
Still no answer.
in Re to Piotr, 27 Feb 2025 at 11:10 PM,
https://www.realclimate.org/index.php/archives/2025/01/comparison-update-2024/#comment-830745
Dear Piotr,
I did my best and have clarified everything I could.
I do not have anything to add.
Best regards
Tomáš