The CMIP6 multi-model ensemble is a unique resource with input from scientists and modeling groups from around the world. [CMIP stands for the Coupled Model Intercomparison Project, and it is now in its 6th Phase]. But as we’ve discussed before (#NotAllModels) there are some specific issues that require users to be cautious in making predictions. Fortunately, there are useful ‘best practices’ that can help avoid the worst pitfalls.
A new paper by McCrystall et al that has just appeared in Nature Communications illustrates these issues clearly by having some excellent analyses of the changes in Arctic precipitation regimes at different global warming levels, and examining the sensitivity of their metrics to both local and Arctic warming, but unfortunately relying on the CMIP6 multi-model mean for their headline statements and press release.
The problem with the CMIP6 ensemble
Any use of CMIP future projections (either in CMIP6 or previously) requires some idea of what the scenarios represent (plausible storylines) of course, but in CMIP6 there is the (somewhat awkward) spread in climate sensitivities that is both greater than in previous CMIP iterations and also extends beyond the values constrained by multiple observations.
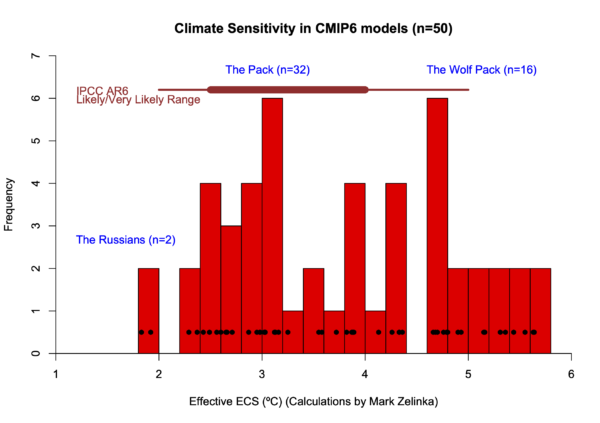
There are notably eight models that have climate sensitivities greater than 5ºC (and more than a dozen greater than 4.5ºC) (and for fairness, two models with ECS under 2ºC). This is sufficient to skew the multi-model mean of the global mean surface temperature higher than the assessed projections seen in the latest IPCC report (Chapter 4).
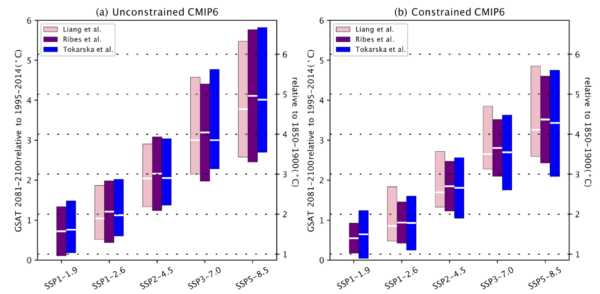
This was not the case for CMIP5. There, the spread of the models was similar to the constrained limits, and the multi-model mean was very close to the assessed projections, and so it was used widely (even by us) as a best guess. The bottom line is that for CMIP6 the multi-model mean is not the same as the expected prediction.
What difference does CMIP6 make for Arctic precipitation?
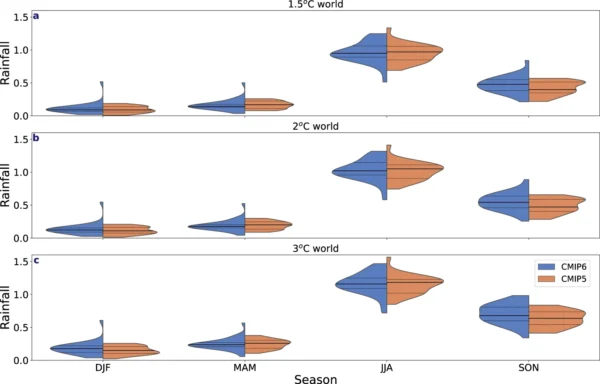
McCrystall et al do a lot of work in their paper that is great and appropriate. They look at the impacts at specific Global Warming Levels (GWLs):
and in more detail at the sensitivity of the precipitation change per degree over the year:
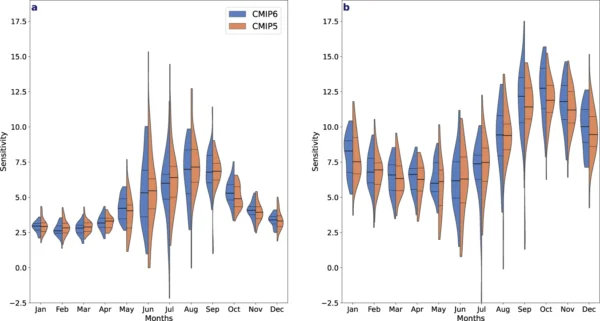
Both of these analyses incorporate all the models but don’t explicitly depend on the overall climate sensitivity. While there are some differences between the CMIP5 and CMIP6 models (particularly at the tails), the means are pretty close. That is, once you abstract out the global or Arctic level of warming, there isn’t that much difference between the projections from the CMIP5 or CMIP6 models (one could test that more formally of course).
There is a slightly clearer difference in their fig. 5 in the SON period where the sensitivity of precipitation to the open water amount seems stronger in CMIP6 than in CMIP5, but mostly everywhere else the sensitivities seem comparable (even though the magnitude of change in some of the CMIP6 models is much larger). So far so good.
However, the main conclusion that the authors highlight in the press release and which was picked up in the newspaper coverage was the claim that rain would dominate Arctic precipitation ‘decades earlier’ than previously thought. This is based on the last row of figure 8:
This shows the results from the raw ensemble means, and uses the absolute times in the output. Given the excessive warming in some models, which will have an earlier transition than the other CMIP6 or CMIP5 models, this result is mostly due to the inclusion of the high ECS models, not anything fundamental about the processes involved. There is some evidence of differences in this metric in the GWL diagnostics, but the signal is much smaller than in fig 8. Ideally, one might like to compare this result to the constrained subset of the CMIP6 models that were used in the IPCC AR6 Fig. 4.11 or those that match the constrained ECS values, to disentangle the impact of (presumably) better process modeling in CMIP6 from the impact of a wider spread in ECS. However, that is not (yet) possible (since what was done is not yet clear). So, unfortunately, we have a widely telegraphed conclusion that purports to be because of some advances in the science, but mostly relies on the excessive and unrealistic ECS in some of the models used.
Lessons to be learned
As I stated when the IPCC report came out, the CMIP6 ensemble has killed the notion of model democracy (‘one model, one vote’). It wasn’t really strictly correct in CMIP5 or previously, but it was close enough to serve as a useful heuristic. This is no longer the case in CMIP6. The default behavior in the community has to move away from considering the raw model ensemble mean as meaningful. The analyses that make sense are the impacts related to GWL, the sensitivity of any impact to the global mean, and various flavours of weighted or subsetted means that would allow the impacts to be coherent with the assessed projections of global mean temperature from AR6.
Providing these recipes to the broader community should be a high priority for the CMIP community or for any projects that are using the CMIP6 data as input.
References
- M.R. McCrystall, J. Stroeve, M. Serreze, B.C. Forbes, and J.A. Screen, "New climate models reveal faster and larger increases in Arctic precipitation than previously projected", Nature Communications, vol. 12, 2021. http://dx.doi.org/10.1038/s41467-021-27031-y
Interesting, and clarifying. I’d seen the headline conclusion and found it a bit startling.
Coming from a condensed matter and statistical mechanics background, I’ve never understood the reliance on ensembles in climate science. As far as I can tell, there are two modes in climate variability — (1) a secular trend due to processes such as AGW + long-term orbital changes, and (2) erratic cycles due to natural processes of arguable forcing mechanisms. From the temperature anomaly time-series I have seen published, it’s the latter that seem to be causing the issue, as the ensembles seem to be applied to wash out the cycling and leave behind only the trend. Yet, if the natural cycling is mainly processes such as ENSO, these are likely not the result of ensemble averages (a la statistical mechanics) at work, since the evidence points to collective fluid dynamics — not independent particles of a statistical ensemble. The basis for this is that ENSO is clearly a standing mode behavior that is fixed over time, as the standing wave mode never changes and is phase-locked to a seasonal modulation (see The Phase‐locking of Tropical North Atlantic and the Contribution of ENSO for a recent discussion).
I would recommend concentrating on modeling all the climate indices that exhibit standing-wave dipole or tripole behavior, such as ENSO, IOD, El Nino Modoki, AMO, etc thereby eliminating ensemble averaging.
Paul Pukite: I would recommend concentrating on modeling all the climate indices that exhibit standing-wave dipole or tripole behavior, such as ENSO, IOD, El Nino Modoki, AMO
Since the predominant reason for the climate modelling, is forecasting climate CHANGE under various emission scenarioes – i.e. forecasting the multidecadal TRENDS – why would we need to “concentrate on modelling” of the … short-term cyclical NOISE around the trend?
Piotr said:
You have different priorities than I have. I think of climate science as being the study of the underlying physics behind climate, as a branch of geophysics. No one has yet to demonstrate that natural cycles among those climate indices I listed are just random “noise”. And there’s much ongoing research that continues to investigate the root forcing of these erratic cycles. As they say, one man’s noise is another man’s signal.
In other words, would climate science still do CMIP-style modeling if AGW wasn’t an existential issue? I would say yes!
Paul Pukite: “ You have different priorities than I have. I think of climate science as being the study of the underlying physics behind climate, as a branch of geophysics. ”
Then one of us is in a wrong place. I’d venture that it is you:
see, for instance, the Start here page of this forum:
“We’re often asked to provide a one stop link for resources that people can use to get up to speed on the issue of climate change”
See: “change”, NOT: “the natural oscillations around the mean”.
PP: “As they say, one man’s noise is another man’s signal.”
And that’s why suggested that you research interests and recommendations would be better
suited to a forum that is NOT interested in the scale and rate of anthropogenic climate CHANGE, but only in short-term (years to decades) natural oscillations around the mean.
Very different questions and very different target audiences – here: informing the society and the politicians about the largest civilizational threat to date (other than perhaps all-out nuclear war),; yours – science for the science sake.
Most articles on this website are good quality and accessible for the average person. This article above is a little bit impenetrable I think for most readers.
I would agree with you Nigel, well above my head. The final paragraph, “Lessons to be learnt”, I though might provide a summary which made some sense but it was still impenetrable. A succinct summary that said something like “These rain forecasts in the Arctic, widely published the media, which seem to show rain rather than snow dominating in Arctic regions much earlier than previously forecast depend on accepting climate forecasting models which are outliers. They are not impossible, but the bulk of science using more widely accepted models would suggest they are unlikely in the time frame examined.” But I suppose we have occasionally just to accept that being an “informed” observer sometimes isn’t quite enough and that real science is indeed complicated. .
“A new paper by McCrystall et al that has just appeared in Nature Communications illustrates these issues clearly by having some excellent analyses of the changes in Arctic precipitation regimes at different global warming levels, and examining the sensitivity of their metrics to both local and Arctic warming, but unfortunately relying on the CMIP6 multi-model mean for their headline statements and press release.”
Has Gavin Schmidt factored in all of the possible variables into what would produce the outcomes that these various climate models arrive at? “On the other hand, the models that include volcanic forcing are more realistic in terms of decadal variability, but they tend to slightly underestimate the long-term warming,” she says”.
“One thing we found was that climate models that do not include volcanic forcing tend to overestimate the long-term change, and their simulated decadal variability is not in agreement with the observations. On the other hand, the models that include volcanic forcing are more realistic in terms of decadal variability, but they tend to slightly underestimate the long-term warming,” she says. “This kind of result tells us volcanic forcing is important, but that we don’t totally understand it yet.”
https://www.earthobservatory.nasa.gov/features/OceanCooling?fbclid=IwAR0kvEOJMO71qgYxz7bfAcnzDoYCW1SA2lewoMxLIH3LTsAHaHDarNOPCTs
JDSwallow: “Has Gavin Schmidt factored in all of the possible variables into what would produce the outcomes that these various climate models arrive at?”
What for? For Gavin’s argument that one should NOT use ensemble mean – because different models are not made equal – he does NOT need to “factor in all the possible variables in all these models,/i>” – all he needed was that the results of some models “extended beyond the values constrained by multiple observations“. Hence his bottom line: “for CMIP6 the multi-model mean is not the same as the expected prediction”
As for volcanic activity you bring up – it may be important to the short decadal noise, but not to the climate TREND, and definitely it does NOT support the denialist claim “it’s not us, it’s the volcanoes” – in case if this were the real reason why you brought up the volcanoes into the discussion of the CMIP6 the multi-model mean.
Piotr says this nonsense; “…it does NOT support the denialist claim “it’s not us, it’s the volcanoes” – in case if this were the real reason why you brought up the volcanoes into the discussion of the CMIP6 the multi-model mean”
Because Piotr is sealed in a bubble, it is for certain these events have evaded his being able to know about them even happening. I have seen Pinatubo volcano while I doubt that Piotr has any idea where it is located at.
Sudden phreatic eruption at Pinatubo volcano, Philippines
November 30, 2021 at 12:53 UTC (5 days ago) A sudden phreatic eruption took place at Pinatubo volcano, Philippines between 04:09 and 04:13 UTC (12:09 – 12:13 PHT) on November 30, 2021. The Tokyo VAAC reported a possible eruption at the volcano with ash observed rising up to 13.4 km (44 000 feet) above sea level at 05:30 UTC.
https://watchers.news/2021/11/30/sudden-phreatic-eruption-pinatubo-volcano-philippines-november-30-2021/
Major explosive event at Sangay volcano, ash to possibly 15.2 km (50 000 feet) a.s.l., Ecuador
Posted by Teo Blašković on December 2, 2021 at 11:19 UTC (3 days ago)
A major explosive event was registered at Sangay volcano, Ecuador at 09:03 on December 2, 2021. The Washington VAAC is reporting volcanic ash rising up to possibly 15.2 km (50 000 feet) above sea level.
Consequently, there is a possibility of ashfall in the areas located to the west and southwest of the volcano, in the province of Chimborazo, IGEPN reports.1
It is recommended to take the pertinent measures and receive the information from official sources.
Satellite imagery acquired at 04:40 UTC show 2 ash clouds, the first reaches 10 km (32 800 feet) over the crater and the second 7 km (23 000 feet) over the crater, IGEPN said.2
https://watchers.news/2021/12/02/sangay-volcano-eruption-ecuador-december-2-2021/
Swallow, Swallow, Little Swallow, Dec. 6: “ I have seen Pinatubo volcano
Write us when you understand what you saw. For now – you have NO IDEA that you have … shot yourself with a Pinatubo in the foot.:
the effect of the volcanoes is to (temporarily) COOL the Earth, WHICH MEANS that the HUMAN forcing of the climate is in fact STRONGER than the _observed data_ suggest.
I.e. a conclusion OPPOSITE to the “it’s not us, it’s the volcanoes” bullshit that you so happily swallowed, and now regurgitate here.
It’s impossible to program a climate model to predict a large volcanic eruption like Pinatubo before it happens. But when one is arbitrarily included in a model run it tends to cool the planet, just as Pinatubo actually did in reality in 1991, but the cooling is short lived.
Now JD Swill is infecting a new thread. What’s happened to the moderation around here?
Why would Jim Eager be so afraid of what my views on basically anything, are?
“Where all think alike, no one thinks very much.” Walter Lippman
JDS. Nobody is afraid of your views. Were sick and tired of your constant stupidity. Some things are of so little value they should be bore holed.
JDS, the problem is that we have to wade through your idiocy to find comments from sensible people. It degrades the signal-to-noise ratio on this site.
Your views are so obviously stupid that most people could not be bothered rebutting them, so you you may not even realise how lame your posts actually are.
I think you are even dumber than Victor the Troll, which is not something I expected to see so soon after he left on his latest cherry-picking holiday. At least his factoids were isolated bits of science taken out of context. You simply post about isolated features of the world, thinking that if you collect enough of them in one place safely separated from all counterexamples it amounts to an argument.
Look! Rain! Look! Big sun! Look! CO2 has a low concentration! Look! This temperature is lower than that one, so it’s sorta negative!
JDS, The reason why people don’t want to read your utterly stupid remarks is not because they represent alternative thought, or even because they are wrong. It is because they are boring, repetitive and contribute nothing to the discussion. What is more, they show no sign of improvement over time. Your learning curve does not have a positive slope.
And then there are those who just don’t or can’t think very much period, and insist on repeatedly demonstrating it for all to see.
I shared this paper recently
Reality Check says 30 Nov 2021 at 9:46 PM
(saying) Gavin said there would be many new papers coming out based on CMIP6. I have seen many already, here is another one. Here’s hoping their mathematical toys are accurate and useful.
https://www.realclimate.org/index.php/archives/2021/11/unforced-variations-nov-2021/#comment-798427
I do not understand how this info helps anyone. Clarifies anything. Makes anything clearer or more understandable. Are science journos reporting on this? Is anyone correcting the record? Is the results of the paper really unsupportable? Gavin suggests elsewhere it should not have got through peer review (or words to that effect) Is this the best on offer? What is the take away message supposed to be. I do not know.
Meanwhile, this discussion issue takes place only weeks after the summit of Greenland receives rainfall for the very first time in recorded modern history.
the precip paper says: Greenland melt has already been shown to be at least twice the rate in CMIP6 than CMIP558 under the same radiative forcing.
https://www.nature.com/articles/s41467-021-27031-y#Sec8
one ref dec 2020 says: Our results highlight that the GrIS could potentially lose ice faster in a warming climate than the previous CMIP5-based estimates suggested.
https://www.nature.com/articles/s41467-020-20011-8
Is this greenland ice sheet loss paper based on CMIP6 also “wrong”? Who knows if it is or isn’t and where do we find them?
And of course all of this is completely theoretical (right?) and does not represent the real world in which we live and where the arctic ice and precip takes place. It’s probably only a storm in a tea cup and makes no difference to anything. And the paper will stand and shared for years and cited as well.
What’s changed? What is anyone supposed to do with this info now? Why is there a wolf pack of “outliers” (?) with unrealistic ECS in the first place. Let alone people producing new models and science papers based on them which then some claim are unreliable and wrong.
Climate science really is it’s own worse enemy.
meanwhile from 2014 Cited by 476 …. In a warming climate, precipitation is less likely to occur as snowfall
https://www.nature.com/articles/nclimate2246
The new precip paper doesn’t sound like new news to me then. It’s merely counting a different set of angels dancing on the head of a pin. Yes? It’s a different guesstimate of the shift from snow to rain precip out to 2100, 80 years form now.
What difference does this shift, or the change to CMIP6 really make to anyone or anything?
It certainly does not change what the future will be. Nor will it change what human actions in the future will be. While arguments between climate scientists continue on as always.
I guess we could wait until 2026/27 for the AR& to come out, maybe they might find a moment of consensus and agreement of what is. But I seriously doubt that. The AR6 and the CMIP6 hasn’t helped at all. It’s worse than it has ever been imv.
Sorry, I forgot this part:
“This regime shift implies that more stringent mitigation policies are required as precipitation changes which were expected with 2 °C of global warming above pre-industrial, now appear possible under 1.5 °C of global warming”
https://www.nature.com/articles/s41467-021-27031-y#Sec8
I am wondering what, if anything, are govt policy makers, COP meetings and the like supposed to do now?
Should they ignore this paper and call anyone who mentions it an outlier/extremist and a overly emotional unbalanced doomer?
I only ask because this is what happens already. Often. Daily. Who should I believe and who should I trust present the genuine climate science output these days? afaik everyone is following “the science”, they all say it. It’s like a mantra.
Ladies and Gentlemen including Gavin Schmidt
I have a cellar pump and can judge this.
That cellar pump has gone on and off more and more as long as we lived here, simply along with the Keeling Curve in Haway. My f… wife from Germania calls it “Hochwasser”. There are further words and conscepts in the north sea european monsune climatic area such as Dat Water and Waterstaat and Waterland, but it normally just rushes down, pours down or snows down.
Zero celsius is unknown, strange, and class racial enemy to many of you here. But it is rather what we are looking after all the time especially at this time of the year..
Further the dew point, white or grey clouds in the climate, frost or dew on the car windows and roofs or not, , in the climate.
Knowing this, you will not have to ask or to believe in the experts.
It is mostly what rules and decides over the landscapes.
Are you real, Carbomontanus? Surely the moderator doesn’t have to accept posts like yours and post them here? Life’s too short.