The biggest contribution scientists can make to #scicomm related to the newly released IPCC Sixth Assessment report, is to stop talking about the multi-model mean.
We’ve discussed the issues in the CMIP6 multi-model ensemble many times over the last couple of years – for instance here and here. There are two slightly contradictory features of this ensemble that feature in the new IPCC report – first is the increase in skill seen in CMIP6 compared to CMIP5 models. Biases in the Southern Ocean are less, similarly with sea ice extent or rainfall etc. but also the models as a whole are doing better in representing key modes of variability and their teleconnections. This is good news. The second issue is that the spread of the models’ climate sensitivity is much wider than in CMIP5, and specifically, much wider than the new IPCC assessed range. This is not so good – at least at first glance.
The climate sensitivity constraints are discussed in the SPM:
A.4.4 The equilibrium climate sensitivity is an important quantity used to estimate how the climate responds to radiative forcing. Based on multiple lines of evidence, the very likely range of equilibrium climate sensitivity is between 2°C (high confidence) and 5°C (medium confidence). The AR6 assessed best estimate is 3°C with a likely range of 2.5°C to 4°C (high confidence), compared to 1.5°C to 4.5°C in AR5, which did not provide a best estimate.
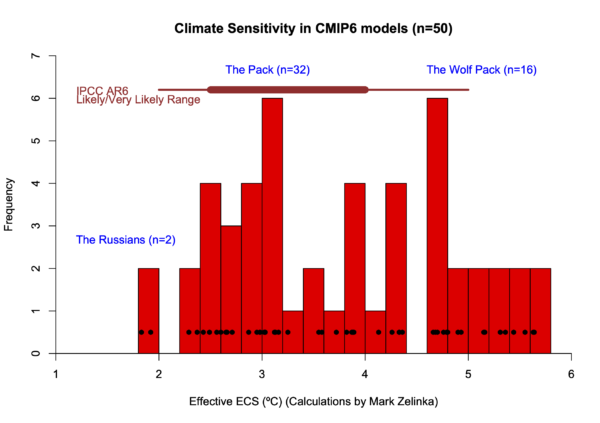
I’ve plotted the CMIP6 climate sensitivities before, but here I have updated it to the latest compilation (from Mark Zelinka) and added the likely and very likely assessed ranges from AR6.

For reference, out of 50 models, 40 are within the very likely AR6 range, and 23 within the likely range. Nonetheless of the 8 models with ECS > 5ºC, most are from very highly respected groups whose models do very well against comparisons of the climatology, including the Hadley Center (3 models), NCAR (2 models), DoE and the Canadian Climate Center (1 model each). My personal assessment of the likely range would be more closely based on Sherwood et al (2020) and so is a little narrower (as discussed here) – but it will need a deeper dive into the main report to see why the ranges differ and that isn’t the main point here. I would note though that given the distribution of ECS seen here, it is marginal whether this is even consistent with sampling from a straightforward distribution.
What does this mean in practice? It’s well known and accepted that CMIP is an ensemble of opportunity and not a structured exploration of model parameter space, that models are not independent of each other (some common assumptions, common modules and very close variants from some model groups) and so it makes no sense to treat the ensemble as if it was a pdf with a nice properties. And yet in CMIP5 (and previously), this was done almost ubiquitously (even by me on the model-data comparison page). Despite the many excellent reasons why ‘model democracy’ shouldn’t be the best thing to do, it often was.
With CMIP5, the coincidence of the model range of sensitivity (2.1°C to 4.6°C) with a reasonable assessed range of 2 to 4.5°C meant that, even if it wasn’t strictly kosher, practically it didn’t make much difference. And even in the AR5 report, the only constrained projection (for sea ice area) turned out to be overfitted and did not properly account for internal variability.
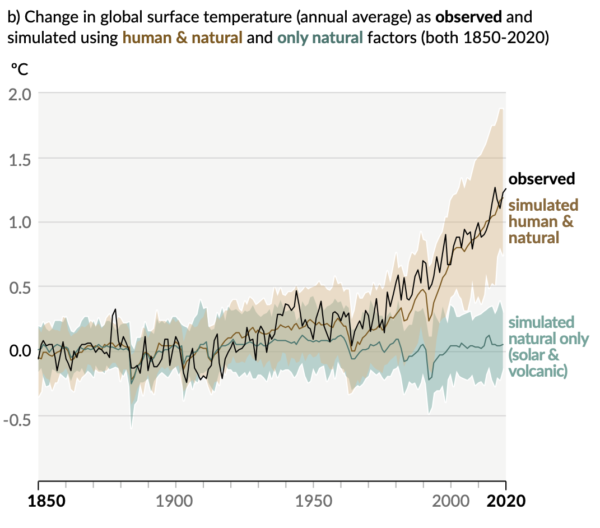
But now with CMIP6, the situation is different. There are now large differences between the constrained projections and ‘model democracy’. For the historical period, the differences are there, but the the unweighted model mean does ok when compared to the observations:

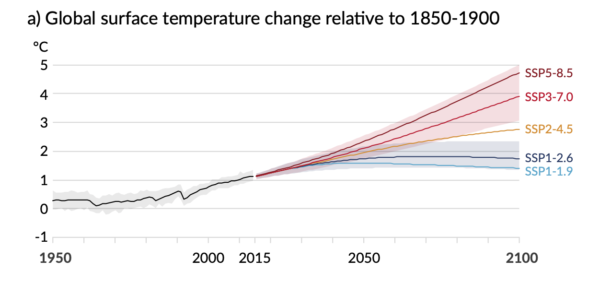
However, they are only plotting the 5-95% envelope and at least one of the high ECS models (NCAR CESM2) used the historical trends as a tuning target. Despite that, it’s clear that the model spread is excessive in the post 1990 period. Were the raw CMIP6 data to be extended into the future – particularly for the higher emissions scenarios, the differences would be even starker. Thus for temperature projections, the IPCC authors (sensibly) effectively screen the models for coherence with observed temperatures (following Tokarska et al. (2020) and downweight models with ECS values outside the assessed range:

The high (and low) ECS models to make a contribution in the maps associated with the impacts at specific Global Warming Levels (GWLs) of 1.5ºC, 2ºC and 4ºC (in figure SPM 5) so the useful information they contain is not lost.
How then should we talk about these models? In my opinion, describing the properties of the multi-model mean or generalizing about the models as a whole is not sensible. Claims such as those made recently that the CMIP6 ensemble ‘runs hot’ are very easily misconstrued to imply that all CMIP6 models have too high ECS values (or indeed all models in general), when really it is only a subset. Discussions of the mean CMIP6 sensitivity is, to my mind, pointless, not least because the ‘CMIP6 mean’ is based on a somewhat arbitrary selection of models that doesn’t take into account model independence nor the fact that CMIP6 itself is a moving target as more models are still being added to the database. And given that all the temperature projections in IPCC are constrained projections, the raw CMIP6 mean and its properties are simply irrelevant for any of the AR6 conclusions.
It is true that *some* models have high ECS beyond what can be reconciled with our understanding of paleoclimate change, and in those models the cloud feedback particularly in the Southern Oceans is more positive than previously. But it is not the case that all the CMIP6 models ‘run hot’, nor is true that the model projections in AR6 are affected by these high ECS values. We should therefore avoid giving that impression.
Many people have previously declared that ‘model democracy’ was flawed, but this is the report that has finally buried it.
References
- S.C. Sherwood, M.J. Webb, J.D. Annan, K.C. Armour, P.M. Forster, J.C. Hargreaves, G. Hegerl, S.A. Klein, K.D. Marvel, E.J. Rohling, M. Watanabe, T. Andrews, P. Braconnot, C.S. Bretherton, G.L. Foster, Z. Hausfather, A.S. von der Heydt, R. Knutti, T. Mauritsen, J.R. Norris, C. Proistosescu, M. Rugenstein, G.A. Schmidt, K.B. Tokarska, and M.D. Zelinka, "An Assessment of Earth's Climate Sensitivity Using Multiple Lines of Evidence", Reviews of Geophysics, vol. 58, 2020. http://dx.doi.org/10.1029/2019RG000678
- K.B. Tokarska, M.B. Stolpe, S. Sippel, E.M. Fischer, C.J. Smith, F. Lehner, and R. Knutti, "Past warming trend constrains future warming in CMIP6 models", Science Advances, vol. 6, 2020. http://dx.doi.org/10.1126/sciadv.aaz9549
Thanks, that’s helpful.
SPM A4.4 says:
“ Based on multiple lines of evidence, the range of equilibrium climate sensitivity is between 2°C (high confidence) and 5°C (medium confidence). The AR6 assessed best estimate is 3°C with a range of 2.5°C to 4°C (high confidence),”
What…? So, for one thing, do we have high confidence of 2 (very likely) or 2.5 (likely)? Totally confusing
Both. We have a high confidence that the minimum ECS is at least 2C, and medium confidence that it’s no more than 5C. We also have a BEST estimate that the real ECS is around 3C, and high confidence that it would come out between 2.5C and 4C based on our current knowledge.
If it still sounds confusing, imagine you’re trying to sell your house in a crazy market, and you ask your real estate agent how much it will bring. Your agent replies “this market is wild, and hard to predict. I have high confidence that you can sell your house for at least $200k, and medium confidence that it will be less than $500k. I’d be more confident, but I’ve seen some crazy bidding wars lately. I recommend that you list the house at $300k, based on my best estimate of what it might bring in this market, but I can live with anything from $250k to 400k.”
I think the models are pretty useful. But the public focus ought to be on implementing the longstanding recommendation that we cut ghg emissions quickly and dramatically. Our species may or may not be capable of making this move. It’s a little painful to watch.
The time when I had any impulse to argue about the models is gone. We are out of time to cut our emissions and change our path.
Cheers
Mike
Gavin, I hope you’re getting some well-deserved rest after the meeting… but after you’re recovered I’d be grateful if you (or someone else reading this) could dumb down some of this for, well, for people like me.
The short version is that I’m seeing a lot about what not to do—e.g., “stop talking about the multi-model mean”—but not a lot about what to do instead.
The long version: After reading your post and following the links I think I understand what “model democracy” is: simple averaging with one model, one vote. And maybe I understand why it’s troublesome: because some models do better than others at replicating recent temperatures and/or paleoclimate temperatures (due to their ECS values?), and so ideally you’d want to give the better-replicating models more weight. But I don’t really understand what has replaced model democracy: constrained results, or weighted results, or ?? What is it and how _do_ you talk about it?
In talking publicly over the last year as the model results came in, I’ve taken a line that it would be hard for the IPCC to own up to openly: the science is uncertain. But NOT “uncertain” in a way that means we can ignore it. For forty years the modelers have been wrestling with the mind-boggling complexity of the climate system with no prospect in sight that they will get more precise results. But they have been able to give us a range of what is very likely. The range is verified by a different approach, paleoclimatology, which gets the same numbers. Okay, not exactly the same, but for practical purposes not all that different. Put the two approaches together and you can get numbers a bit better than either one. There is no simple mathematical algorithm for putting together numbers from entirely separate fields of science. So although the IPCC can’t say it out loud, we’re relying on the intuition of experts. No doubt in AR7 the numbers will be slightly different.
But the exact numbers don’t matter! We know so little about human society that it’s anyone’s guess how civilization will respond to the conditions projected at 2, 3, or 4 degrees. All you need to say is this: without changes in the current laws, regulations, investments, etc., we will probably get a three-degree world before the end of the century, which would make it difficult to sustain a stable, humane, and prosperous civilization. But the science is uncertain, there is a significant chance (like, 10% probability) of a four-or-five-degree world, which would make it difficult to sustain any civilization at all. You can’t say more than that with any confidence, but that’s all people need to know, the precise numbers and how they’re derived is of little moment.
Excellent. Finally a posterior distribution rather than a point estimate with variance!
AR6 Fig SPM1b: The graph that will change the world!
The graph that will change the world!
Very funny. :)
Gavin, can you expand upon the phrase “constrained projection?” While the basic meaning seems pretty self evident, the implications are much less so. For instance, why is AR5 “sea ice area’ a constrained projection whereas other parameters are not? And just what does the constraining, anyway?
I would support this. “constrained projection” is a termius technicus not clear to many of us.
Nothing exists in a vacuum.
Nothing arises from nothingness.
Something leads to something else.
Koan for the Day
The ECS, be it 3.0 or whatever, seems to be some sort of “bottom line” for models, estimates, etc. But we’ll never measure anything close to it with any directness, as that would involve doubling CO2/forcing, and holding it there until the system stabilizes. Are there other shorthand summaries for model bottom lines that are easier to understand, or more measurable, or both?
I’d be grateful for some comments from those more in the know than I. Also grateful for fewer comments from those who know little, but that’s probably a bigger ask.
Ric, you would have to give some kind of criterion for “measurable”, and what constitutes a “bottom line”.
If a model predicts a .2C rise in GMST in ten years, that could certainly be measured. If the result fell within a reasonable range of error, that would increase our confidence in the model.
Would that meet your standard?
In retrospect, it’s a pity that, when Michel Petit and I wrote the Uncertainty Guidance Note for authors of the IPCC Fourth Assessment, we did not put in some references to the science literature that goes beyond simple probability distributions. Much of that was started by Arthur Dempster and Glenn Shafer in the 1960s and 70s but it has led to formalisms for decision making in areas like nuclear waste management where uncertainties cannot be treated with a probability distribution.
I’m not a climate scientist and feel some unease that some of the high-end (in both senses) results have been effectively discarded in arriving at a probability distribution for climate sensitivity and hence remaining carbon budgets, particularly if we don’t know why they’re giving these outlying results. Could ignoring the ‘wolf pack’ (have to admit, I don’t get the reference) mean that climate inaction is taking even greater risks than summarised by the IPCC?
OK, they’re downweighted because they’re not consistent with paleo records, but then why are they trusted for precipitation maps? The variation as I understand it is mostly to do with extratropical cloud feedbacks.
I asked a random question under the ‘Climate Sensitivity: a new assessment’ article, and thought I’d repeat it here under the latest CMIP6 discussion. Is there much difference between the models in terms of spatial heterogeneity of temperatures (eg weather blocking)? Wondering if there is any possibility it might affect Planck feedback (probably not).
Anyway, thanks for the interesting and illuminating explanation. I look forward to seeing how the models develop even further.