Guest commentary from Laure Zanna (U. Oxford) and G. Jake Gebbie (WHOI)
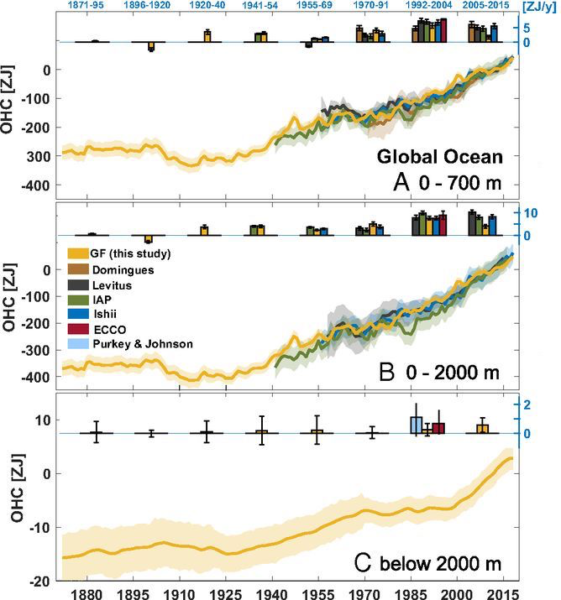
Two recent papers, Zanna et al. (2019) (hereafter ZKGIH19) and Gebbie & Huybers (2019) (hereafter GH19), independently reconstructed ocean heat content (OHC) changes prior to the instrumentally-based records (which start ~1950). The goals (and methodologies) of the two papers were quite different – ZKGIH19 investigated regional patterns of ocean warming and thermal sea level rise, while GH19 analyzed the long-term memory of the deep ocean – but they both touch on the same key questions of climate forcing and response.
The two studies independently show that subsurface temperature change is well described on century-long timescales by surface imprints that are transported by the modern ocean circulation. Both studies highlight the following points: changes in ocean circulation have very little impact on global OHC changes, and that the deep ocean adjusts slowly to surface temperature changes, showing a slow emergence of anthropogenic trends at depth in the recent decade.
The two methodologies are distinct: ZKGIH19 uses a Green’s function approach to derive the imprint on the deep ocean of changes in surface fluxes from the ECCO project (a reanalysis model that uses modern ocean data to reconstruct a state estimate of the ocean circulation). This is then combined with the history of observed SST (HadISST2) to infer the deep ocean changes.

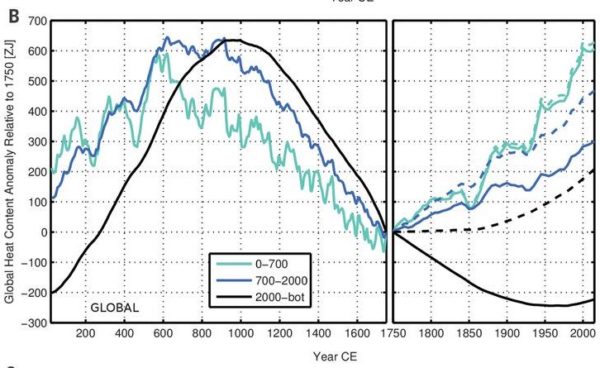
GH19 use a functionally similar inversion technique for ocean tracers (outlined in Gebbie and Huybers (2011)) to create a forward model that produces an estimate of deep ocean changes given the surface forcing. They then constrain this estimate using the difference between the HMS Challenger data (1872–1876) and modern WOCE data to produce an optimised estimate of ocean temperature structure going back to 15 CE. Unfortunately, there isn’t an uncertainty quantification that goes with this.

For 1955–2017, both estimates in the upper and deep ocean are similar to estimates made by infilling the available 3D time-dependent ocean temperature observations (GH19: 0.35 W/m2, ZKGIH19: 0.33 ± 0.07 W/m2 (one sigma)). The warming between 1921-1946 is also consistent between both estimates (ocean heat uptake GH19: 175 ZJ, ZKGIH19: 145±62 ZJ (1 sigma)) and is comparable to the 1990-2015 time interval (GH19 = 135 ZJ, ZKGIH19: 153 ± 44 ZJ). Even when the time interval is pushed back to 1880, the two numerical estimates of ocean heat uptake are self-consistent.
Below 2 kilometers depth and before 1880, the two estimates show larger differences. For the time period, 1871-2015, the GH19 total estimate (570 ZJ) is bigger than ZKGIH19 (436 ± 91 ZJ), but not significantly so. (Note that GH19 ends in 2015, ZKGIH19 in 2017.)
The differences probably have 2 major causes: 1) the lingering influence of surface climate from before 1870, and 2) discrepancies in the estimated surface warming in the late 19th century. Below 2 kilometers depth, the heat uptake has differing signs for the interval, 1871-2015 in the two analyses (GH19: -25 ZJ, ZKGIH19: approx. 14 ZJ ± 6 ZJ), due to a cooling up from 1971 until 1950 in the deep ocean in the reconstruction in GH19 compared to ZKGIH19. Surface warming is stronger in GH19 in the late 19th century due to ingestion of data from the HMS Challenger observations and Ocean2k paleo reconstructions (though errors are included in the reconstructions), while ZKGIH19 only used sea surface temperatures starting from 1871. The differences could also be due to the different transport models, GH19 used WOCE data in parts of the 1990s, while ZKGIH19 used ECCO over 1992-2003 (which nonetheless incorporated WOCE data as part of it’s input).
ZKGIH19 shows that regional changes in ocean circulation have an imprint on patterns of OHC and thermosteric sea level in the Atlantic Ocean over 1955-2016. By comparing with observations, they argue that up to half of the observed ocean warming and thermosteric sea level trends between 20ºS and 50ºN are due to time-dependent ocean horizontal and vertical redistribution. They showed that there are large variations in patterns of warming between the early and late periods. GH19 mostly focus on the deep Pacific and showed large OHC cooling trends over the past century, (but did not show global latitudinal distributions). They argue that the deep Pacific cooling is a signature of long-term adjustments of the ocean after the Little Ice Age. ZKGIH19 shows basin-scale estimates but those include the Southern Ocean and cannot be directly compared to GH19 basin estimates which are north of 45ºN. A more apples-to-apples comparison will take a bit more effort to produce.
Implications
(Additional text from gavin)
Given the average transit time for the deep Pacific (1000’s of years), it is expected that the deep Pacific won’t be in equilibrium with surface climate changes over shorter time scales. GH19 are not the first to quantify this deep dis-equilibrium (previous work had looked at the lingering impact of Tambora in 1815 for instance), but this might be the estimate most consistent with the (sparse) early observations. The caveats are (as usual) there are still imperfections in the ocean models being used and the systematic biases in old observations are always being looked at. The differences between the two studies are thus understandable from their study design.
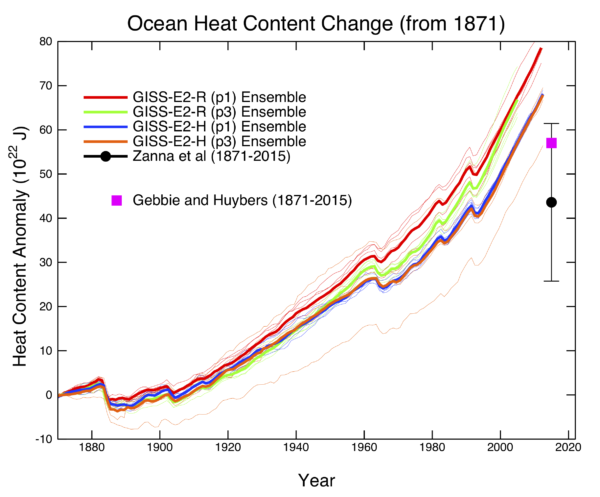
These long-term estimates are however an interesting new metric to compare to the models. Just for fun, I plot (below) the total ocean heat uptake from the historical GISS CMIP5 model ensembles (normalized to 1871). These ensembles have two different ocean models (version R and version H), and two different treatments of atmospheric composition (non-interactive and interactive) and start from quasi-equilibrium in 1850. There are still residual drifts in the deep ocean which have been subtracted out using the control runs. The ocean model definitely makes a difference, and the GISS-E2-R runs had excessive mixing down of heat into the ocean (in the CMIP6 version this is reduced). Both sets of simulations have more cumulative heating than either the ZKGIH19 or GH19 estimates, though whether that is typical of the CMIP5 ensemble, or the new CMIP6 runs, is still to be determined. Note that an excessive uptake of ocean heat would be associated with a lower transient climate response (TCR), but the match in the upper ocean for more recent periods suggests it is likely that there may be issues with early 20th C forcings. It will also be interesting to see whether the longer millennial simulations (starting in 850 CE) might have a different pattern… Watch this space!

References
- L. Zanna, S. Khatiwala, J.M. Gregory, J. Ison, and P. Heimbach, "Global reconstruction of historical ocean heat storage and transport", Proceedings of the National Academy of Sciences, vol. 116, pp. 1126-1131, 2019. http://dx.doi.org/10.1073/pnas.1808838115
- G. Gebbie, and P. Huybers, "The Little Ice Age and 20th-century deep Pacific cooling", Science, vol. 363, pp. 70-74, 2019. http://dx.doi.org/10.1126/science.aar8413
- G. Gebbie, and P. Huybers, "How is the ocean filled?", Geophysical Research Letters, vol. 38, pp. n/a-n/a, 2011. http://dx.doi.org/10.1029/2011GL046769
- G. Stenchikov, T.L. Delworth, V. Ramaswamy, R.J. Stouffer, A. Wittenberg, and F. Zeng, "Volcanic signals in oceans", Journal of Geophysical Research: Atmospheres, vol. 114, 2009. http://dx.doi.org/10.1029/2008JD011673
The GWPF and The Heartland Institute plan a rebuttal challenging the Challenger results:
https://vvattsupwiththat.blogspot.com/2019/01/mystery-of-missing-ocean-heat-content.html
Time out. The common era OHC graph says that the ocean was way warmer 1000 years ago, and it sure looks like a cycle. So, if I were a denier I’d say the that graph destroys the whole alarmist story. We have tons of time before things get hotter in the ocean than 1000 years ago. How did coral survive?
Dissonance is like an itchy spot in the middle of your back. Somebody pass me a backscratcher, please.
OK, we, and most coral care more about the upper ocean and it’s about the same as 1400 years ago. There’s a lot to discover behind that graph. An even longer series would be nice.
I think it is about time RC grew up and sent all those inane posts linking to vvuwt to the borehole
AB, #2–
Seems to me a vital question in assessing this concern is the relation between the graphed heat content anomalies and total heat content, because until we know that, we don’t really know the implied temperature difference, right?
Unfortunately, what everyone is investigating is the change (anomaly), so my searching didn’t reveal a rigorous number for the total. (Or even a squishy untrustworthy one, actually.) I tried a rough DIY calculation but the results were not consistent with the graph numbers, which almost certainly means I screwed up somewhere. (If you must know, they seemed to me to imply that the oceans boiled away completely sometime before the Vikings found Iceland, or more likely that Earth was an iceball during the days of Christ’s ministry in Galilee–both of which scenarios would seem to be contraindicated.)
So, to those more adapt than I, are those ocean heat anomalies large or small in relation to the total heat content of the ocean? It would seem to me that that is what would allow you to assess the associated warming. Or am I falling victim to a serious misframing here?
Second, a great many denialati are, per my observations, prone to be unaware that global temperature had, until relatively recently, been *declining* from its interglacial peak, since they like to argue that observed warming results from the non-mechanism of ‘ice age recovery.’ But that is just wrong–paleoclimate studies too numerous to mention, even if I knew all of them to do so, which I don’t, lead to a ‘best estimate’ that the “Holocene Thermal Maximum” is now several millennia in the past, and that only recently has GMST approached or surpassed that peak value. (One paper I do recall in this regard is Kaufman et al (2009), which showed 2 millennia of declining temps in the Arctic–again, until recently, that is.)
So finding a similar signal OHC estimates shouldn’t surprise.
Thirdly, the plot only ‘looks like a cycle’ due to the disparate time scales of the two portions of the graph. Correct for that, and you have a hockey stick, albeit with a badly warped handle.
All of which said, I share an itch to understand those graph numbers a bit better.
To me GH19 in the pre-1750 part does not look very credible, from 1000 to 1750 it seems to suggest that all layers of the ocean were cooling at a rather steep rate and yet all our sea level estimates contradict that, see also:
https://www.realclimate.org/index.php/archives/2011/06/2000-years-of-sea-level/
I think it’s about time Kenneth VVoolvvard read the masthead of the link he misconstrues:}
Al Bundy & Keven McKinney
Regarding the graph in the article “GH19 estimate of global ocean heat content change over the common era over three depth ranges.”
This graph had me mystified as well and is fodder for denialists. But its broadly consistent with the medieval warm period which we all know about, and the rates of change of OHC over the MWP are slower than currently.
The following study below is ocean heat content in the Pacific Ocean over the last 10,000 years. The graphs show the pattern pretty well if you blow them up in size and are consistent with longer term warming after the ice age until 8,000 years ago and the flattening off and cooling since then until the beginning of last century. The MWP is a spike within this trend, along with a few other spikes and dips.
http://science.sciencemag.org/content/342/6158/617.full
This study is interesting and has a graph that is easier to read. “A temperature record built from the shells of tiny sea creatures suggests the middle depths of the Pacific ocean have warmed 15 times faster in the last 60 years than at any time over the last 10,000 years.”
https://www.carbonbrief.org/10000-year-record-shows-pacific-depths-warming-fast
Would be interested in comments from the real experts!
How do the results from these two papers (and Gavin’s model results) relate to those in the recent Cheng, et. al. paper in Science: (http://science.sciencemag.org/content/363/6423/128.summary)? Are all the results consistent?
[Response: Yes. These runs are in the CMIP5 ensemble Cheng et al used. The rate of change in recent decades is much better constrained than the century scale changes. – gavin]
I am a skeptic so if you block skeptic posts I can save you time, and you can block my post immediately. If you deign to allow dissension then I ask a simple question. Based on the papers analysis can scientists make a prediction and if so what is that prediction?
Joe in NY
[Response: Here. -gavin]
Russell,
I realize that Mr. Woolard’s posts are tedious, but his first name is Keith, not Kenneth.
#8, nigel–
Thanks for the title, nigel. I scanned the article with some interest.
Your link was paywalled, but I was able to find an accessible PDF here:
http://citeseerx.ist.psu.edu/viewdoc/download?doi=10.1.1.732.130&rep=rep1&type=pdf
Regarding concerns in the comments that Medieval OHC are higher than modern-
The paper says this:
“Finally, we note that OPT-0015 indicates that ocean heat content was larger during the Medieval Warm Period than at present, not because surface temperature was greater, but because the deep ocean had a longer time to adjust to surface anomalies. Over multicentennial time scales, changes in upper and deep ocean heat content have similar ranges, underscoring how the deep ocean ultimately plays a leading role in the planetary heat budget”
That’s just hilarious Ray@11 – only you could post a comment that corrects someone else about names and you get that very name wrong in your comment!!!!
Russell, I have no problem with your website – I am all for humour and parody, but when I want humour I will go and get it, I come to RC for science and I don’t want links to sites that belittle.
My comment was for the moderators, if they think Russell’s links are on topic, scientific and not ad hominem then please do an in-line response and I will never raise it again
> Kenneth Woollard
understandable slip if you’re a movie fan.
https://www.imdb.com/name/nm0941220/
Fine, Kenneth Woollard. Your comment is also hilarious, as you wouldn’t recognize science if it bit your willie off.
Keith Woollard:
To be honest, I used to have the same reaction to Russell’s frequent linking to his site. I was put off by his, uhm, ‘creative’ typography, mostly. Then I started actually reading his content. I’ve since come to the opinion that Russell just might be the smartest person commenting here.
Mal Adapted, R Seitz website is clever, reminds me of Monty Python.
Why do you disallow disagreement?
if science is what Keith Woollard wants, he should turn to what I publish in Climatic Change, Nature, and come to think of it, er , RealClimate :
https://www.realclimate.org/index.php/archives/2017/07/red-teamblue-team-day-1/
Joe Peck,
Who is disallowing disagreement? What the managers seek to avoid is stupidity.
The hypothesis of anthropogenic global warming dates back to 1896. Given that we’ve seen an entire planet warm by over 1 degree C since then, that’s pretty strong evidence. However, if you are going to take issue with said hypothesis, here are some other scientific advancements you might want to also challenge:
1) Relativity and quantum mechanics are 5 years to a decade younger than global warming.
2) The existence of the atomic nucleus.
3) All particle physics
4) DNA
5) Antibiotics
And we’ve known that CO2 was a greenhouse gas since the 1850s. So maybe you would also like to challenge
1) Electromagnetism
2) Thermodynamics
3) The atom
4) Evolution
5) Uniformitarianism–the basis of modern geology (technically Lyell’s Principles was published in the 1830s, but it’s contemporaneous).
6) Statistics and Probability
Joe Peck, #19–
Evidently you haven’t read the site much; there is ample disagreement on display, pretty much all the time.
However, tolerance for completely inane or highly repetitive nonsense is limited, since, as the description of the Borehole says, such tends to “disrupt sensible conversation.”
And note that Boreholed comments are still accessible on RC. You can still read them if you are so inclined. That’s a pretty transparent form of ‘censorship’, on the scale of things. (Compare WUWT, which is reported frequently to ban ‘contrary’ commenters entirely.)
Kevin McKinney:
Indeed, Mr. Peck. Why, many of the authors’ disagreements with commenters are conveniently linked at the right side of the page, under “…With Inline Responses”. Be advised that Dr. Schmidt’s replies to AGW-deniers can be subtly humorous.
https://www.topic.com/giant-mirrors-ocean-whitening-here-s-how-exxon-wanted-to-save-the-planet
Kevin,
Your comment made me think (O, the pain).
The borehole could easily be activated into an unmoderated scrum. Let folks post directly and send denialist stuff there, with a standard placeholder/link in the original thread.
That lets those who want to rattle each other’s cages without mucking up the site. Heck, I’d probably let off some steam there. Thoughts?
#25, Al Bundy–
Given that there are folks who try to talk sense at WUWT and even ‘realclimatescience’–and my hat is off to them–your scenario is probably pretty realistic. I’m not sure how I feel about it, though. It might clear the regular threads as you suggest, which would be good. But emotionally, I might prefer a little more distance from said scrum…
The new paper on climate linked ocean color changes raises a new ocean heat content issue-
What is the nature of the feedback between changes in ocean ecology arising from AGW and the phytoplankton component of ocean albedo.?
https://www.nature.com/articles/s41467-019-08457-x#search-menu
In Ocean colour signature of climate change Stephanie Dutkiewicz, Anna E. Hickman, Oliver Jahn, Stephanie Henson, Claudie Beaulieu and Erwan Monier present MIT community model runs indicating that a blue shift from the sea temperature chare arising from RCP 8.5 is emeging from current satellite data and could impact ~60% of ocean area reflectivity or upwelling radiance by 2080. Has anyen considered the quantitative potential for blue water albedo change coupling to SST’s and summer sea ice erosion rates ?