If you think you know why NASA did not report the discovery of the Antarctic polar ozone hole in 1984 before the publication of Farman et al in May 1985, you might well be wrong.
One of the most fun things in research is what happens when you try and find a reference to a commonly-known fact and slowly discover that your “fact” is not actually that factual, and that the real story is more interesting than you imagined…
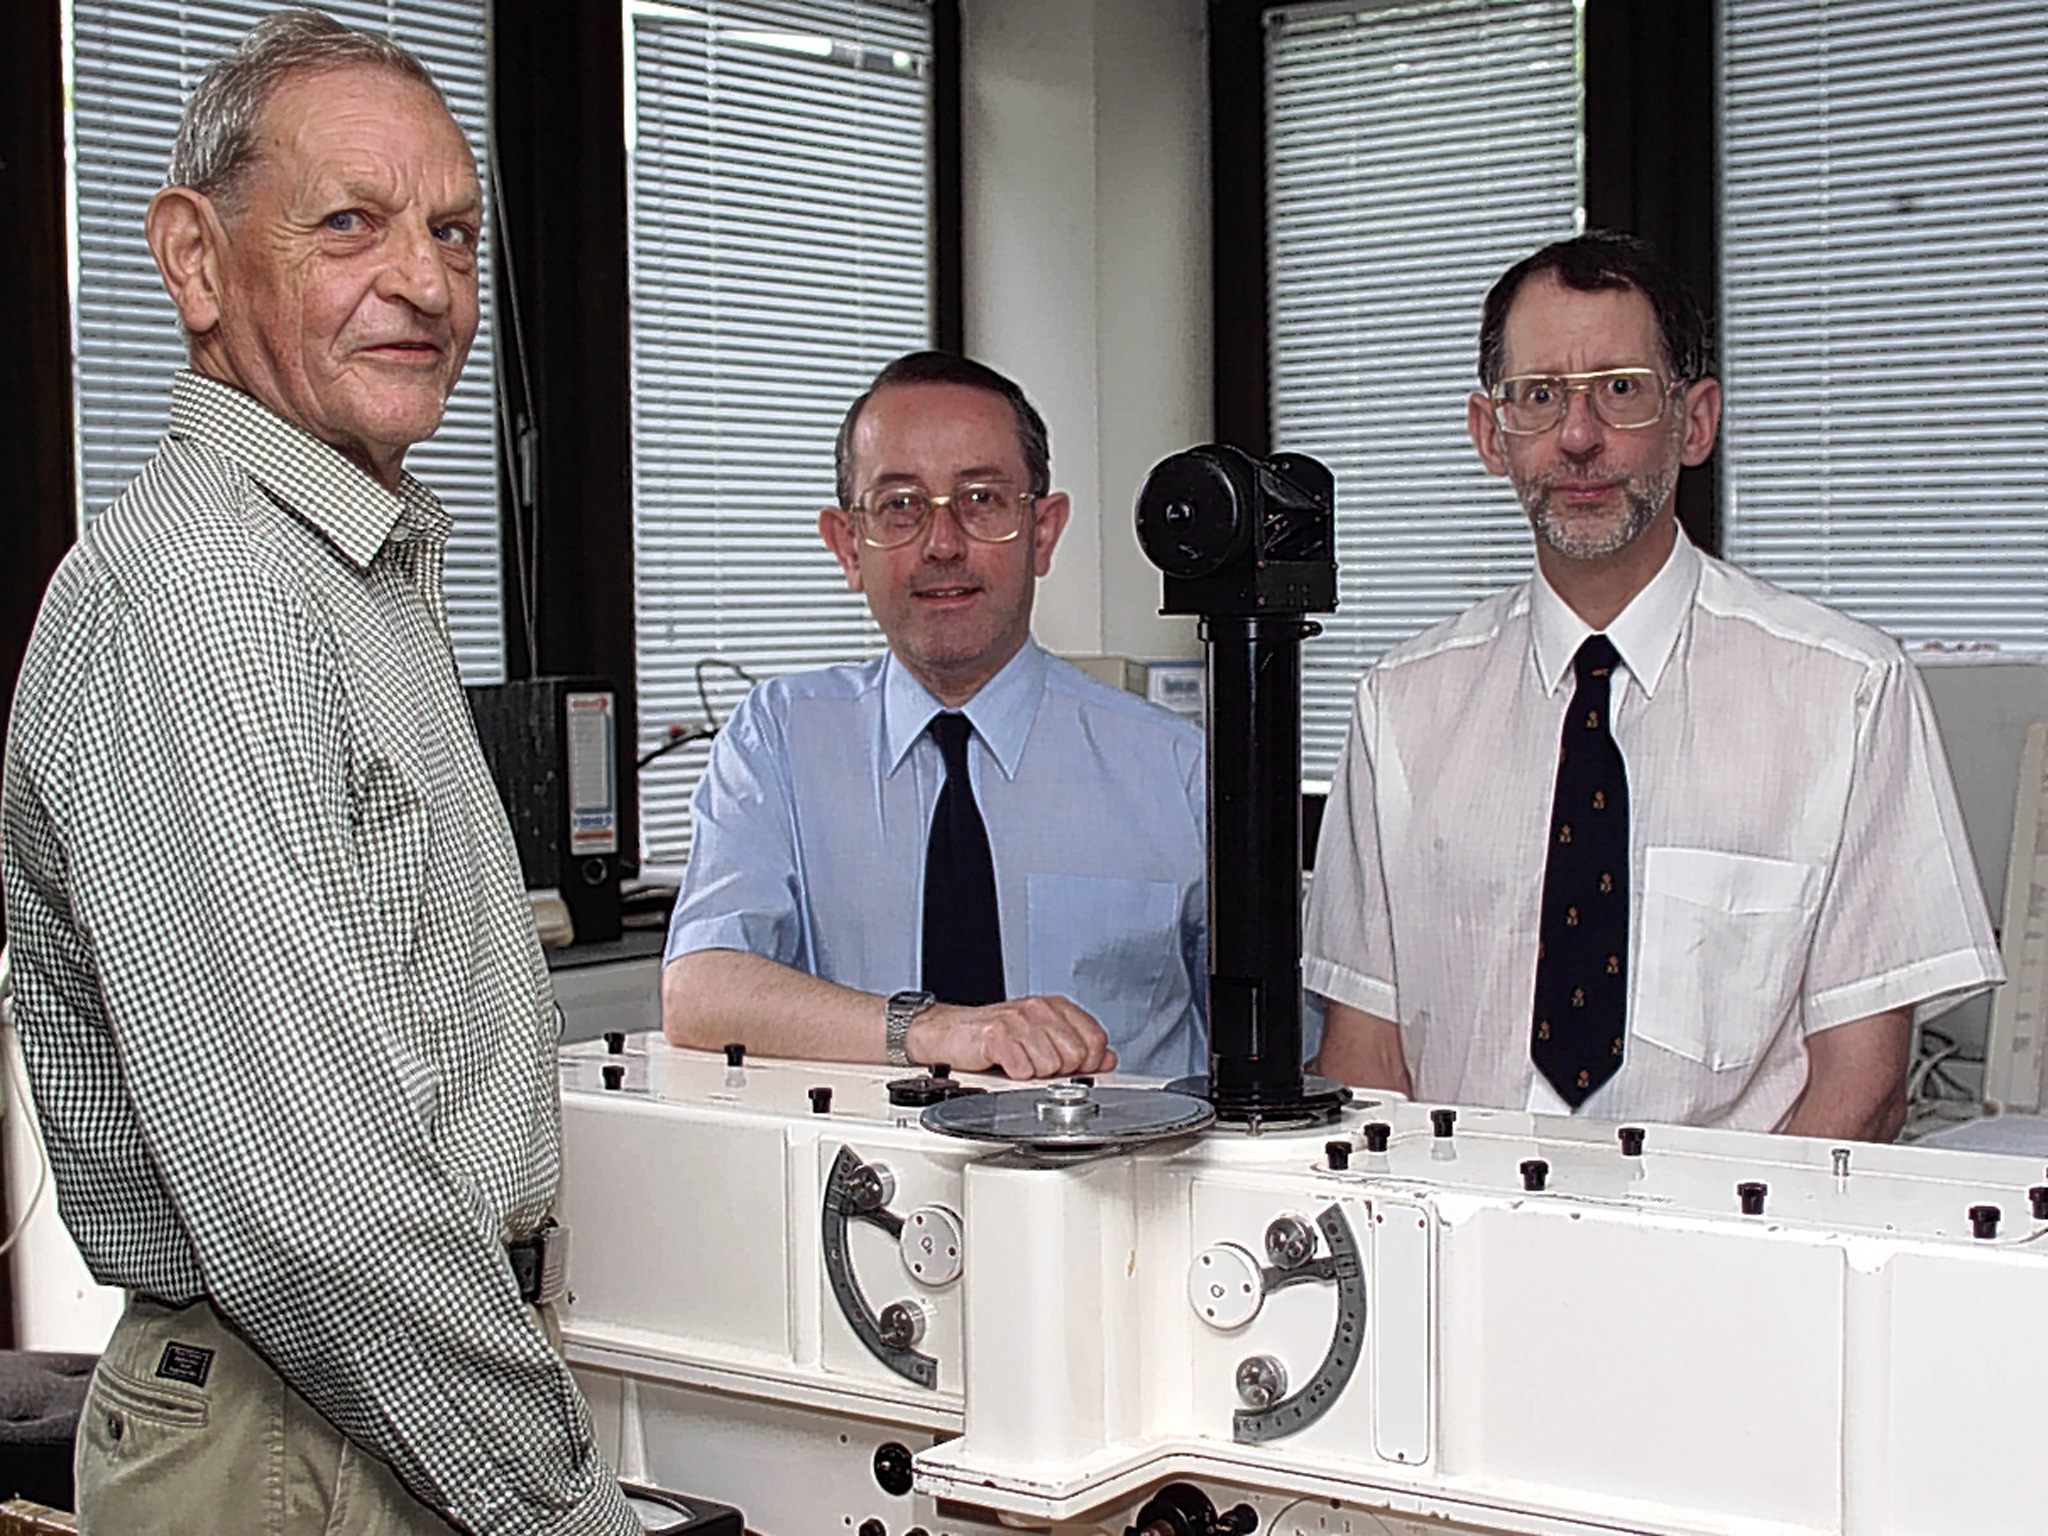 Here is the standard story (one I’ve told repeatedly myself): The publication in 1985 by scientists from the British Antarctic Survey working at Halley Station (right) of observations of extremely low ozone values in Oct 1983 (SH springtime) came as a huge shock to the scientific community. Given that NASA had been monitoring ozone by satellite using the NIMBUS instruments since the late 1970s, people were surprised that this had not been reported already. NASA scientists went back to the satellite data and found that anomalously low values had been rejected as bad data and were not included in the analyses. After reprocessing the data with this flag removed, the trends became clear and the confirmation of ground-based data was reported in the NY Times in Nov 1985 and published formally the next year (Stolarski et al., 1986).
This is mostly true, but not quite…
It is true that the Quality Control (QC) flag on the retrieval was set whenever the inferred ozone level dropped below 180 Dobson Units [1 DU is equivalent to a 0.01mm thick pure ozone layer at standard temperature and pressure]. Prior to 1983, there had never been an observation below 200 DU and so values lower than 180 DU were out of calibration range for the sensor. These calibrations rely on the actual atmospheric profiles being relatively close to pre-defined standards so that deviations in the observed radiances are small, and you can assume quasi-linearity. Deviations that are too large can come from multiple causes and thus are more uncertain to interpret. The absence of a very low ozone profile in the calibration was thus inherently limiting.
However, it wasn’t true that no-one at NASA had noticed.
Satellite anomalies
The processing of the Oct 1983 data was started in August 1984 by the Ozone Processing Team at Goddard Space Flight Center led by A. Fleig and including Donald Heath and P.K. Bhartia. In statements from Bhartia and Richard McPeters, it seems clear that the large increase in flagged data (points that were nominally below the QC level) in October 1983 was noticed and investigated. The first explanation for a large increase in anomalous data is almost always that there is something wrong with the sensor, and the first check on that is comparing the retrievals with whatever ground truth is available. The only publically available real-time Antarctic ozone data at the time was from South Pole (the BAS data was not publically accessible), and that showed polar ozone values of ~300 DU in Oct 1983, casting doubt on the anomalously low satellite retrievals. Nonetheless, retrieved values from the rest of the world outside of the polar vortex were normal so the puzzle remained. Additional data had been available from the Japanese Syowa station for 1982 which would have been helpful, but its publication (in December 1984) was not widely appreciated at the time.
By December 1984, the OPT team was confident enough that the data was real that they submitted an abstract for a conference to be held in Prague in August 1985. [Update: the submitted abstract]

The data that they’d generated (in 1984) included the following map:
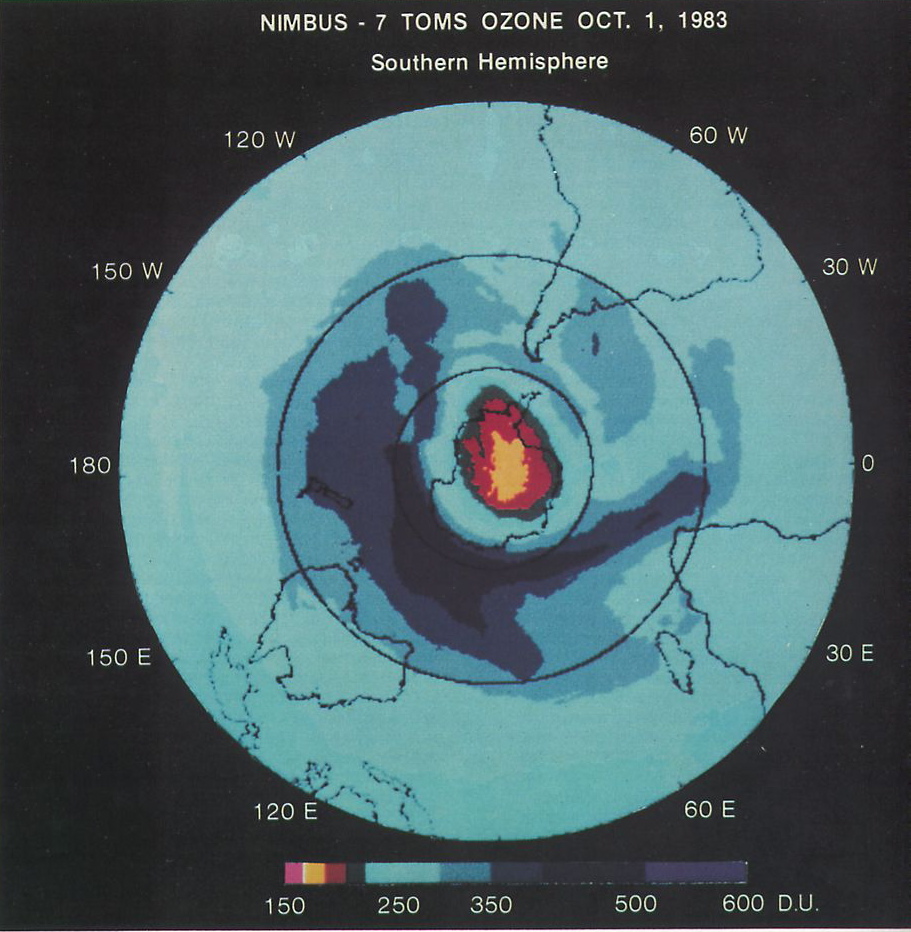
However, before this had been publically presented, the Farman et al paper was published in Nature in May 1985.
Halley Station reports
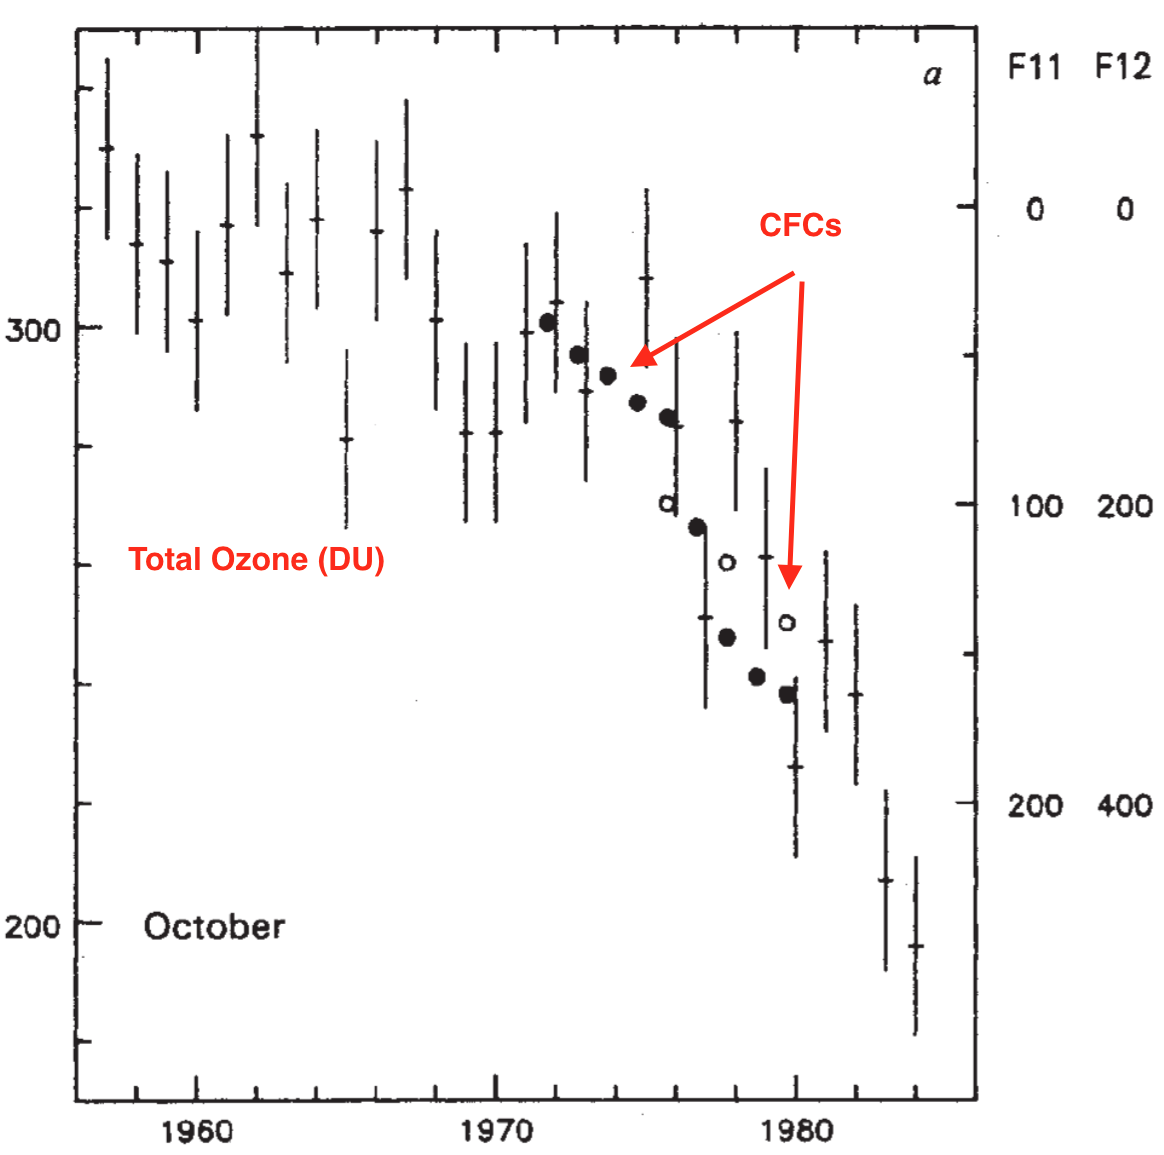
The clear decrease in October ozone values seen at Halley Station (in 1983, falling below 200 DU for the first time), and the correlation to the increasing CFC concentrations (plotted inversely in the figure above), was undoubtedly dramatic.
It wasn’t however until Nov 1985 after a workshop that the first media report (in the NY Times) showed the NASA results (publishing another Oct 1983 map for a slightly different day). That article was notably the first public use the term “hole” to describe the feature (though this term had been coined by Sherwood Rowland some months earlier).
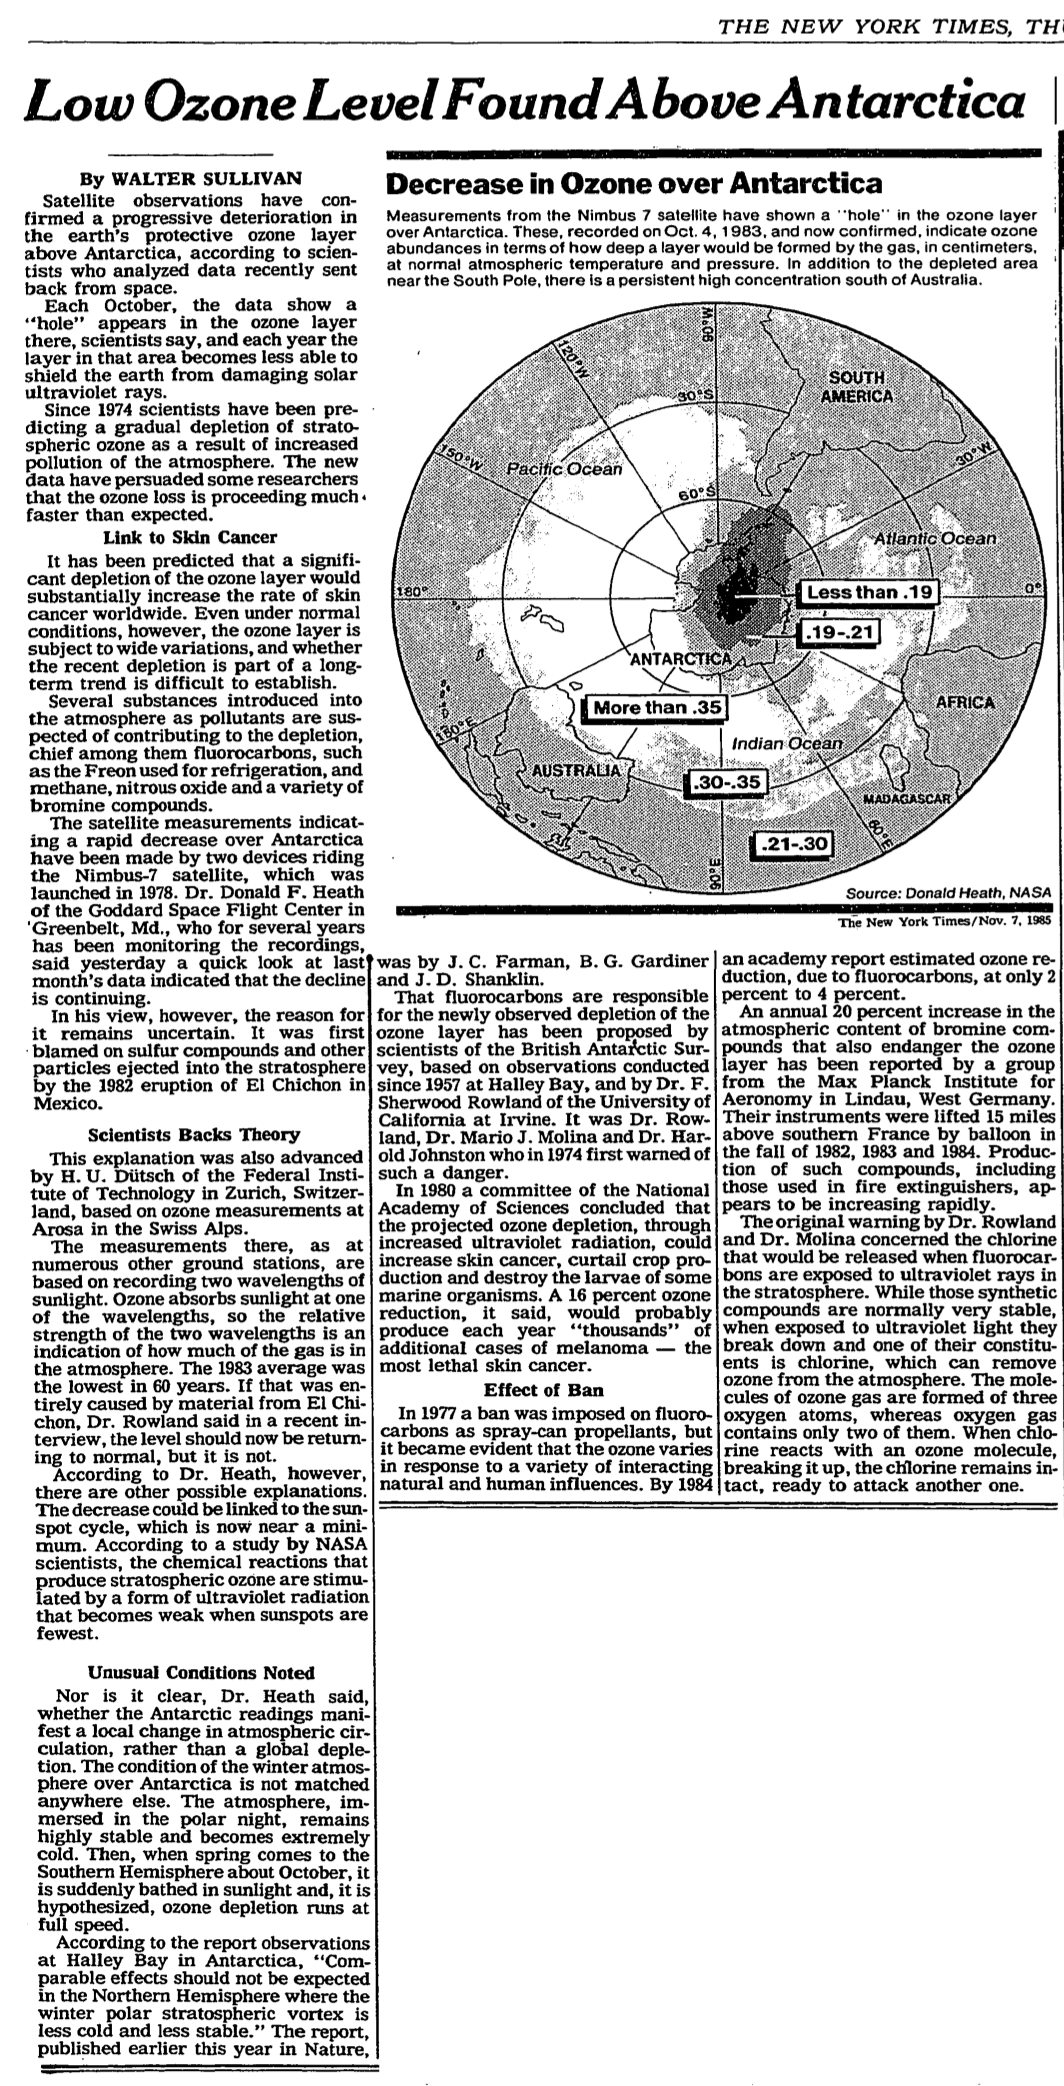
The article is also notable for reflecting the uncertainty that existed at the time about the cause of the anomaly. Farman et al had suggested strongly that increased chlorine loads in the stratosphere were causing the depletion, but two alternate theories were still credible – a dynamical theory based on anomalous upwelling of (relatively depleted) tropospheric air and a solar-cycle related cause.
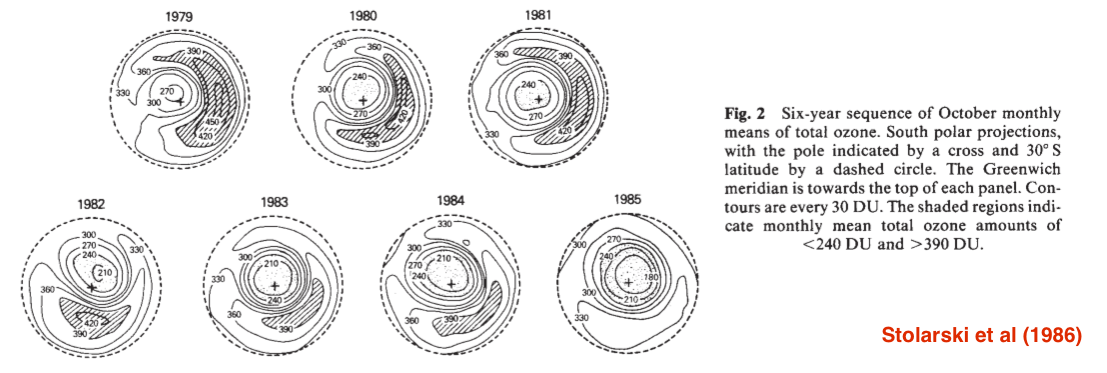
It wasn’t until August 1986 that the first ‘proper’ NASA publication on the NIMBUS trends was published (Stolarski et al., 1986). This data had been processed with additional low DU profiles as part of the calibration and showed clearly the long term trend down across the polar vortex:
and specifically collaborated the low (sub 200 DU) Oct 1983 values seen at Halley Station (dots):
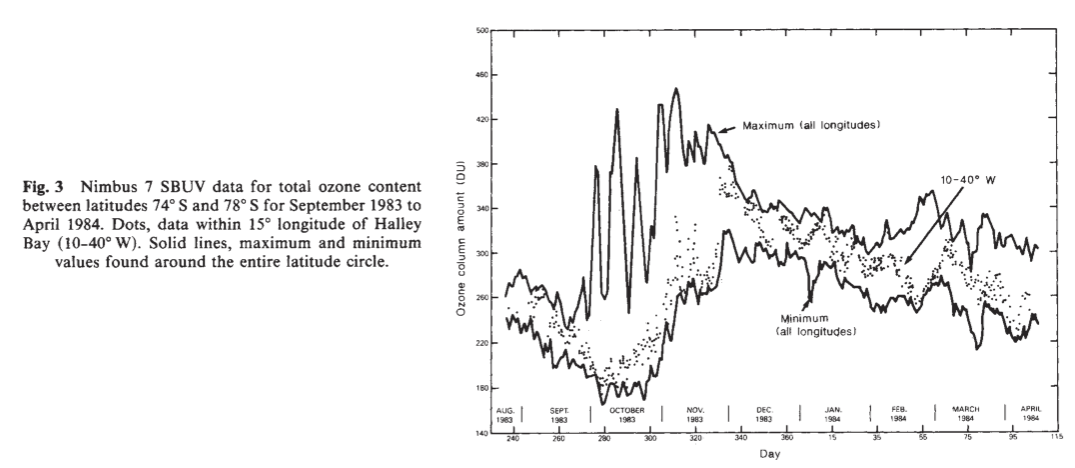
Also in 1986, the South Pole group reported that the preliminary observations from Oct-Dec 1983 had been invalid – the wrong channels had been read on the instrument – a problem that certainly slowed the NASA reporting.
Further field work by NASA during the 1987 Airborne Antarctic Ozone Experiment (AAOE) ended up providing definitive evidence in favor of the chlorine hypothesis, with details of the heterogeneous chemistry on polar stratospheric clouds as hypothesized by Susan Solomon and colleagues in 1986.
Summary
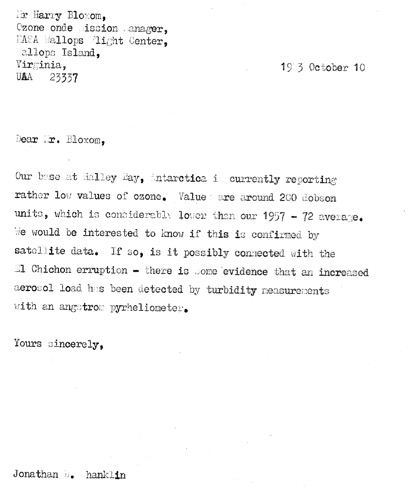
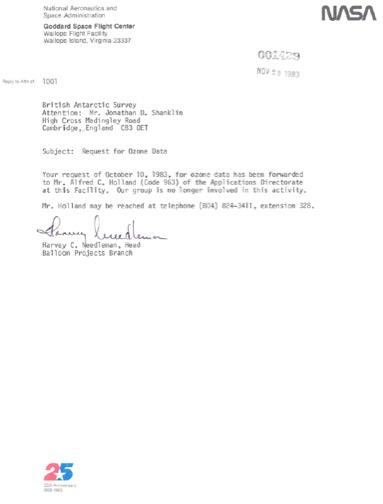
It seems to me that the extra details provided by McPeters and Bhartia (which have been available for many years, though perhaps have not been widely read), and the figure from 1984, change the nature of this story. It isn’t a simple tale of over-confidence in algorithms in the face of black swan events, but rather a tale of poor communications and siloed researchers that slowed down the ability of the wider community to see and interpret what was going on. In some sense this doesn’t matter – enough people were looking at ozone in the polar vortex that if Farman hadn’t reported this, NASA, the South Pole group or the Japanese would have seen it soon enough with similar impacts on the Montreal Protocol negotiations. But the barriers to rapid communication certainly slowed down the community response. For instance, it has been reported that the Farman group had attempted to contact people at NASA prior to publication, but their letters were not sent to the right folk and were never received. [Update: A copy of the letter sent in Oct 1983(!) and the response are attached below (via Susan Solomon)].
What if this were to happen today?
Today, satellite-retrieved ozone data (like much NASA remote sensing) is available in real time. Dramatic increases in ‘bad’ data would be obvious to many right away. With email and (perhaps) a more open scientific culture, people looking at instruments on the ground would have been able to telegraph concerns to the right people working on satellites and other ground stations to confirm their observations much earlier. It seems likely that the initial publications would have been joint efforts (or at least coordinated), even if attribution of the change would still have been contentious.
None of the above should be taken as trying to diminish the work of Farman and colleagues whose ‘old school’ brand of observational science certainly paid off, but a result is far more powerful when seen in multiple independent records.
Further reading/viewing
First-hand descriptions of the NASA effort are available as “MANIAC” (auto-biographical) talks from Paul Newman, P.K. Bhartia and Richard Stolarski at GSFC:
And some further reading here on the role of imagery and metaphor in the ozone “hole” discussion.
Update: letters from BAS to NASA and the response:
References
- J.C. Farman, B.G. Gardiner, and J.D. Shanklin, "Large losses of total ozone in Antarctica reveal seasonal ClOx/NOx interaction", Nature, vol. 315, pp. 207-210, 1985. http://dx.doi.org/10.1038/315207a0
- R.S. Stolarski, A.J. Krueger, M.R. Schoeberl, R.D. McPeters, P.A. Newman, and J.C. Alpert, "Nimbus 7 satellite measurements of the springtime Antarctic ozone decrease", Nature, vol. 322, pp. 808-811, 1986. http://dx.doi.org/10.1038/322808a0
- P.K. Bhartia, "Role of Satellite Measurements in the Discovery of Stratospheric Ozone Depletion", Twenty Years of Ozone Decline, pp. 183-189, 2009. http://dx.doi.org/10.1007/978-90-481-2469-5_13
- W.D. Komhyr, R.D. Grass, and R.K. Leonard, "Total ozone decrease at South Pole, Antarctica, 1964‐1985", Geophysical Research Letters, vol. 13, pp. 1248-1251, 1986. http://dx.doi.org/10.1029/GL013i012p01248
- S. Solomon, R.R. Garcia, F.S. Rowland, and D.J. Wuebbles, "On the depletion of Antarctic ozone", Nature, vol. 321, pp. 755-758, 1986. http://dx.doi.org/10.1038/321755a0
> working at Halley Station (right)
Just to clarify, that photo is taken at BAS, Cambridge (specifically, in the New Bit, known as “Galtieri House”). Also, whilst the obs were done at Halley, I’m pretty sure the bulk of the science was done back in Cambridge.
Farman is worth listening to on this topic. He was recorded for the British Library Oral History of Science for some 13 hours. A transcript is available. Some excerpts:
Joseph Farman [starting at] Page 276 C1379/07 Track 15 © The British Library Board:
“One of the odd things about the whole of the ozone story I suppose is it demonstrates, you know, how shall we put it [laughs], in a rather worrying way how compartmentalised science can get….”
“…there was this huge gulf between people who wrote papers and the poor people who made observations, there was very little feedback, you know, by the people who regarded the data as important to the people who were making it. But, you know, it’s much the same with the theoretical chemists. They really had no idea what the real Antarctic atmosphere was like and so I suppose it’s not surprising that no-one really sort of thought Antarctica was a place where you ought to be looking for this but when you look back with hindsight it is perfectly obvious. And I suppose I’m as guilty as anyone….”
“…the following won’t surprise anyone but it really did seem to one that no-one who knew anything about ozone had bothered – had read the paper at Nature….”
“…very little feedback came through to us until a telephone call from the United States embassy to say that Bob Watson was coming across, bringing some satellite pictures of the TOMS maps of ozone measurements, would I like to wander down to the embassy to have a look at them….”
[starting at] Page 293 C1379/07 Track 15 © The British Library Board
“…Er … the – NASA made a press release when they’re reworked the satellite data. Hmmm, I mean you know the story that they simply had invented upper and lower limits and all the – in the last October before the– well, in the October which coincided just before the meeting I had in Cambridge they were actually flagging something like seventy per cent of the October data but no-one was looking at it and, you know, flagged the data but no-one was actually told. Someone had forgotten to write a little message saying, you know, this is how much data we’ve had to disregard this particular month, I mean anyone with any sense would have put a little flag up which says we’ve discarded ninety per cent, 100 percent or something [laughs]. And they had no idea so when – it took them – yes, what was it, from – well, they knew about it before the publication in May. I mean they knew about it in something like January and, hmmm, it was October before they’d reworked it and drawn pretty maps. And when they’d done this they made a press release and that’s where the ozone hole came from. And no-one quite owns up to it but it certainly appeared in the Washington Post but who’s actually responsible for the name ‘hole’ – not that it matters very much…..Well, they had a press release and the Washington correspondents must have asked some questions, someone said, well, it looks like a hole doesn’t it, or something [laughs]. Yes, we should probably say that this satellite data, that there’d been a – Nimbus Seven had had two ozone instruments on since 1978 but as you said they discarded these very low – or ignored these very low values because it was – Well, they simply put in an upper limit and a lower limit. I mean you get so much data from an instrument like that and, I don’t know if things have changed, I very much doubt it, but although they’re prepared to spend several million dollars putting the damn thing up there they’re not prepared to pay one person’s salary just simply to look at what comes back and it’s so mad you could scream, I mean it really is. So, you know – I mean at least they didn’t delete it, you know. When they wanted to they could go back and look and see what the values were….”
.
The time series of Halley station already showed large declines before 1984. Any idea why that did not set off alarm bells? Because it was declining from the start and people did not know how much local variability was reasonable?
In the Bhartia video you have embedded above, around 20:40 and later, Bhartia explains that Farman’s Nature paper appeared in May 1985 and was “big news”.
He states he “did not personally know that Farman was collecting data”, but he does not say when he did come to personally know about Farman’s work. On the other hand, Farman asserts that NASA “knew about it [ his measurements ] in something like January [1985] and, hmmm, it was October before they’d reworked it and drawn pretty maps”. – see my previous comment quoting Farman, from a recording of an interview with Farman done by the British Oral History of Science.
Bhartia states that he presented his world’s first “picture of the ozone hole” “several months later”, i.e. several months after the publication of Farman’s letter to Nature. If Farman’s assertion that NASA knew of Farman’s measurements by January 1985, perhaps as part of the peer review process, Bhartia’s presentation at the October Prague meeting was almost a year later.
Bhartia claims that the two groups (Farmans and his) were working independently without knowledge of each other, as if, had Farman not published, he, Bhartia, would have been able to present his paper on what would have been his discovery of the ozone hole in Prague.
Bhartia does not make clear whether the publication of Farman’s Nature paper was what caused him to reexamine the archived NASA satellite data.
I didn’t hear Bhartia making this case, i.e. that he and others at NASA were independently aware of low ozone readings over Antarctica prior to Farman drawing the world’s attention to this, at the time.
Farman, on how credible he thought explanations that did not involve halogen chemistry were:
“I mean we felt we had made a rather convincing statement when we said not only do we measure ozone but we also have upper air observations and over the five years in which the ozone’s fallen away dramatically there has been no shift in winds or temperatures or whatever. In – to a good first approximation we can surely say it can’t be transport but that didn’t prevent people telling us, oh, it’s all transport [laughs].”
Dr.G.Schmidt
What matters quite a lot for People like me and many others for whether you should believe or not believe in social and political rumors, is whether it is scientifically plausible and can be shown by, at least 3 other, and systematically independent Methods or reasons.
(=the rule of 3 good reasons before you buy it or set on it)
That ozone story came up as a kind of popular rumors at the university festivals, and I asked a local Einstein looking to explain it to me. My categoric idea was that UV causes ozone in the lab and outdoor. At the same time Ozone is told to stop UV, thus there ought to be a very Direct negative feedback that balances it and thus nothing to worry about.
That Einstein told:Shortwave and longwave UV youn see, and I had not yet undersood all this.
Thus I could disqualify him. That was in the seventies.
But then I got it at last. Some japaneese had taken a metal tank and pumped it Down to air pressures similar to that of the ozone layer, and then turned on an UV- lamp inside. Ozone is measured photometrically simply by ciculating that atmosphere through a long tube open at the other end where UV shines, onto a proper UV- detector and a Servograph.
By turning on the lamp, the UV as measured will grow up to a certain Natural Level and stay there.
But then by “fzzzzzzt..” some Freon ito that tank, the ozone Level will drop and stay low. Further with an explaination of a certain Chain reaction by that fluor hydrocarbon, that acts as a catalyst and will stay there for a very long time.
That story and explaination was credible and proper science.
I have a personal relation to it. Sunshine is low in the Winter in Norway, but when the sun comes back “on a Clear day in Mars” it smells ozone everywhere. My wife hangs out her laundry and it comes back smelling fresh ozone. Those are the ozony days in spring, where you should also Paint outdoor in that very clean and dust- free air.
Textiles can be bleached and desinfected in the sun and just as important, traditional and “slow” oil-paints will dry and harden quite much faster outdoor in that sunshine and ozone, regardless of temperatures. What attacks the doubble bonds of omega 3 and even triglyceride ester bonds is ozone rather than oxygen.
We can also harden polyester plastic by UV, Peroxydes, or Ozone. And the further question is what it will further do With obscure industrial smoke.
SO2 in the air will also eat ozone and contribute to photochemical smog. All that is plausible.
I further consulted an old lecture from 1946 by Ernst H.Riesenfeld on ozone. Riesenfeld shows to have been the expert on it.
Ozone is made by Liebigs ozone- Device. Ozone detonates at concentrations higher than 0.12 bar regardless of temperatures…., where Delta H is allmost as high as for “Oxyhydrogen”.
Thus, for handling ozone from Siemens`device in the lab you must take very clean quarz or Jena- glasses, thorroughly rinsed from any kind of nitrous gases (that are common in the lab), and Mount it air tight with clean PARAFFINVM SOLIDVM, that is not attacked by Ozone, = quite remarkable.
Whereas any kind of rubber and Cork or glues in the mounts will be eaten.
Carbon doubble bonds especially turpenes together with ozone give ugly smelling “Ozonides”, that detonate by any attempts of further Research into it.
NO (known to destroy ozone quite eagerly) is a free radical that breaks the O::O doubble bond, an so does also Atomic chlorine known from the Japanese Freon- argument.
H2O2 is known to cause the Conversion of SO2 to SO3 similar to the catalytic action of traces of “NOx” and air in the lead Chamber sulphuric acid process. Whereas common UV does not crack the strong N:::N tripple bond in air.
Thus we can disqualify the long and shortwave argument and simply discuss sunshine.
Sunshine and ozone is a very old and proper method of hardening tricky tars and Paints, and for desinfection and eventual bleaching.
Ozone may be essencial for possible decay of plastics in Nature.
This is elementary science ans all I have to know about ozone.
The Stolarski 2015 Maniac Lecture video you’ve put up doesn’t throw much light on this.
In the video, around the 24th minute, Stolarski explains: “I was going to go on and talk just a little bit about the Antarctic ozone hole. Last time I gave this talk, three years ago I talked quite a bit about this – I’m just going to touch on it a little bit. There’s one kind of message that I’d like to come out…”
He then discusses the Farman paper and the ozone hole graphic the Bhartia group came up with. Then Stolarski says: “There’s whole stories about… exactly… a lot of that got mistranslated into many things.”
He then put up a slide showing this Rowland quote: “this observation by the British brought the NASA people back to look at their data. Actually they’ve gotten sort of a bad rap about it. What they did was program their data to reject, but notify, that some unusually low ozone values were being recorded. If you are getting unexpected low values when the instrument is working at the very limit of its detection, then you put that aside saying maybe there is something happening there that is real, but maybe it is an instrumental problem, and we’ll have to go back and look at it carefully.”
Then, right after he has called the attention of his audience to Rowlands words, Stolarski says Rowland “isn’t saying it quite right either”.
Then, he says, “but the point was, well what was the point. I don’t know what the point was.” He then moved off this topic.
All I could find of his three years ago talk which apparently was entitled “Stratospheric Ozone: How We Came to Understand its Chemistry and Response to Pertubations”, was a pdf of the slides.
The Richard McPeters letter you link to in your article seems to be the clearest support for the case that NASA did know something was going on over Antarctica independently of Farman. Thanks for posting that.
Does anyone have a copy of the actual paper McPeters says they submitted an abstract of, in late 1984, “months before the publication of the Farman et.al. paper” to the August 1985 Prague meeting?
[Response: I have a request to our librarians for a copy of the abstract that was submitted to IAGA. For reference the link to the Stolarski slides from 2012 is here. – Gavin]
#6 Carbomontanus
What You are writing there is totally interesting if not to say fascinating,
still I lost track where you wanted to go… quintessence?
Cheers
Marcus
There’s an other twist to the story of the detection of the ozone hole:
Very low ozone values in September-October 1982 over the Syova Antarctic station were already reported in 1984 by the Japanese scientist Shigeru Chubachi in a poster at an Ozone conference in Greece in 1984. But he was told by the conference attendants that he should go back and check his instrument calibration. Nevertheless, he managed to publish his contribution in the conference proceedings (Chubachi, S., in Atmospheric Ozone, Zerefos, C.S. and Ghazi, A., eds., Reidel Publishing Company, Dordrecht, Holland, p. 285, 1984). Documented only in the gray literature and without a decent theoretical underpinning, this early finding did not receive much attention. At least Chubachi’s data were cited by Solomon et al., 1986, but his contribution sadly is not much acknowledged in the literature on the ozone hole history.
[Response: Thanks. I did link to the pdf of that paper above but that does provide more detail. – gavin]
Martin Heimann @9
Please excuse the nitpicking, but the name of the Japanese station is Showa, with a macron over the “o”. (I don’t think I can do macrons here.)
I do know Jonathan Shanklin – the author of BAS letter and person far right in the top photo – personally and we would, under normal circumstances, be meeting fairly regularly. It would be interesting to see whether he recalls any substantive response from NASA, as implied by the second letter. However, he is currently at the BAS Halley base, since mid December and is somewhat restricted in communications. He is, I understand, testing an automated system for recording ozone, since Halley is due to be left unoccupied this (antarctic) winter again.
I will try to remember to draw his attention to this thread when he returns.
Victor #3
This video seems to suggest that actually no-one had thought to do a long term plot of ozone levels. It is quite bizarre that, as Jonathan states, it was a public open day, along with worries about Concorde exhaust fumes that initially provoked the investigation
I can clarify a few points:
NASA was running a program of satellite ground truth measurements before our discovery. Their Satellite Ozone Analysis Centre would send us a list of overpass times at our stations, and we would then pass a list of times on to each individual station. They would then make additional measurements for the satellite, which were then telexed back to us in Cambridge for onward transmission to NASA. As we were a little concerned about the apparently low levels I wrote and asked if they were confirmed by the satellite. Fortunately there was no reply. The letters shown above were to a different group who were carrying out balloon based studies. This program was carried out at Faraday station, which lies on the margin of the polar vortex, and none of the flights showed conclusive evidence of ozone depletion. All our analysis was carried out in Cambridge – the observations were made in Antarctica and usually it took over a year to get the full details back in Cambridge as there was no internet and transport was by ship. As the satellite values were needed quickly we arranged for them to be sent by radio telex, which has very limited bandwith.
I was the one who first did the long term plot of springtime minimum ozone values, and this convinced Joe Farman that there really was something going on over Antarctica. Our long term series immediately should have ruled out any solar cycle connection as it covered more than one cycle, but the satellite people only used their data back to 1976, which didn’t rule it out. One key lesson is the need for continuous long term monitoring of any environmental variable.
Jon Shanklin, Halley Research Station, Antarctica
Wikipedia: Lovelock invented the electron capture detector, which ultimately assisted in discoveries about the persistence of CFCs and their role in stratospheric ozone depletion. https://en.wikipedia.org/wiki/James_Lovelock
Paywalled, but Lovelock published two studies on this topic in the early 70s
Atmospheric Fluorine Compounds as Indicators of Air Movements https://www.nature.com/articles/230379a0
Halogenated Hydrocarbons in and over the Atlantic https://www.nature.com/articles/241194a0
These studies might stem from Lovelock working for NASA in the early 60s, from to developing sensitive instruments for the analysis of extraterrestrial atmospheres.