You need to be careful in inferring climate sensitivity from observations.
Two climate sensitivity stories this week – both related to how careful you need to be before you can infer constraints from observational data. (You can brush up on the background and definitions here). Both cases – a “Brief Comment Arising” in Nature (that I led) and a new paper from Proistosescu and Huybers (2017) – examine basic assumptions underlying previously published estimates of climate sensitivity and find them wanting.
Last year, there was a paper that described a new composite record of temperatures going back 2 million years (Snyder, 2016). As we discussed at the time, those results were used to conclude that the Earth System Sensitivity (the total response to a doubling of CO2 after the short and long-term feedbacks have kicked in) was around 9ºC — much larger than any previous estimate (which is ~4.5ºC) — and inferred that the committed climate change with constant concentrations was 3-7ºC (again much larger than any other estimate – most are around 0.5-1ºC). We posted a discussion about why (even in principle) this was not a good methodology for estimating ESS. Well, now there is a Brief Comment Arising (and a rather combative response) published in Nature.
As simple as possible (but no simpler)
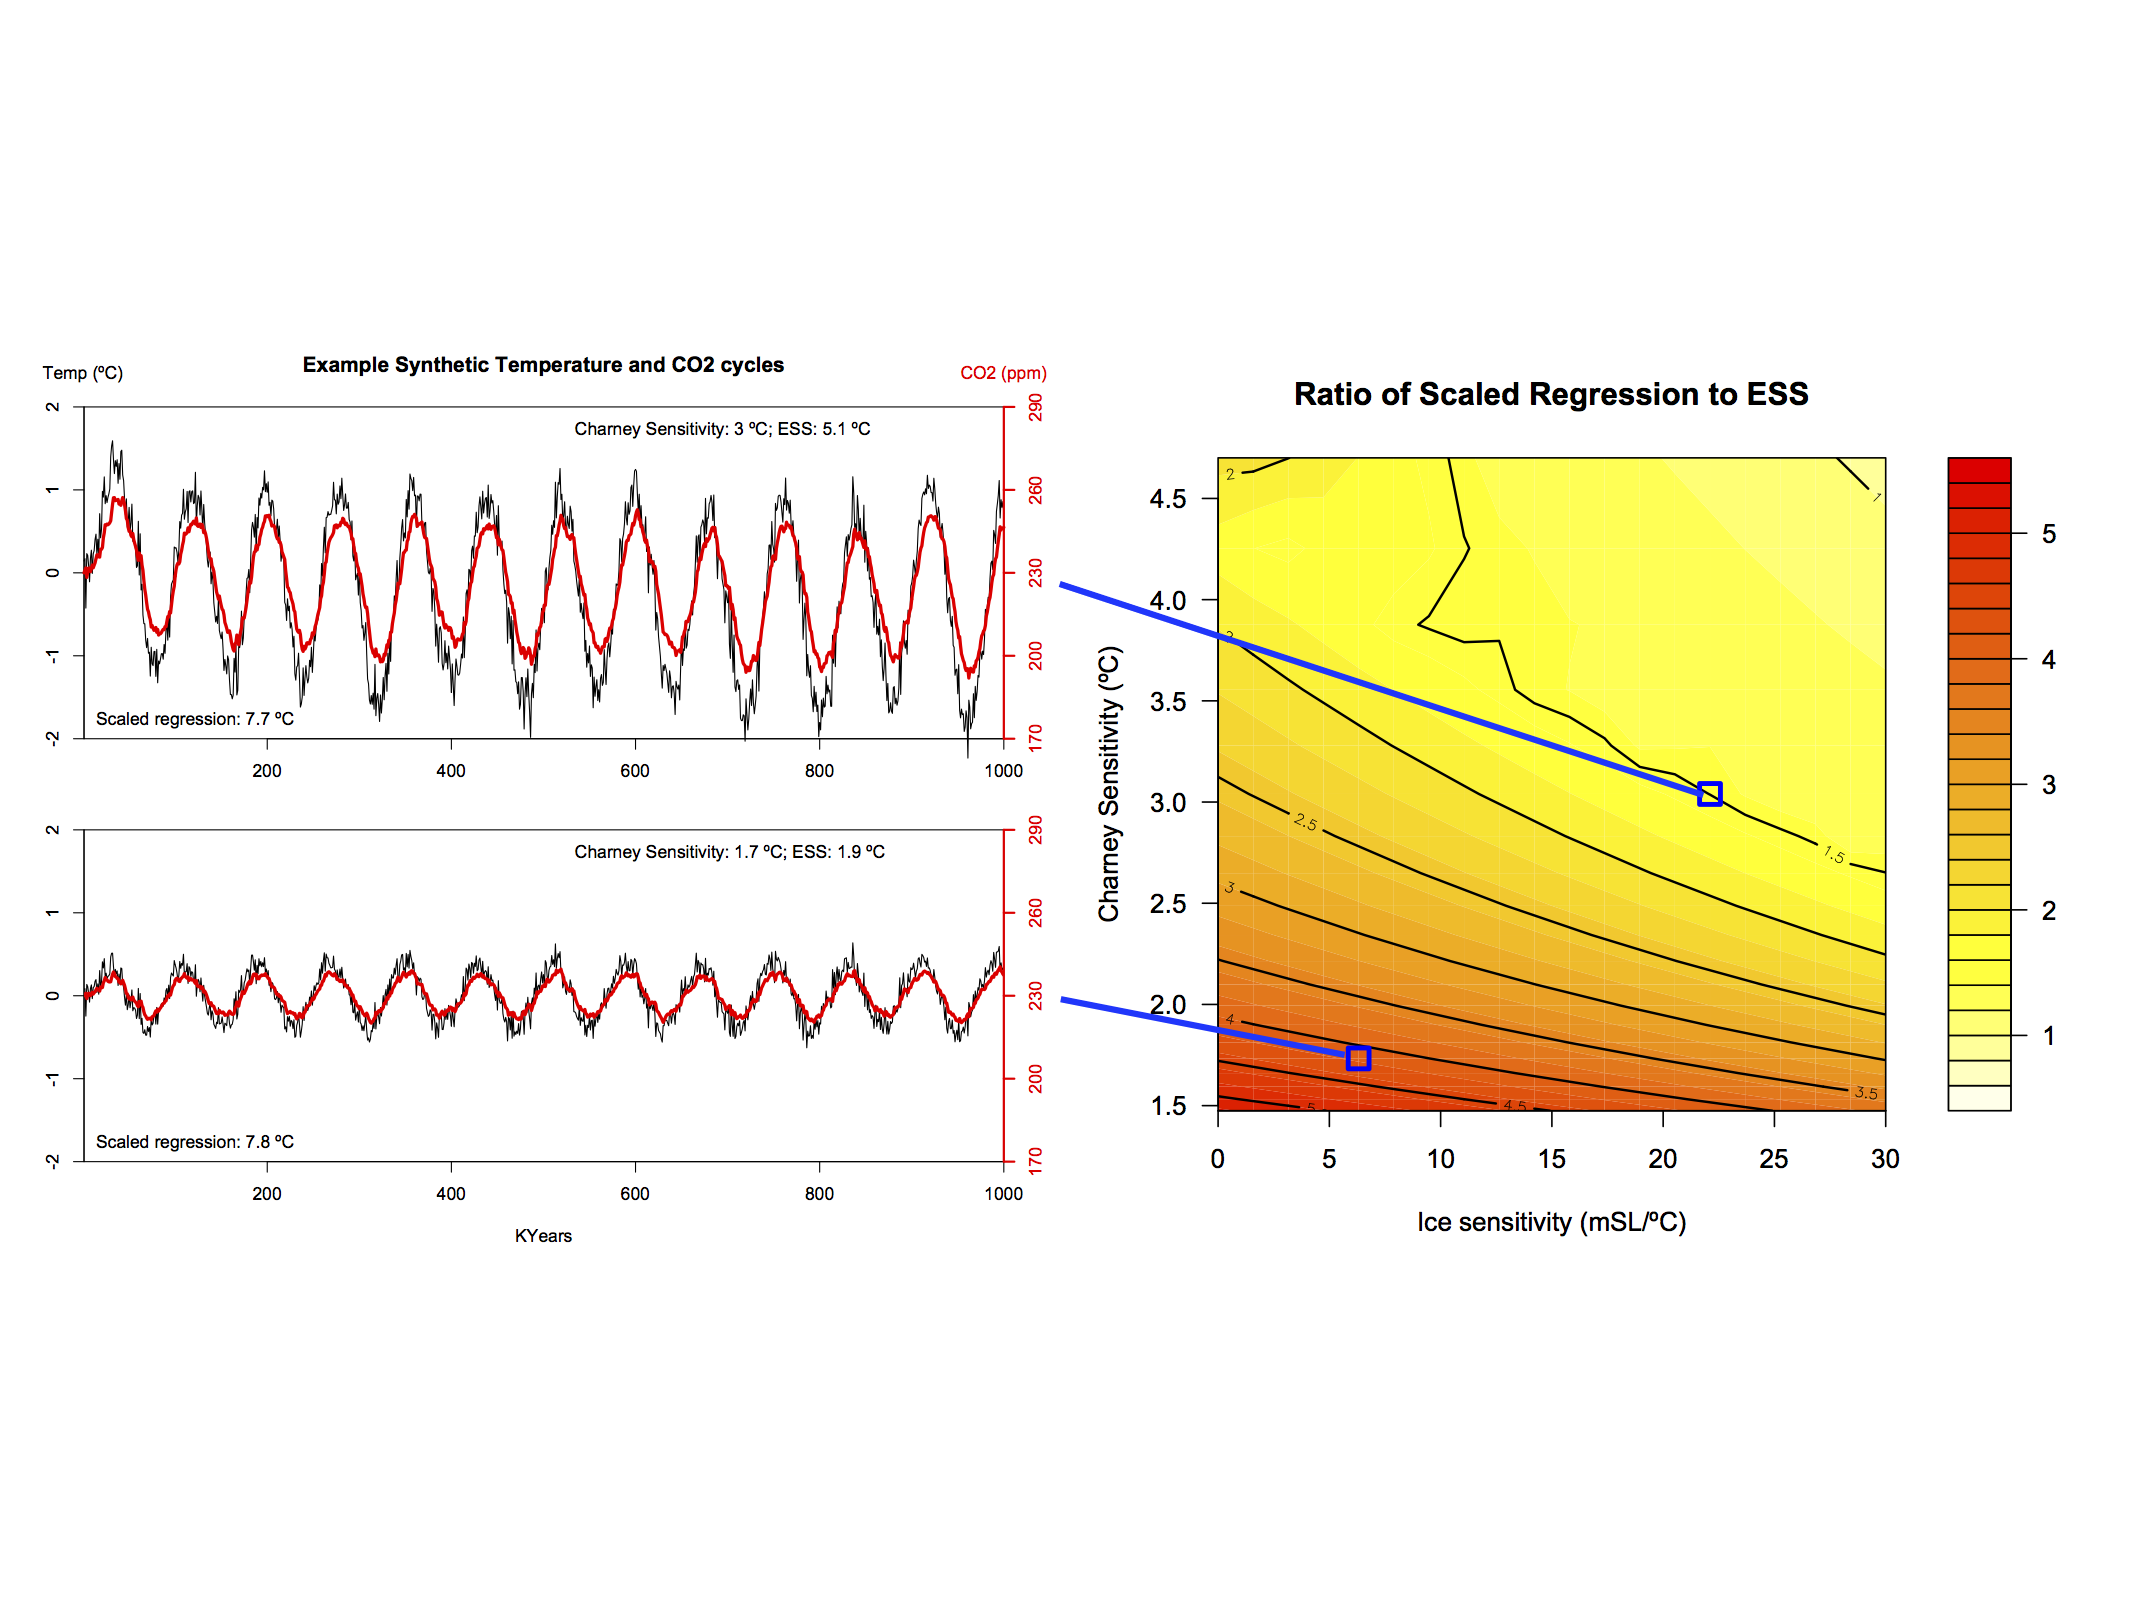
The essence of the comment is a model that we put together that (I think) is the simplest that you can derive that includes a carbon cycle, ice sheets, and allows for the standard ‘Charney’ sensitivity (ECS) and the ESS to vary independently. The documentation and R code for the model is part of the supplementary material, as is a Jupyter notebook for a python version (so knock yourself out if you want to explore it further). What this model shows is that if orbital variations in insolation impact ice sheets directly in any significant way (which evidence suggests they do Roe (2006)), then the regression between CO2 and temperature over the glacial-interglacial cycles (which was used in Snyder (2016)) is a very biased (over)estimate of ESS. The results from this model demonstrate clearly (and in line with our initial criticisms) that the Snyder (2016) suggestion of a very high ESS and committed warming is unfounded.

Relationship between the CO2/T regression and the actual ESS for two specific cases of our simple model when you run it with an 80,000 year orbital cycle. The ratio in the right hand figure and is almost everywhere greater than one, implying an overestimate when using the regression.
The second example follows a few other papers in challenging the assumptions behind constraints on the Charney sensitivity derived from historical changes in temperature and forcings. These transient constraints have tended to come in lower than the other estimates based on paleo-climate or emergent constraints, and thus have been embraced by (let’s say) more ‘optimistic’ commentators (though until the mismatches are resolved it would be premature to only favor only one class of results).
The basic issue looked at in Proistosescu and Huybers (2017), is the model result that suggests that there is a time dependence in the evolution to equilibrium. Others have identified the lags in the southern ocean (which warms more slowly than the northern hemisphere, and northern land in particular) as the source of this time dependence of feedbacks, and we’ve demonstrated that different forcings have subtly different impacts – to some extent based on their spatial signatures. This implies that analyses in the early part of a transition to a new equilibrium will give lower sensitivities than they should.
One persistent (yet sometimes interesting) critic of these results is Nic Lewis (a few previous cases), and he has attempted to dismiss these results as well. The common thread in his criticisms is that these results are based on behaviour seen in models. However, these models are much more complex and better validated than the 1-D energy balance model used in these constraints, so the more correct view is that the simplistic assumptions needed in his approach don’t seem to work in more sophisticated set-ups, and thus are unlikely to be valid in the real world. These effects may not be perfectly captured in the CMIP5 ensemble or in any specific model, but that doesn’t justify assuming that they are zero with zero uncertainty.
The overall conclusion to be drawn is that both very low (<2ºC) and very high estimates (>5ºC) of sensitivity can likely be ruled out by recourse to a wider set of data. Hopefully those constraints will get narrower as we get make more progress, but the current range has stood the test of time for good reasons.
References
- C. Proistosescu, and P.J. Huybers, "Slow climate mode reconciles historical and model-based estimates of climate sensitivity", Science Advances, vol. 3, 2017. http://dx.doi.org/10.1126/sciadv.1602821
- C.W. Snyder, "Evolution of global temperature over the past two million years", Nature, vol. 538, pp. 226-228, 2016. http://dx.doi.org/10.1038/nature19798
- G.A. Schmidt, J. Severinghaus, A. Abe-Ouchi, R.B. Alley, W. Broecker, E. Brook, D. Etheridge, K. Kawamura, R.F. Keeling, M. Leinen, K. Marvel, and T.F. Stocker, "Overestimate of committed warming", Nature, vol. 547, pp. E16-E17, 2017. http://dx.doi.org/10.1038/nature22803
- G. Roe, "In defense of Milankovitch", Geophysical Research Letters, vol. 33, 2006. http://dx.doi.org/10.1029/2006GL027817
- K.C. Armour, "Energy budget constraints on climate sensitivity in light of inconstant climate feedbacks", Nature Climate Change, vol. 7, pp. 331-335, 2017. http://dx.doi.org/10.1038/nclimate3278
As the GIS melts causing freshening North Atlantic and reduced THC, northern Europe is expected to cool. Will the lower export of heat from the tropical Atlantic cause larger water vapor feedback and an increase in global average temperature despite local(ish) cooling?