Bjørn Lomborg is a well-known media personality who argues that there are more important priorities than reducing emissions to limit global warming. In a recent controversy centering on him, the Australian government (known for its contradictory position on climate change) offered the University of Western Australia (UWA) $4 million to make Lomborg professor – which UWA first accepted, but then after massive protest from its staff and students refused. The Australian government was quick to label it a “freedom of speech” issue that Lomborg should get a university position, and vowed to find another university that would host him. However, free speech doesn’t guarantee everyone a university position; there are also academic qualifications required.
A translation of this post in Spanish is available here.
Lomborg’s publication record
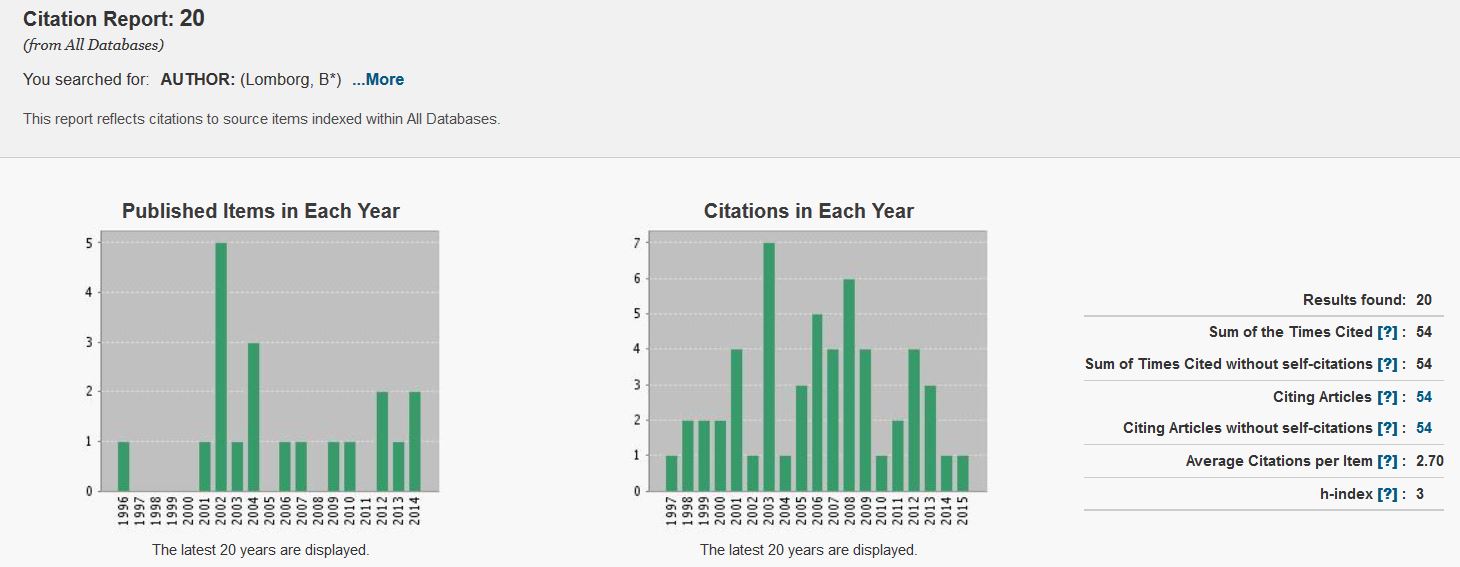
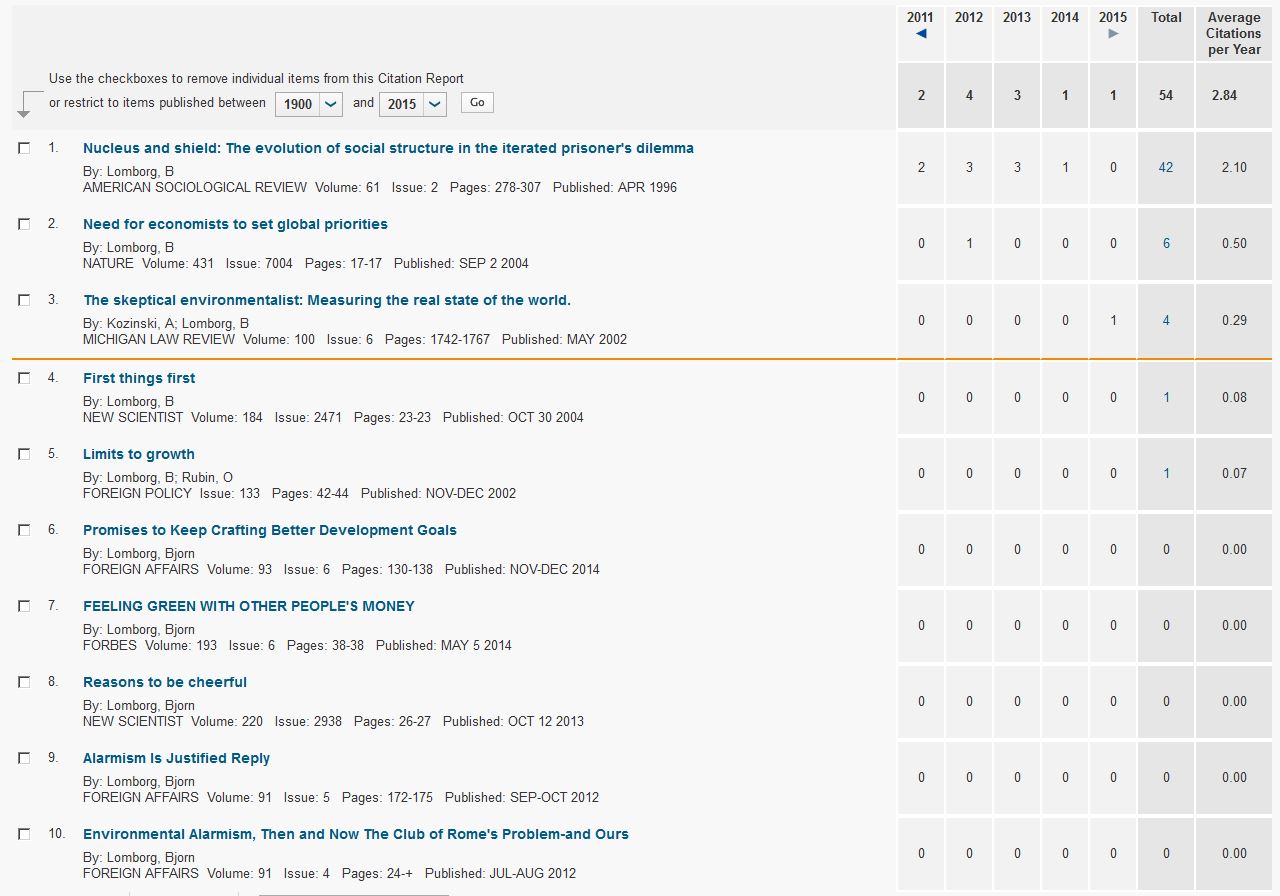
Let us thus start by looking at Lomborg’s track record in the scientific literature. This is where original research results, i.e. new findings, are published. One can look this up in the Thomson Reuters Web of Science, the main data base of the scientific literature. According to this Lomborg only has published 20 papers, of which 15 have never been cited by anyone (Fig. 1). The number of citations shows whether any other researchers in the world have found the results interesting enough to discuss them in their own papers (whether critically or otherwise). Only one of Lomborg’s papers has a reasonable number of citations: 42. This is on a problem of game theory, apparently resulting from his PhD thesis. On closer inspection, the other articles appear to be merely opinion pieces that made it into the Thomson Reuters data base by appearing in periodicals that are indexed there, including Forbes, Foreign Affairs or New Scientist.
Figure 1 Lomborg’s citation record in Web of Science, as viewed on 22 Aug 2015. The ten most-cited papers (out of 20) are listed. Click to enlarge.
That means that apart from one paper in 1996, Lomborg has never published anything in any field of science that was interesting or useful to other scientists, or even just worth the bother of contradicting in the scientific literature. PhD students at many universities are expected to publish two or three original research papers from their PhD, and without that, they are generally uncompetitive for a postdoc position.
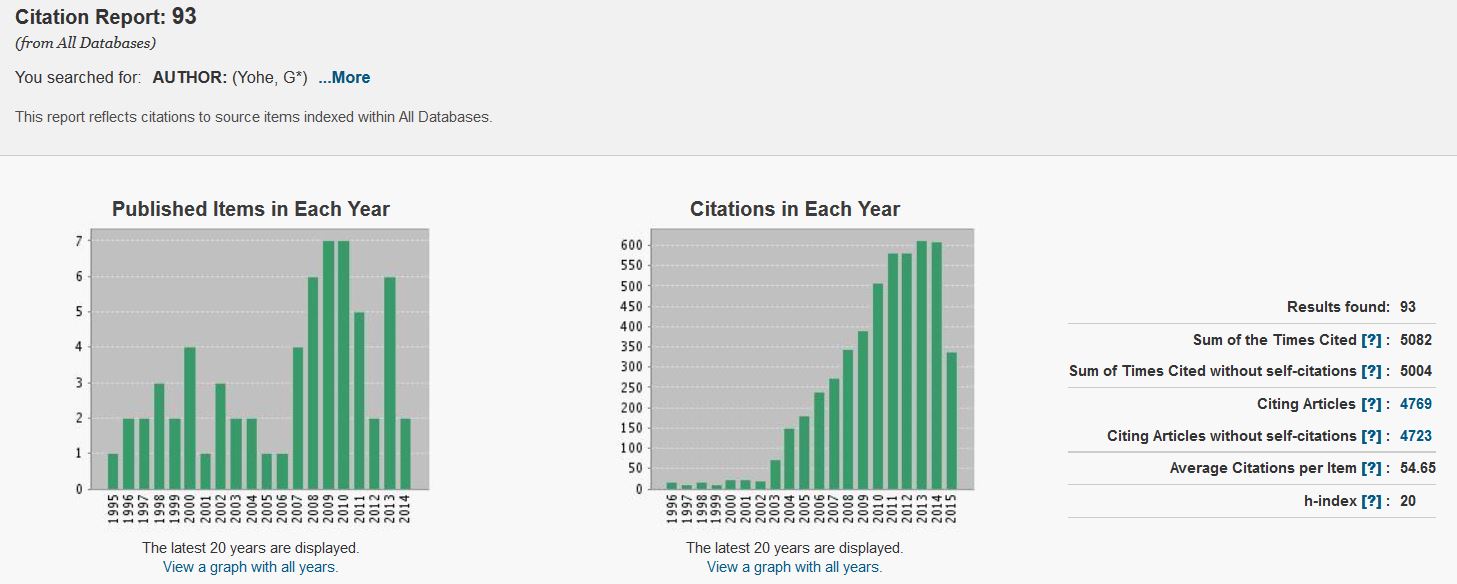
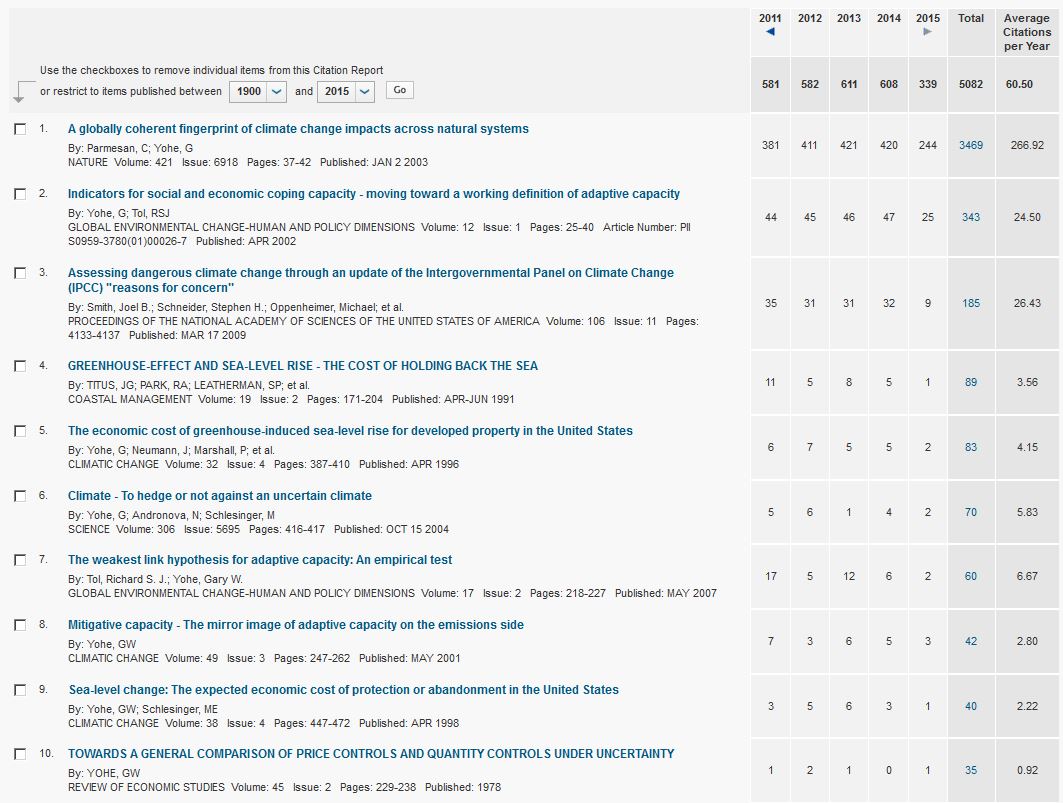
For comparison I also show a snapshot of the publication record of an economist who really studies the economics of climate change: Gary Yohe (Fig. 2) – to give readers unfamiliar with bibliometric data an idea of what they look like for a regular scientist at professorial level. One number illustrates the point: Lomborg’s papers were cited once last year, Yohe’s 608 times.
Figure 2 Gary Yohe’s citation record in Web of Science, as viewed on 27 Aug 2015. The ten most-cited papers (out of 93) are listed. Click to enlarge.
Lomborg’s public comments on sea-level rise
I study sea-level rise, and I first noticed Lomborg’s sea-level comments in October 2008, when he published an opinion piece in the Guardian (via Project Syndicate) in which he wrote:
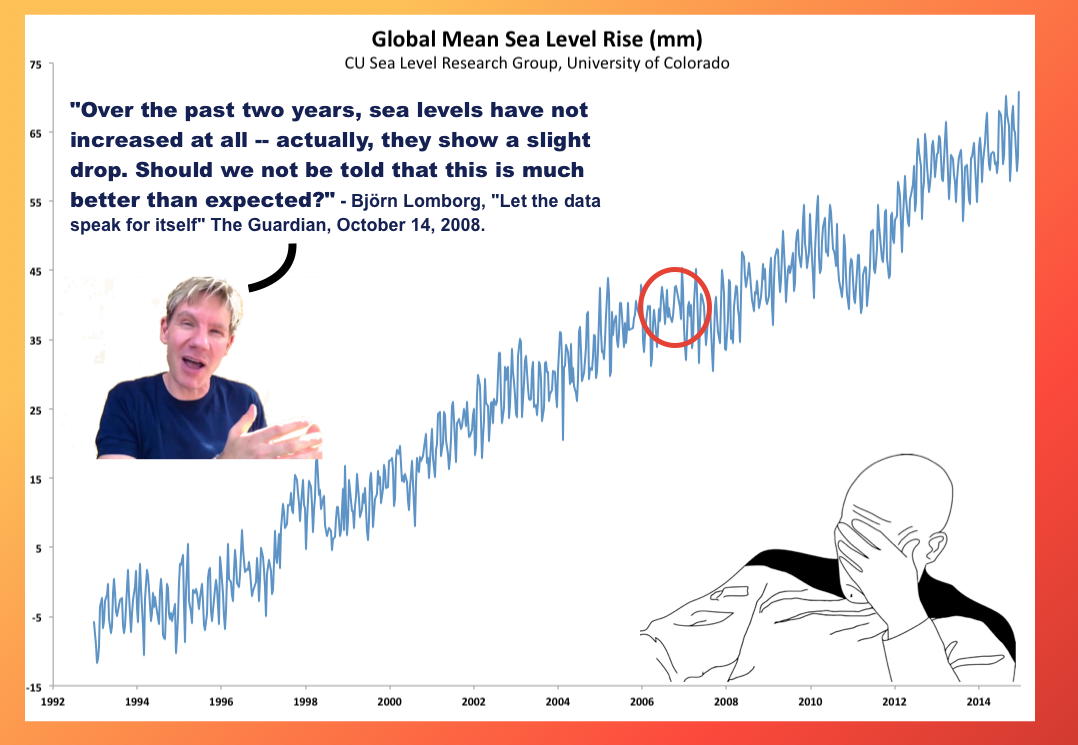
Since 1992, we have had satellites measuring the rise in global sea levels, and they have shown a stable increase of 3.2mm per year (1/8 of an inch) – spot on compared to the IPCC projection. Moreover, over the last two years, sea levels have not increased at all – actually, they show a slight drop. Should we not be told that this is much better than expected?
The first sentence is a debating trick frequently used by those wanting to downplay climate change: Lomborg compares the observed past rise with average projections for the future. However, in the projections sea level rise accelerates over time in response to global warming, so if the rate of rise is already now as high as models expect only in several decades, this is not “spot on”. When comparing like with like, i.e. the same time interval, it has been shown both in the journal Science and in the 4th IPCC report (published 2007) that the observed rate of rise greatly exceeded the projections available at the time of Lomborg’s writing. (In the 5th IPCC report the projections are about 60% higher than in the 4th and now do match past observations.)
Lomborg’s second sentence is also a classic debating trick of climate skeptics: confuse the public by cherry picking some short interlude which goes against the long-term trend (Fig. 3). This is always possible with noisy geophysical data.
Figure 3 The data behind Lomborg’s claim of falling sea level. Image courtesy of Greg Laden’s blog.
Ironically, the title of Lomborg’s article was “Let the data speak for itself”, but he did not show the data. (I did later in a response – for those wanting to read more on my exchange with Lomborg, see the Appendix below.)
Misrepresentation of IPCC reports
Lomborg has quite a history of misrepresenting what is written in IPCC reports. I noted this already in the Guardian exchange about the 4th IPCC report. Lomborg has likewise seriously misrepresented what IPCC says about sea level in its latest (5th) report. In a newspaper column for Project Syndicate, which got published in newspapers in many countries, he wrote:
For sea-level rise, the IPCC now includes modeling of glacier responses of 3-20 centimeters, leading to a higher total estimate of 40-62 cm by century’s end – much lower than the exaggerated and scary figure of 1-2 meters of sea-level rise that many environmental activists, and even some media outlets, bandy about.
Compare this to what the IPCC actually writes about sea level in its Summary for Policy Makers:
For RCP8.5, the rise by the year 2100 is 0.52 to 0.98 m.
(RCP8.5 is a scenario with unmitigated rise in greenhouse gas emissions.)
For the lowest emissions scenario RCP2.6 (which involves drastic emissions reductions starting in a few years and leading to zero global emissions by 2070) the best-estimate sea-level rise by the year 2100 given by IPCC is 44 cm. The emissions reductions needed to keep sea-level rise so moderate is the kind of scenario that Lomborg has devoted his career to prevent. Telling his readers that sea-level rise might just be 40 cm so they should not worry, without telling them that this low number would require massive mitigation efforts, is rather misleading.
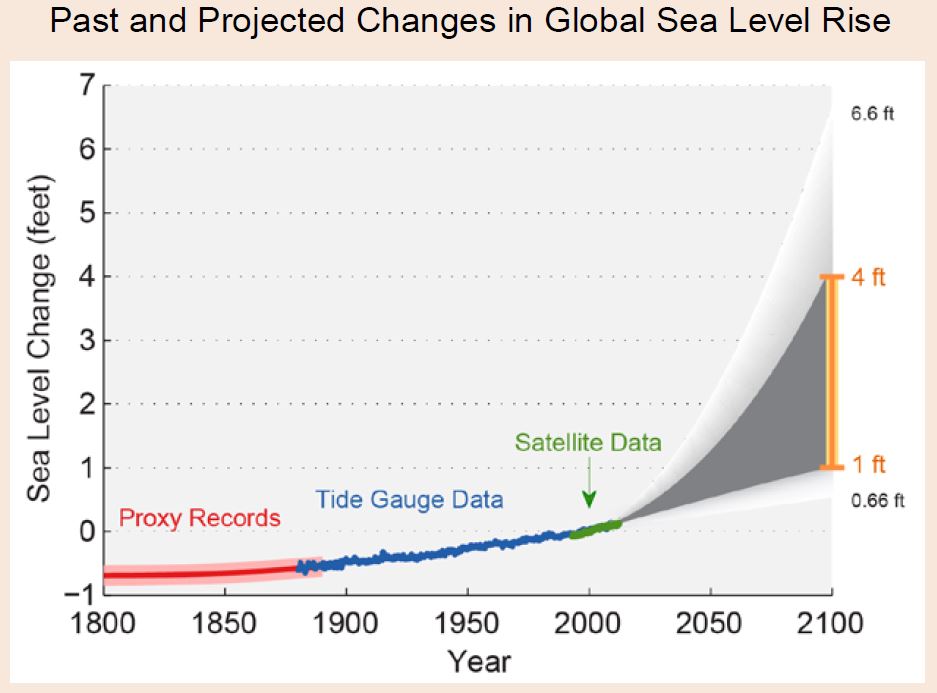
The risk of a rise of 1-2 meters is dismissed by Lomborg as “exaggerated” and “bandied about” by “environmental activists and even some media outlets”. But surely Lomborg knows that a large part of the sea-level expert community considers this a serious risk, as documented in a number of peer-reviewed scientific publications? The thoroughly peer-reviewed US National Climate Assessment, published some months before Lomborg’s newspaper article, summarizes the state of science on future sea level in the following graph (Fig. 4).
Figure 4 Sea level rise according to the US National Climate Assessment (2014). The high end scenario of 6.6 feet equals 2 meters of rise between the years 2000 and 2100.
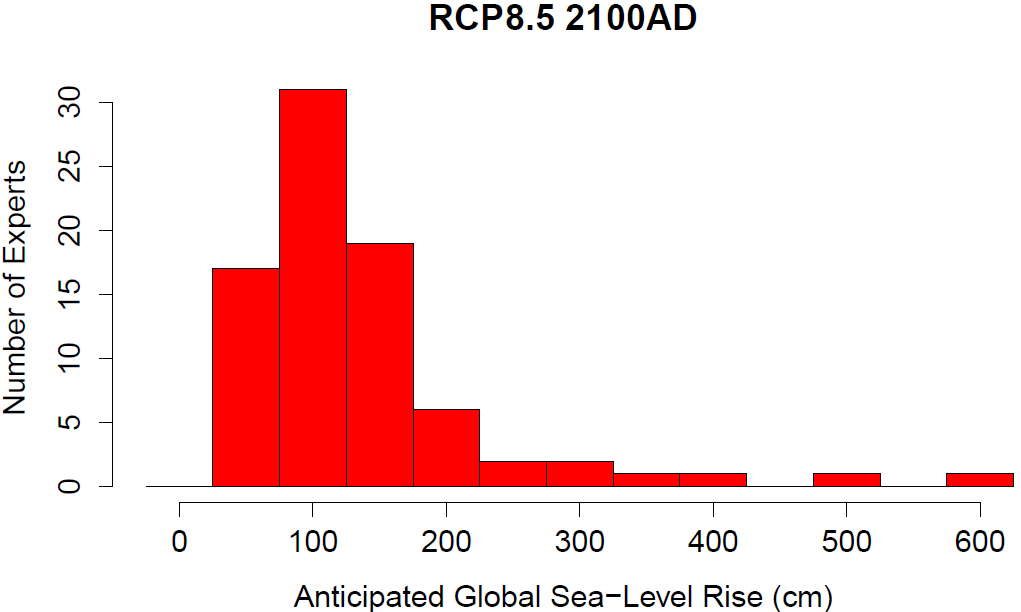
And an expert survey in which 90 sea-level experts (in contrast to Lomborg, all with a good track-record of research in this area) took part has come up with this distribution for the upper reaches of sea-level rise by 2100 (Fig. 5).
.
Figure 5 Distribution of the experts’ answers to the upper limit of the ‘likely’ range for the RCP8.5 scenario by the year 2100. Many experts consider a global sea-level rise between 1 and 2 meters quite possible in case of unmitigated greenhouse gas emissions.
Cynical misinformation offered to developing nations
Lomborg’s message to the newspaper readers has thus nothing to do with a fair portrayal of how much sea-level rise the scientific community expects. Rather it is a distortion and blatant attempt at downplaying future sea-level rise. Looking at Lomborg’s many other Project Syndicate columns shows that this is not a singular case but a regular pattern in his columns. This is all the more irresponsible given that Project Syndicate opinion pieces are widely reprinted by newspapers in developing nations, where reporting on the actual state of science is often poor and where people are most vulnerable to the impacts of climate change.
Earlier this year Lomborg travelled to Bangladesh to tell people there that “focusing on global warming instead of child nutrition is quite frankly almost immoral” (his standard false dichotomy). He further claimed:
The Dutch has shown us 200 years ago, you can handle sea level rise fairly, easily and cheaply, you can do the same thing here and you will do the same thing here.
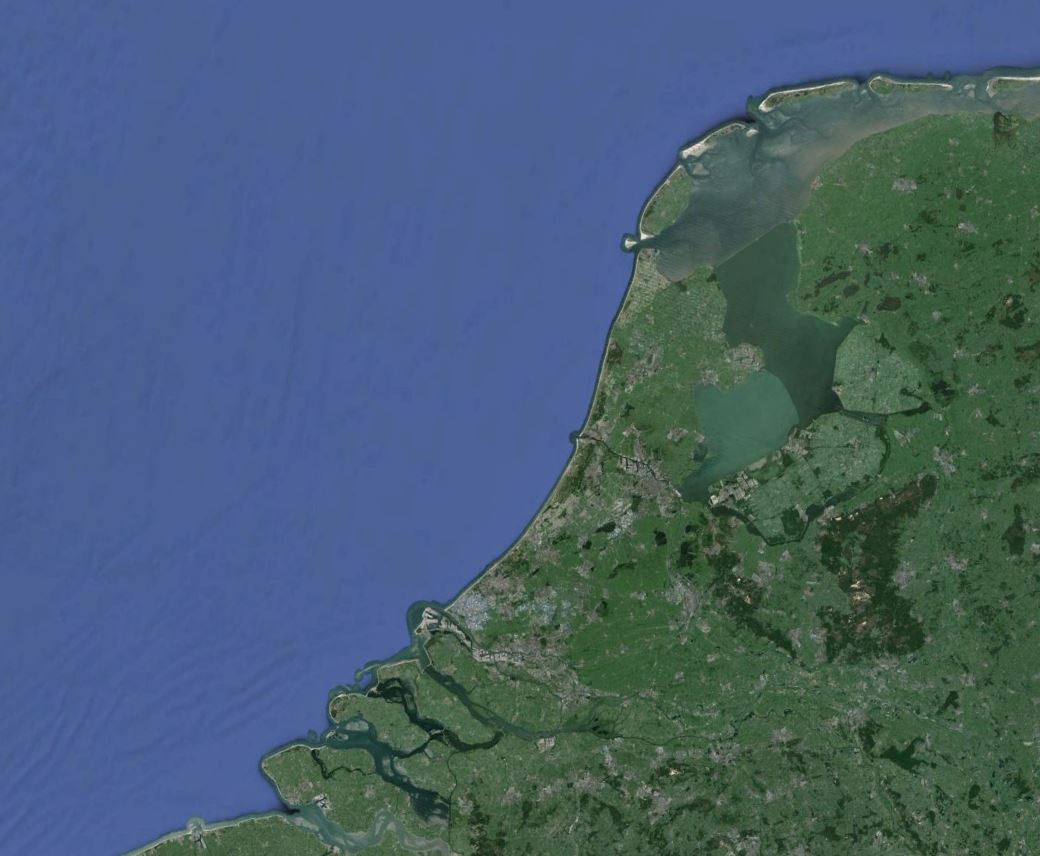
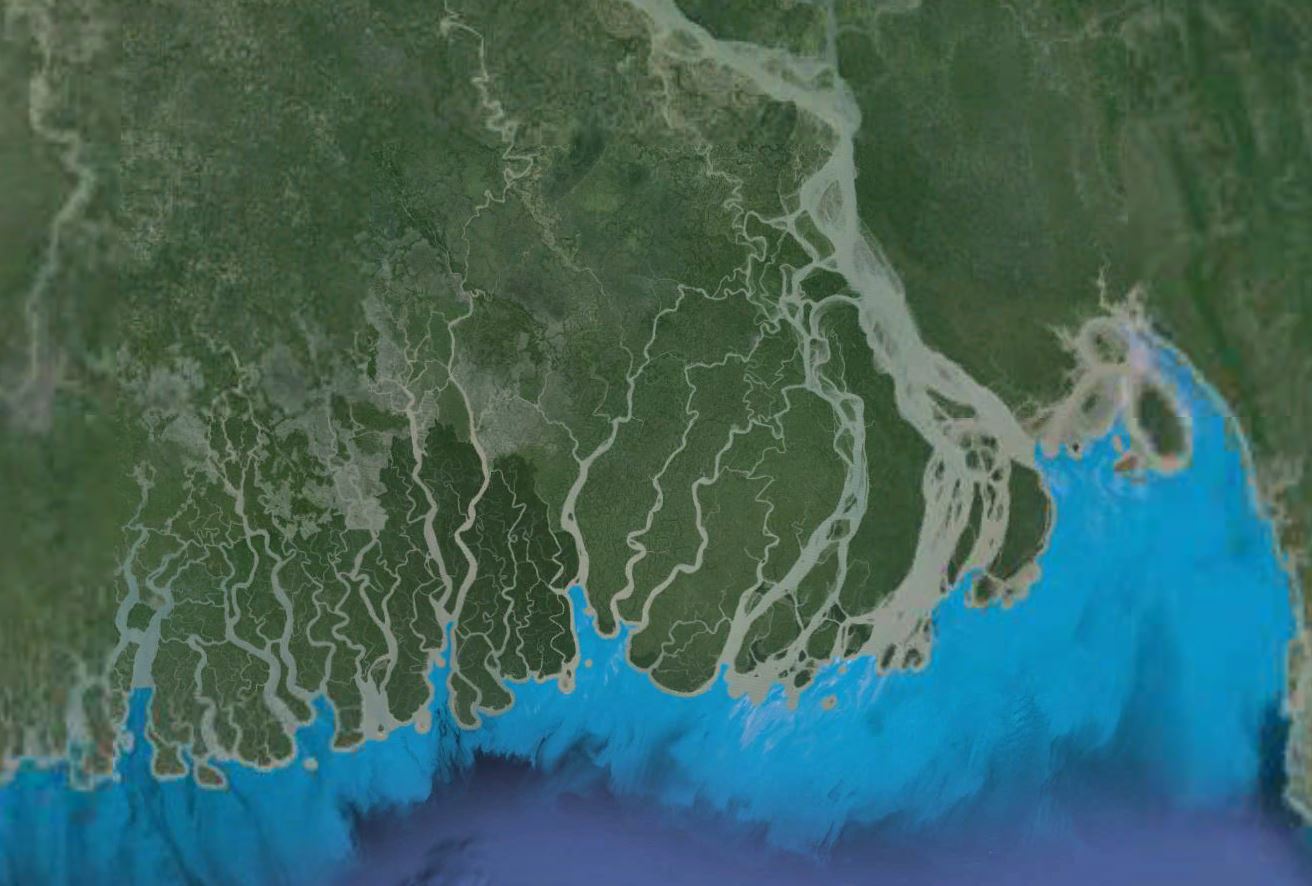
It only takes a look at Google Earth to see how preposterous the comparison of Holland and Bangladesh is (Fig. 6). The latter coastline is vastly more difficult to defend against rising seas, and unlike Holland it is in the path of tropical cyclones.
Figure 6 Coastlines of Holland (top) and Bangladesh at similar scale. Holland expects to spend 1.2 to 1.6 billion Euro (1.4 to 1.8 billion US$) per year until 2050 to upgrade its already well-established coastal defences – but it has a straight, easy-to-defend coastline with only a small river delta region. Bangladesh in contrast is largely a river flood plain with major problems draining the monsoonal waters to the sea (closing the coast with a huge dike is not an option) combined with storm surges from tropical cyclones. [See more in Appendix 2.]
Lomborg’s cynical attitude towards the victims of sea-level rise could hardly be better illustrated by another Project Syndicate op-ed he wrote. There he dismisses even a catastrophic 20-foot sea-level rise (6 meters – a plausible outcome of unmitigated global warming in a few centuries) which would inundate about 16,000 square miles of coastline where more than 400 million people currently live:
That’s a lot of people, to be sure, but hardly all of mankind. In fact, it amounts to less than 6% of the world’s population – which is to say that 94% of the population would not be inundated.
What a cavalier way to dismiss the plight of 400 million people, coming from a rich Dane who in 2012 received a salary of US$ 775.000 in the US via conservative foundations!
Conclusion
To answer the question posed in the title: No, I do not think Lomborg is a scientist who just happens to have a different opinion from the majority. First of all, there is very little indication that he is actually working as a scientist, given his near-zero scientific track record since his PhD work according to Thomson Reuters Web of Science. Second, the arguments he presents to the wider public on sea-level rise can hardly be seen as made in good faith – rather, they appear to me carefully crafted (and admittedly rather eloquent) distortions, aimed to deceive his lay audience about the seriousness of the threat. In short, I would consider much of Lomborg’s writing propaganda.
Ever since his “Skeptical Environmentalist” book Lomborg has a simple, single message: don’t worry about reducing fossil emissions. Whether he denies or plays down the seriousness of global warming, sings the praises of adaptation, advocates to prioritize other problems or pushes geoengineering, the message is always the same: anything is better than phasing out fossil fuels.
As seen by the lack of citations, this message has zero credibility or impact in the scientific community. After all, scientists can judge the merits of the arguments. Unfortunately, Lomborg’s propaganda message is not only popular with fossil fuel interests, but continues to get ample space in the media.
Appendix
I did not want to burden the main article with too much detail, so here is how my exchange with Lomborg in the Guardian went on. In response to my complaint about the cherry-pick, Lomborg wrote:
Rahmstorf is correct to note that the levels are no longer dropping — which they were from 2006 to early 2008, the data available at the time of my article — but curiously seems disinclined to explore why the rise over the past four years (2005-2008) has been half the previous rise at 1.6mm/year. The inescapable point is that sea levels are not escalating out of hand – if anything, they are doing the exact opposite right now.
To start with, the satellite data were freely available online in near real-time from 1992 at the time of Lomborg’s earlier article, so the distinction between long-term trend and short-term noise should have been evident to him – it is inconceivable to me that Lomborg could have so little understanding of statistics that he does not understand the role of noise in the data, so his claim that sea-level rise is slowing can’t be out of ignorance but must have been a deliberate attempt to mislead his lay audience. And the short blip that Lomborg focused on was already over when his article appeared.
In my reply to this in the Guardian I wrote:
Why does Lomborg cite the trend since 2005? Last October, he cited that of the previous two years. Why now four years? Because the trend of the past two years (2007-2008) is now + 3.7 mm/year? It is even worse. The trend since the beginning of any year of the data series varies between 1.6 mm/year and 9.0 mm/year, depending on the start year chosen. Using 2005, Lomborg cherry-picked the by far lowest. He’s done this before, see for example his recent claim that the globe is cooling.
It is worth rereading these Lomborg articles from back in 2008/2009 to realise how even more ridiculous they are today, in the light of the data that have been gathered since. Of course sea-level rise has not slowed down.
Another example is how Lomborg tries to tell his readers that the globe is actually cooling:
Temperatures in this decade have not been worse than expected; in fact, they have not even been increasing. They have actually decreased by between 0.01 and 0.1C per decade.
That was another disingenuous cherry-pick; we now know that the hottest years on record are 2014, 2010 and 2005, with the hottest 12-month period being the past 12 months.
Appendix 2 by Jonathan Gilligan [Added on 4 September, from Comment Nr. 57)
About defending the Bangladeshi coast: See L. Auerbach et al., “Flood risk of natural and embanked landscapes on the Ganges-Brahmaputra tidal delta plain,” Nature Climate Change 5, 153 (2015) (Disclosure: I am a co-author), F.K. Khadim et al., “Integrated Water Resources Management (IWRM) Impacts in South West Coastal Zone of Bangladesh and Fact-Finding on Tidal River Management (TRM)” J. Water Resource & Protect. 5, 953 (2013) and Atiur Rahman’s book, “Beel Dakatia: The Environmental Consequences of a Development Disaster” (University Press, 1995)
In the 1950s through the 1970s, following recommendations of the UN Krug Commission report, Bangladesh built a large network of more than 100 embankments, or “polders,” based on the Dutch model, for flood control in the coastal areas.
The engineers designing and implementing this project did not account for the vast geological differences between the Bengal delta and the Netherlands. In Bangladesh, these polders prevented the natural flow of sediment onto the land and caused accelerated subsidence that contributed roughly 10 times more to relative sea level rise in many parts of the delta over the last 50 years than eustatic sea level rise.
Thus, far from protecting the coast, these Dutch-style embankments increased problems of flooding, waterlogging, and vulnerability to catastrophic flooding when storm surges from cyclone Aila in 2009 destroyed several embankments, destroying the homes of tens of thousands of people much as Katrina did in the lower 9th Ward of New Orleans. And severe tropical cyclones hit Bangladesh an average of once every three years.
Ironically, a number of Bengali engineers warned, in the 1920s and 30s, that building such embankments to control floods would actually make flood risks worse for the reasons I give above.
Additional recent work by J. Pethick and J. Orford, “Rapid rise in Effective Sea-Level in southwest Bangladesh: Its causes and contemporary rates” Global Planetary Change 111, 237 (2013) showed that the embankments along the tidal channels of Bangladesh also caused tidal amplification, which further exacerbated relative sea-level rise.
There is some hope for Bangladesh because if the land is not mismanaged (for instance, if sediment flow is not blocked by poorly designed systems of embankments and sluice gates), natural sediment deposition can cause significant aggradation of the land surface, enough to completely keep up with moderate sea-level rise. See, e.g., CA Wilson and SL Goodbred, “Building a large, tide-influenced delta on the Bengal margin: Linking process, morphology, and stratigraphy in the Ganges-Brahmaputra delta system,” Annu. Rev. Marine Sci. 7, 67 (2015). See also, the extensive literature on “Tidal River Management,” such as Khadim et al. (2013).
However, even the billion tons a year of sediment carried by the Ganges-Brahmaputra-Meghna river system is likely insufficient to keep pace with the kind of accelerated eustatic sea-level rise we expect in coming decades if the world continues to follow an RCP 8.5-like emissions trajectory.
Lomborg’s poorly informed recommendations to Bangladesh and his ignorance of the disastrous consequences of Bangladesh’s past attempt to emulate Holland exemplify Santayana’s warning that those who do not remember the past are doomed to repeat it.
Weblink
Danish biologist Kåre Fog has a good summary on his Lomborg Errors website of how Lomborg has shifted his position continuously over time, from denying global warming is a problem to wanting to fix it with drastic geoengineering measures. The website has extensive documentation of Lomborg’s errors. Fog concludes about Lomborg: “He does precisely what the fossil fuel industry would want a PR agent to do”.
“Defining motivations for others is an error… This small part of Dan H’s contention stands.”
Please remember, the point of a scientific paper is to communicate, so ‘defining motivations’–a poor way of putting it, if you ask me, since it’s not so much about motivations as about the scope of the problem–is not exactly a question of mind-reading.
I have read the presentation, and looked at the figures. It’s a very clear inference, and I don’t believe I’m in error here.
The other papers have a wider scope, citing other sources besides Gille for other parts of the overall problem.
“Personally, I’d say 30-60 degrees is sidebar. 60-90 degrees sounds like the main course.”
You may want to consult a map on that. 60 degrees get you well into the Antarctic Circumpolar Current. ~66 degrees–the Antarctic Circle–gets you the East Antarctic coastline, plus a couple of hundred km of the Antarctic Peninsula. By the time you get to 75, you’ve got mostly land, with just chunks of the Ross and Weddell Seas. That’s why Gille is cited by the other papers, despite the limitations of the data.
http://www.mapsofworld.com/lat_long/antarctica-lat-long.html
On what continues to be a scientifically interesting question, I’d note that AR5 also says the Southern Ocean is warming; as we know, that’s generally the most comprehensive synthesis available. (Chap. 3, IIRC, but it’s pretty readily searched.) And another more recent paper, Durack et al., 2014, concluded that SO warming had probably been underestimated:
http://www.sciencedaily.com/releases/2014/10/141006094511.htm
“I fail to see how the Maheshwari does not say what I claim, when I took a direct quote from their results.”
– See more at: https://www.realclimate.org/index.php/archives/2015/08/bjorn-lomborg-just-a-scientist-with-a-different-opinion/comment-page-4/#comments
I’m not referring to any direct quote you may have taken–I put it that way, because I didn’t find any ‘quote’ from their results, just a link to their paper. I was referring rather to the conclusion you expressed that there’s no warming in SSTs south of 60. How did you put it? Let me look–
#191: “While the South Atlantic, South Pacific, and Indian oceans have shown warming trends (along with the global oceans as a whole), the Southern Ocean (south of 60 degrees S) has not.”
#165: “While there have been multiple publications concerning the southern ocean, few have shown warming, except for your link. One has to ask why you would make the rather biased claim that the southern ocean has warmed…”
On the other hand, while the SST trend for the entire Southern Ocean is weakly cooling, per Maheshwari’s figure 4–here it is again, for convenience:
http://www.hindawi.com/journals/isrn/2013/392632/fig4/
–there are very considerable areas of warming trends, some of which clearly have the potential for interaction with ice shelves, notably the West Antarctic coast, but also possibly–it’s hard to disentangle the fine scale features on the map–the area in East Antarctica containing Totten Glacier. (Actually, insofar as I can tell, most of the continental coastline seems to be showing a weak warming trend.)
IMO, it’s probably a bit of a sideshow to the warming at depth that we’ve been talking about, but you asked in what respect I disagreed with you about what Maheshwari is saying. I took you to be saying that there was no warming in the Southern Ocean south of 60. As I said above, I find that a misleading formulation, since Maheshwari is very clear that there are areas of both warming and cooling right down to the Antarctic coast. After all, the context of this discussion was whether or not there are warming trends that could relate to the melt trends we observe for Totten, so it’s much more germane what trends there are, than what the trend averaged over the entire Southern Ocean may be.
Revisit the quote Dan H. posted. You’ll see they’re referring to sea surface temperatures.
Dan H.: ““a slightly negative (i.e., cooling) trend in average temperature anomaly over the entire region is obtained. However, this trend is very weak and found to be statistically insignificant.””
The paper: “… statistically significant positive/negative trends in the variability of interannual average SST. However, in general, the Southern Ocean as a whole is showing a weak interannual cooling trend in SST.”
Kevin McKinney:You may want to consult a map on that. 60 degrees get you well into the Antarctic Circumpolar Current. ~66 degrees–the Antarctic Circle–gets you the East Antarctic coastline, plus a couple of hundred km of the Antarctic Peninsula. By the time you get to 75, you’ve got mostly land, with just chunks of the Ross and Weddell Seas.
RC: Yes, by the time you get to 75. you’re at the EXACT CENTER of what you’re looking for, the sea/land interface. Why would you be interested in not-75 degrees?
Ray Ladbury and others,
I’m glad to see others are perplexed by this as well.It’s hard to imagine Lomborg does not know the risk. He has considerably more background than I and I think the argument for global warming is decisive. There is no other explanation for the correspondence between co2 levels in the paleo-record and global temperature. This combined with a mechanism, the demonstrable absorbtion of long wave radiation by co2, is decisive. So I have a hard time thinking of Lomborg as a dumb kid crossing in front of my car. If he’s being paid, he’s being paid to lie, which is like being offered a lollypop and made to jump off a cliff. But liars are not merely mistaken. Liars know they lie.