Last week there was an international media debate on climate data which appeared to be rather surreal to me. It was claimed that the global temperature data had so far shown a “hiatus” of global warming from 1998-2012, which was now suddenly gone after a data correction. So what happened?
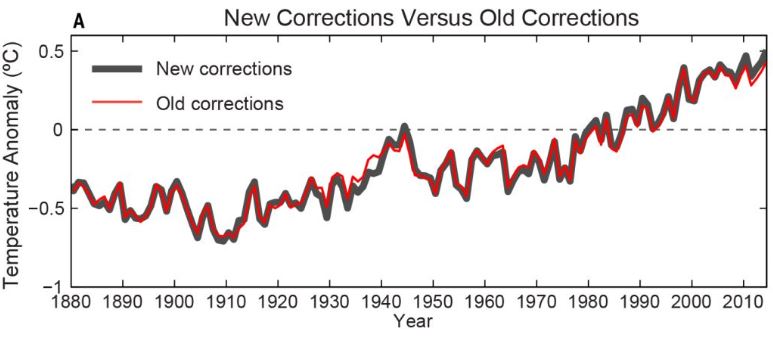
One of the data centers that compile the data on global surface temperatures – NOAA – reported in the journal Science on an update of their data. Some artifacts due to changed measurement methods (especially for sea surface temperatures) were corrected and additional data of previously not included weather stations were added. All data centers are continually working to improve their database and they therefore occasionally present version updates of their global series (NASA data are currently at version 3, the British Hadley Centre data at version 4). There is nothing unusual about this, and the corrections are in the range of a few hundredths of a degree – see Figure 1. This really is just about fine details.
Fig. 1 The NOAA data of global mean temperature (annual values) in the old version (red) and the new version (black). From Karl et al., Science 2015
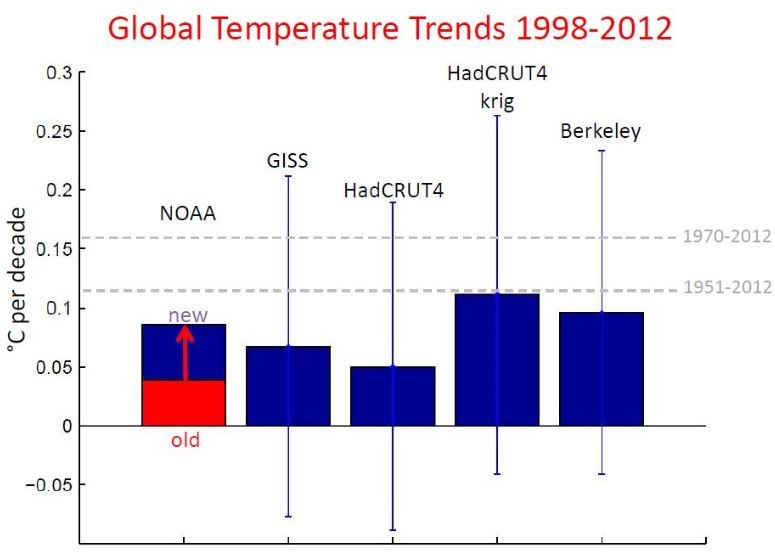
What got some people excited was the fact that the latest corrections more than doubled the trend over 1998-2012 in the NOAA data, which basically just illustrates that trends over such short periods are not particularly robust – we have often warned about this here. I was not surprised by this correction, given the NOAA data were known for showing the smallest warming trends recently of all the usual global temperature series. After the new update, the NOAA data are now in the middle of the other records (see Fig. 2). This does not change anything for any relevant finding of climate research.
Fig. 2 Linear trends in global temperature over the period 1998 to 2012 in the records of various institutions. To calculate the values and uncertainties (±2 standard deviations) the interactive trend calculation tool of Kevin Cowtan (University of York) was used; follow this link for more info on the data sources. The red bar on the left shows the old NOAA value, the blue bar the new one.
In addition, the entire adjustment and the differences between the data sets are well within the uncertainty bars (also shown in Fig. 2). These uncertainties reflect the fluctuations from year to year, caused by weather and things like the El Niño phenomenon – these make the data “noisy”, so that a trend analysis over short time intervals is quite uncertain and significantly depends on the choice of the beginning and end years. The period 1998-2012 is a period with a particularly low trend, since it begins with the extremely warm year 1998, which was marked by the strongest El Niño since the beginning of the observations, and ends with a couple of relatively cool years.
Some media reports even gave the impression that the IPCC had confirmed a “hiatus” of global warming in its latest report of 2013, and that this conclusion was now overturned. Indeed the new paper by Karl et al. was framed around the period 1998-2012, because this period was specifically addressed in the IPCC report. However, the IPCC wrote the following (Summary for Policy Makers, p.5):
Due to natural variability, trends based on short records are very sensitive to the beginning and end dates and do not in general reflect long-term climate trends. As one example, the rate of warming over the past 15 years (1998 – 2012; 0.05 [-0.05 to 0.15] °C per decade), which begins with a strong El Niño, is smaller than the rate calculated since 1951 (1951- 2012; 0.12 [0.08 to 0.14] °C per decade).
The IPCC thus specifically pointed out that the lower warming trend from 1998-2012 is not an indication of a significant change in climatic warming trend, but rather an expression of short-term natural fluctuations. Note also the uncertainty margins indicated by the IPCC.
Imagine that in some field of research, there is some quantity for which there are five different measurements from different research teams, which show some spread but which agree within the stated uncertainty bounds. Now one team makes a small correction (small compared to this uncertainty), so that its new value no longer is the lowest of the five teams but is right in the middle. In what area of research is it conceivable that this is not just worth a footnote, but a Science paper and global media reports?
I have often pointed out that the whole discussion about the alleged “warming hiatus” is one about the “noise” and not a significant signal. It is entirely within the range of data uncertainty and short-term variability. It is true that the saying goes “one man’s noise is another man’s signal”, and to better understand this “noise” of natural variability is a worthwhile research topic. But somehow, looking at the media reports, I do not think that the general public understands that this is only about climatic “noise” and not about any trend change relevant for climate policy.
Technical Note: For calculation of trends (as far as they do not come from the paper by Karl et al.) I have used the online interactive trend calculation tool of Kevin Cowtan. In their paper Karl et al. provide (as the IPCC) 90% confidence intervals, while Cowtan gives the more common 2-sigma intervals (which for a normal distribution comprise 95% of the values, and thus are wider). In addition, Karl et al computed annual averages of the monthly data before further analysis, while Cowtan calculates trends and uncertainties straight from the monthly data (which I think is cleaner). To avoid showing inconsistent confidence intervals (and since the new data by Karl et al. are not yet available as a monthly data) I have not included intervals for the NOAA data in Fig. 2. In any case, the intervals are similar in size for all records if they are calculated consistently. The long-term trends shown in gray dashed lines hardly differ between the datasets and have very narrow confidence intervals (± 0.02 °C per decade for 1951 to 2014).
Links
RealClimate: NOAA temperature record updates and the ‘hiatus’
RealClimate: Recent global warming trends: significant or paused or what?


BPL,
Of course. Using the timeframe from 1979-1998 to achieve the highest possible trend or that from 2002-present to achieve the lowest constitutes cherry-picking. Using the entire database is best (Some consider data before 1880 to be suspect, but I will not quibble over those extra 15 years.) When examining the entire database, we do need to ask ourselves if the trend over the years has changed. Obviously there have been short-term changes, but is it just noise?
Something the deniers say that troubles me is that the first 1 W/m^2 of forcing results in a temperature of about 65K for a sensitivity of 65C per W/m^2 and that the Stefan-Boltzmann Law requires more forcing as the temperature increases, thus the sensitivity must decrease as the temperature increases.
The problem is that when I plot the sensitivity as a function of temperature starting at 65C per W/m^2 for the first W/m^2 ending at 0.8C per W/m^2 forcing at 239 W/m^2 (the total forcing from the Sun at the defined sensitivity) and integrate across all 239 W/m^2 of forcing, the surface temperature I end up with is higher than the boiling point of water. I simply can not find any reasonable function for the sensitivity as a function of temperature that produces the correct temperature based on the constraints on the sensitivity.
My question is what is the sensitivity as a function of temperature? I haven’t been able to find this in any of the literature.
> Michael Fitzgerald
Does this help?
[extra para. breaks added for online readability – hr]
Not really. It only says that according to palaeoclimate data any temperature dependence of the sensitivity is inconclusive. It’s already known that the sensitivity increases with decreasing temperatures as GHG effects are larger in colder climates than in warmer ones. My question is what is this function?
Michael
@Michael Fitzgerald
I would suggest
“Climate sensitivity, sea level and atmospheric carbon dioxide”
James Hansen, Makiko Sato, Gary Russell, Pushker Kharecha
http://rsta.royalsocietypublishing.org/content/371/2001/20120294
#52–Rushing in, perhaps not where angels fear to tread, but where I at least probably ought to–some questions/comments.
1) The ‘denier’s claim’ that you quote seems completely underspecified. Clearly, one can imagine very different responses from different physical systems subjected to a 1 W/m^2 forcing. So, what are the posited initial conditions? Temperature is crucial here, since that’s the essence of Stefan-Boltzmann.
2) A related question would be, what exactly does “first 1 W/m^2 of forcing” mean/imply? I find that a confusing formulation–the ‘initial forcing’ could presumably be any value at all. Is it implicit that this involves comparing different forcings? Or does it imply that the ‘starting temperature’ for that ‘first forcing’ is absolute zero? (In that case, the radiative forcing is clearly not from greenhouse gases!)
3) “Sensitivity” seems to be used in different ways here, increasing the confusion. Normally, the term is short for ‘climate sensitivity’, which is defined as sensitivity to a doubling of CO2. There’s a well-known equation which multiplies climate sensitivity (usually symbolized by lambda) by radiative forcing in order to estimate the surface temperature response, thus:
Delta T_s =lambda*Delta F
However, I get the feeling that Stefan-Boltzmann is being used to calculate Delta T_s? In that case, terms are perhaps being treated equivalently based on a compatibility of units, despite quite different presumed conditions.
IOW, you may have apples mixed in with your oranges. That could very well have a lot to do with your nonsensical result.
As someone who has followed this debate for a long, long time, but not been forced to wallow in the middle of it, the main points seem to me to be:
About the science:
1) It has long been known that increasing CO2 should cause warming.
2) There is increasing CO2.
3) We see warming.
4) There is no explanation for the warming that does not include increasing CO2.
5) There is every reason to think that increasing CO2 is causing warming.
There is also a need to explain what we hear:
a) It has long been known that propaganda can affect beliefs, regardless of actual evidence.
b) The trillion-dollar fossil-fuel industry has spent money on propaganda to persuade people that the implications of facts (1–4) above are not real.
c) Many people believe that the implications of facts (1–4) above are not real.
d) There is no good reason to think that these widespread beliefs are based on evidence.
This is all obvious and elementary, but that’s the point. Now, back to propaganda-driven nit-picking…
The detail in this blopost is excellent, and I absolutely agree with the discussion of the signal vs the noise, but there is one general point that has not been stated that is worth recalling.
A hiatus in the rise of average surface temperature (real or supposed) should not be confused with a hiatus in global warming, and should never have been discussed as such. It’s important in such discussions to mention that GW is measured in a number of different ways, including the monitoring of temperature of the deep ocean and of the melting of land ice at the poles, (neither of which have shown any sign of slowing). To allow an apparent slowdown in the rise of surface temperatures to be labelled as a ‘hiatus in GW’ was terribly misleading in the first place…