Recently a group of researchers from Harvard and Oregon State University has published the first global temperature reconstruction for the last 11,000 years – that’s the whole Holocene (Marcott et al. 2013). The results are striking and worthy of further discussion, after the authors have already commented on their results in this blog.
A while ago, I discussed here the new, comprehensive climate reconstruction from the PAGES 2k project for the past 2000 years. But what came before that? Does the long-term cooling trend that ruled most of the last two millennia reach even further back into the past?
Over the last decades, numerous researchers have painstakingly collected, analyzed, dated, and calibrated many data series that allow us to reconstruct climate before the age of direct measurements. Such data come e.g. from sediment drilling in the deep sea, from corals, ice cores and other sources. Shaun Marcott and colleagues for the first time assembled 73 such data sets from around the world into a global temperature reconstruction for the Holocene, published in Science. Or strictly speaking, many such reconstructions: they have tried about twenty different averaging methods and also carried out 1,000 Monte Carlo simulations with random errors added to the dating of the individual data series to demonstrate the robustness of their results.
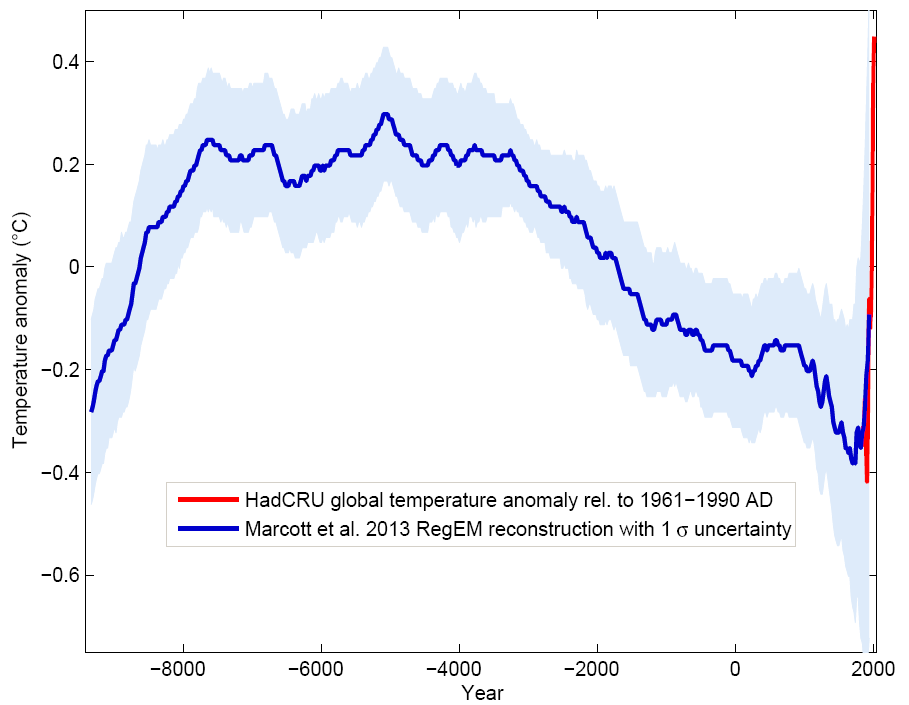
To show the main result straight away, it looks like this:
Figure 1 Blue curve: Global temperature reconstruction from proxy data of Marcott et al, Science 2013. Shown here is the RegEM version – significant differences between the variants with different averaging methods arise only towards the end, where the number of proxy series decreases. This does not matter since the recent temperature evolution is well known from instrumental measurements, shown in red (global temperature from the instrumental HadCRU data). Graph: Klaus Bitterman.
The climate curve looks like a “hump”. At the beginning of the Holocene – after the end of the last Ice Age – global temperature increased, and subsequently it decreased again by 0.7 ° C over the past 5000 years. The well-known transition from the relatively warm Medieval into the “little ice age” turns out to be part of a much longer-term cooling, which ended abruptly with the rapid warming of the 20th Century. Within a hundred years, the cooling of the previous 5000 years was undone. (One result of this is, for example, that the famous iceman ‘Ötzi’, who disappeared under ice 5000 years ago, reappeared in 1991.)
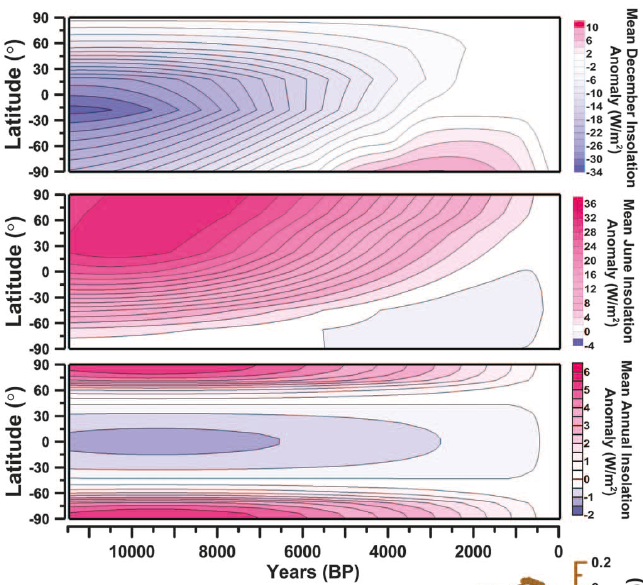
The shape of the curve is probably not surprising to climate scientists as it fits with the forcing due to orbital cycles. Marcott et al. illustrate the orbital forcing with this graphic:
Figure 2 Changes in incoming solar radiation as a function of latitude in December, January and annual average, due to the astronomical Milankovitch cycles (known as orbital forcing). Source: Marcott et al., 2013.
In the bottom panel we see the sunlight averaged over the year, as it depends on time and latitude. It declined strongly in the mid to high latitudes over the Holocene, but increased slightly in the tropics. In the Marcott reconstruction the global temperature curve is dominated primarily by the large temperature changes in northern latitudes (30-90 °N). For this, the middle panel is particularly relevant: the summer maximum of the incoming radiation. That reduces massively during the Holocene – by more than 30 watts per square meter. (For comparison: the anthropogenic carbon dioxide in the atmosphere produces a radiative forcing of about 2 watts per square meter – albeit globally and throughout the year.) The climate system is particularly sensitive to this summer insolation, because it is amplified by the snow- and ice-albedo feedback. That is why in the Milanković theory summer insolation is the determining factor for the ice age cycles – the strong radiation maximum at the beginning of the Holocene is the reason why the ice masses of the last Ice Age disappeared.
However a puzzle remains: climate models don’t seem to get this cooling trend over the last 5,000 years. Maybe they are underestimating the feedbacks that amplify the northern orbital forcing shown in Fig. 2. Or maybe the proxy data do not properly represent the annual mean temperature but have a summer bias – as Fig. 2 shows, it is in summer that the solar radiation has declined so strongly since the mid-Holocene. As Gavin has just explained very nicely: a model-data mismatch is an opportunity to learn something new, but it takes work to find out what it is.
Comparison with the PAGES 2k reconstruction
The data used by Marcott et al. are different from those of the PAGES 2k project (which used land data only) mainly in that they come to 80% from deep-sea sediments. Sediments reach further back in time (far further than just through the Holocene – but that’s another story). Unlike tree-ring data, which are mainly suitable for the last two thousand years and rarely reach further. However, the sediment data have poorer time resolution and do not extend right up to the present, because the surface of the sediment is disturbed when the sediment core is taken. The methods of temperature reconstruction are very different from those used with the land data. For example, in sediment data the concentration of oxygen isotopes or the ratio of magnesium to calcium in the calcite shells of microscopic plankton are used, both of which show a good correlation with the water temperature. Thus each sediment core can be individually calibrated to obtain a temperature time series for each location.
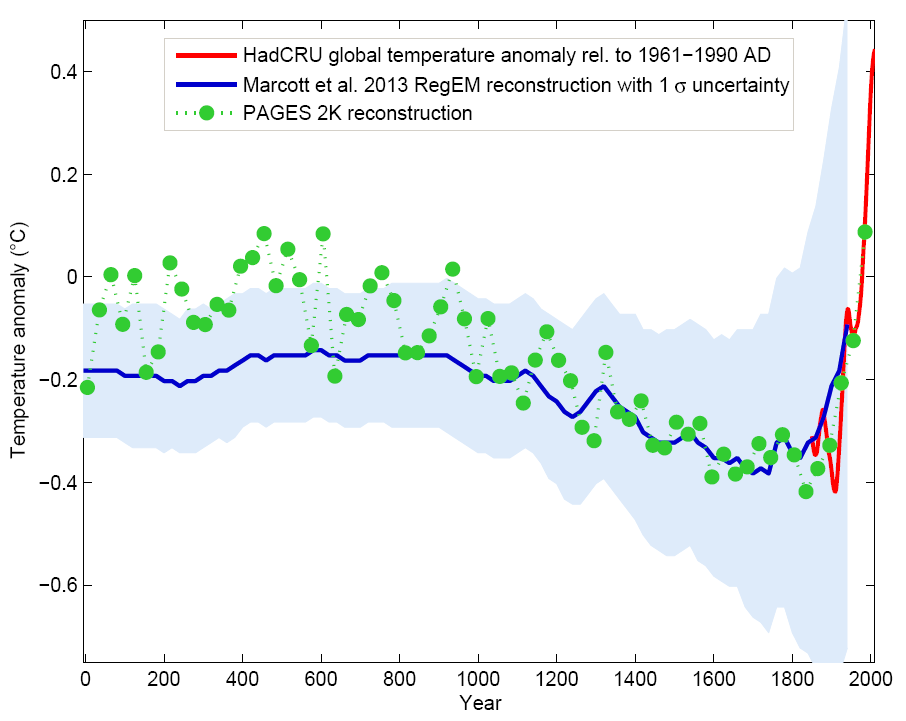
Overall, the new Marcott reconstruction is largely independent of, and nicely complementary to, the PAGES 2k reconstruction: ocean instead of land, completely different methodology. Therefore, a comparison between the two is interesting:
Figure 3 The last two thousand years from Figure 1, in comparison to the PAGES 2k reconstruction (green), which was recently described here in detail. Graph: Klaus Bitterman.
As we can see, both reconstruction methods give consistent results. That the evolution of the last one thousand years is virtually identical is, by the way, yet another confirmation of the “hockey stick” by Mann et al. 1999, which is practically identical as well (see graph in my PAGES article).
Is the modern warming unique?
Because of the above-mentioned limitations of sediment cores, the new reconstruction does not reach the present but only goes to 1940, and the number of data curves used already strongly declines before that. (Hence we see the uncertainty range getting wider towards the end and the reconstructions with different averaging methods diverge there – we here show the RegEM method because it deals best with the decreasing data coverage. For a detailed analysis see the article by statistician Grant Foster.) The warming of the 20th Century can only be seen partially – but this is not serious, because this warming is very well documented by weather stations anyway. There can be no doubt about the climatic warming during the 20th Century.
There is a degree of flexibility on how the proxy data (blue) should be joined with the thermometer data (red) – here I’ve done this so that for the period 1000 to 1940 AD the average temperature of the Marcott curve and the PAGES 2k reconstruction are equal. I think this is better than the choice of Marcott et al. (whose paper was published before PAGES 2k) – but this is not important. The relative positioning of the curves makes a difference for whether the temperatures are slightly higher at the end than ever before in the Holocene, or only (as Marcott et al write) higher than during 85% of the Holocene. Let us just say they are roughly as high as during the Holocene optimum: maybe slightly cooler, maybe slightly warmer. This is not critical.
The important point is that the rapid rise in the 20th Century is unique throughout the Holocene. Whether this really is true has been intensively discussed in the blogs after the publication of the Marcott paper. Because the proxy data have only a coarse time resolution – would they have shown it if there had been a similarly rapid warming earlier in the Holocene?
I think for three reasons it is extremely likely that there was not such a rapid warming before:
1. There are a number of high-resolution proxy data series over the Holocene, none of which suggest that there was a previous warming spike as strong as in the 20th Century. Had there been such a global warming before, it would very likely have registered clearly in some of these data series, even if it didn’t show up in the averaged Marcott curve.
2. Grant Foster performed the test and hid some “20th C style” heating spikes in earlier parts of the proxy data to see whether they are revealed by the method of Marcott et al – the answer is a resounding yes, they would show up (albeit attenuated) in the averaged curve, see his article if you are interested in the details. [Update 18 Sept: one of our readers has confirmed this conclusion with a different method (Fourier filtering). Thanks!]
3. Such heating must have a physical basis, and it would have to have quickly disappeared again (would it have lasted, it would be even more evident in the proxy data). There is no evidence in the forcing data that such a climate forcing could have suddenly appeared and disappeared, and I cannot imagine what could have been the mechanism. (A CO2-induced warming would persist until the CO2 concentration decays again over thousands of years – and of course we have good data on the concentration of CO2 and other greenhouse gases for the whole Holocene.)
Conclusion
The curve (or better curves) of Marcott et al. will not be the last word on the global temperature history during the Holocene; like Mann et al. in 1998 it is the opening of the scientific discussion. There will certainly be alternative proposals, and here and there some corrections and improvements. However, I believe that (as was the case with Mann et al. for the last millennium) the basic shape will turn out to be robust: a relatively smooth curve with slow cooling trend lasting millennia from the Holocene optimum to the “little ice age”, mainly driven by the orbital cycles. At the end this cooling trend is abruptly reversed by the modern anthropogenic warming.
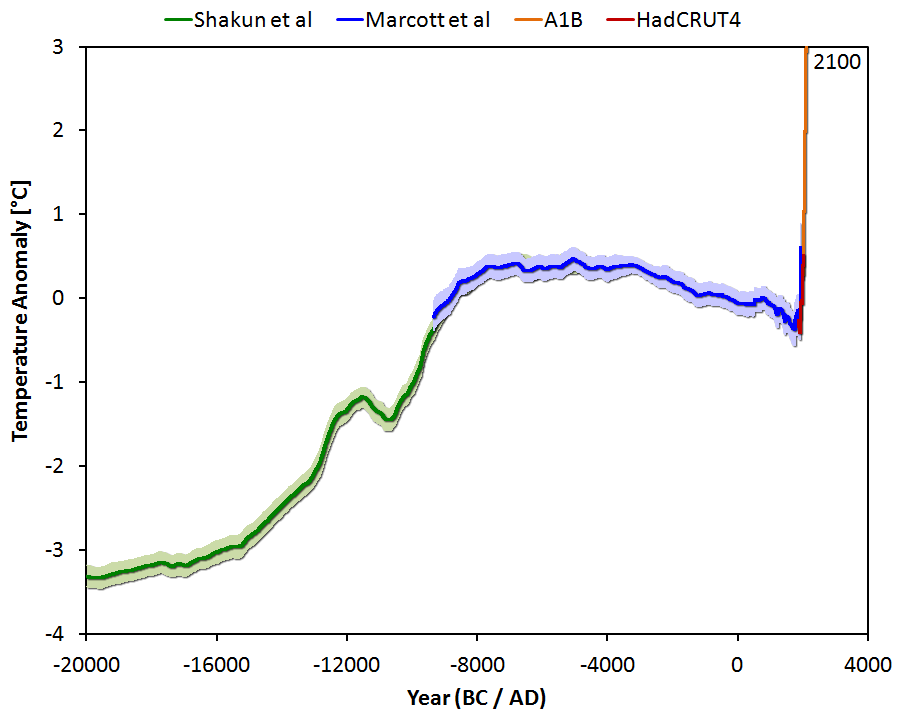
The following graph shows the Marcott reconstruction complemented by some context: the warming at the end of the last Ice Age (which 20,000 years ago reached its peak) and a medium projection for the expected warming in the 21st Century if humanity does not quickly reduce greenhouse gas emissions.
Figure 4 Global temperature variation since the last ice age 20,000 years ago, extended until 2100 for a medium emissions scenario with about 3 degrees of global warming. Graph: Jos Hagelaars.
Marcott et al. dryly state about this future prospect:
By 2100, global average temperatures will probably be 5 to 12 standard deviations above the Holocene temperature mean.
In other words: We are catapulting ourselves way out of the Holocene.
Just looking at the known drivers (climate forcings) and the actual temperature history shows it directly, without need for a climate model: without the increase in greenhouse gases caused by humans, the slow cooling trend would have continued. Thus virtually the entire warming of the 20th Century is due to man. This May, for the first time in at least a million years, the concentration of carbon dioxide in our atmosphere has exceeded the threshold of 400 ppm. If we do not stop this trend very soon, we will not recognize our Earth by the end of this century.


48 John L quotes Science, “Many researchers are excited about the nascent project, but others worry it could divert resources from existing collaborations.”
I would think that we could build a new model that would make other models a lot less useful. The higher resolution alone would put it in a whole new league. Even if we had to de-fund an effort or two, at first glance it seems worth it to me.
pete best @50.
The 550 billion tons is tons carbon (GtC) and includes land use emissions. Without land use it is 365 GtC 1750-2010, according to this CDIAC data with the 2010 emissions figure of 9.167 GtC (excluding land use) = 33.6 GtCO2.
Modeling anything over the century is bound to be uncertain. See this recent NY Times article on population trend.
http://www.nytimes.com/interactive/2013/09/20/business/World-Population-Could-Peak-by-2055.html?ref=business
The greatest uncertainity is Africa, where population growth is perhaps the greatest welfare issue.
Like global warming, not much is being done about population growth (China is the exception). That is also true of other major problems looming on the horizon, like drug-resistant microbes and government debt.
The policy problem is to persuade countries not to downplay such trends because of the uncertainties, and to focus on likely “bad case” scenarios. But such policy making is seldom done, so it should be no surprise that few governments have been persuaded to deal with global warming.
It is instructive to look at cases where long-term planning to prevent disasters has worked, at least so far – such a restraining the use of nuclear weapons and international economic systems. Both are based on concrete horrible events. The use of atom bonds in Japan, of course. The failure to establish a workable economic/political system after WWI led to WWII, and forced governments to accede to international regulations, such as the Bretton Woods agrements.
So it’s unrealistic to think that governments will address global warning without definite, clear-cut and specific predictions of disaster. That is not in the cards. It will probably take the actual occurance of horrible events that can be tied to global warming, such as flooding of coastal cities.
Most people do not understand that humans are part of Nature. Human activity figures directly into all natural processes. We are part of the Biosphere. The equation has to balance. You change one factor by adding or subtracting it to our environment. Be it the Biosphere, Atmosphere, lithosphere or outer space. it will change the existing state of our planet. I do believe that at the current rate that we humans are disrupting natural processes that Nature will take over and put things back into its owen order. The Earth does not need we Humans to survive as planet Earth. I wonder if we have enough smarts to save ourselves as a species.
T Marvell.
That’s not so. As Hans Rosling points out in this talk, “We have reached peak child”.
http://www.ted.com/talks/hans_rosling_religions_and_babies.html
The population increase now is more to do with the number of generations alive at one time rather than the numbers of children being born.
The biggest thing we can do to control population is to make it easier or more desirable for women to delay marriage/ the birth of their first child. When the average age of first birth increases by 8 or 10 years, from below 20 in far too many countries to well over 25 for example, the multiplier effect through grandmothers and great-grandmothers means that societies finish up with far fewer 4 and 5 generation families. When women need to be 16 or 20, 24 or 30 and 32 or 40 years older than currently to become grandmothers, great-grandmothers, great-great-grandmothers, obviously far fewer families will have a large number of generations as part of their contribution to total population as well as a much shorter overlap time for those that manage very long lives. That’s a far more achievable target.
(The side benefit being that the option of never having children at all becomes more available or attractive when mature women are not being pressured into presenting their families with grandchildren the moment they got married. One of the great failures of the Chinese program was that they only restricted child numbers and age of marriage. They didn’t do anything about the social and family demands that grandchildren were obligatory and be produced as soon as possible.)
adelady, thanks for pointing out the importance of the element of mother’s age at time of first child in discussing population issues. If successfully implemented by whatever means, a global policy that successfully got women to postpone their first pregnancy till after fifty would be the only way to immediately start reducing population without either directly denying any woman the right to have at least one child, or going the route of some form of euthanasia (or even less pleasant methods).
IIRC, this was one of the strategies used in Bangladesh to get average birth rates down from about 8 kids per mother to 3 or so.
The US recently spent trillions of dollars bailing out criminals responsible for nearly bringing down the entire global banking system. What if we spent that money offering women around the world a thousand dollars for every year they delay the birth of their first (or next) child? My bet is that for a fraction of the total bailout money you could immediately reverse population rise and send the world fairly rapidly toward a much smaller global population without having to ‘cull’ anyone or ask anyone to take on too burdensome a responsibility.
Of course, then you would still be left with the other part of the equation–consumption.
(reCaptcha seems to be getting into the discussion by reminding the guys to keep it “inpants…” ‘-)
57 Wili said, ” a global policy that successfully got women to postpone their first pregnancy till after fifty would”
leave ever so many couples childless, and would dramatically increase ailments in both child and mother.
30 is a reasonable target, methinks.
Look:
They have got the fameous bump in the curve starting 12900 years ago and lasting 7-900 years onward, the big freeze, younger Dryas. Discowered in twoo small lakes in Jylland. Denmark.
This phaenomena has been shown to corelate in time with the lake Agazzis cathastrophy of North America, and even asteroides have been discussed for the cause of it.
However, as far as I could see, the very fameous Eiffel vulcanism has been totally ignored as an explaination.
Which was dramatic.
It did explode quite exactly 12900 years ago and kept on for the same 7-900 years, giving up to 15 meter thick layers of tuffstone near to the Eiffel area, and ash layers are found north to Skåne in Sweden.
Mankind had to evacuate to Northern Irland, Finnmark, Aserbadschan, Malta, and Portugal.
But after it had settled, the central EU became very much greener than before, with exellent wines and fruit gardens.
The tuffstone is interesting. It is more resistant to acid rain than limestone and sandstone. It is light and it can be sawed.
“VulkanEiffel” and Maria Lach is worthy of a visit. My brother lived at Bonn bad Godesberg and there were very fertile fruit gardens around in the hills, and looking like burnt ashes and glass smellig of sulphur in the quite obviously vulcanic bedrock.
Thus, think of Eiffel vulcanism next time you write about younger Dryas and the big freeze and check it up. And you may score a peer rewiewed article about it in Nature.
“Younger Dryas” is named after Dryas octopetala L., which is a very fine flower on the Tundra and in the high mountain plains even today. Rosaceae. And the conscept of “dryas” & the big freeze of younger Dryas discovered in 2 small lakes of Jylland, Denmark.
OK folks, if this is true, you can keep that Eiffel vulcanism and youger dryas with big freeze as a mark of dramatic events that have not happened since then.
wili wrote: “What if we spent that money offering women around the world a thousand dollars for every year they delay the birth of their first (or next) child?”
What if we simply spent that money to meet the already existing, huge, world-wide unmet demand for access to contraceptives and family planning services?
There are tens of millions of women all over the world who already want to reduce the number or frequency of births, but are unable to do so because they lack access to the necessary tools and information.
Carbomontanus, when it comes to volcanic cooling on a *global* scale think latitude: the volcano must be in the tropics for its aerosols to cool both the northern and southern hemispheres. The Eiffel is pretty far north to do so.
Jim Larsen: good catch: and obvious typo for ‘thirty’
SA, I agree.
1. Has any correlation been made between space weather, volcanic eruptions, earthquakes and the relatively recent rise in C02/temperature?
2. Have any of the studies of moon or mars soil shown evidence of recent climate change?
3. Why does the most recent summer show feel as if we are cooling if we are in global warming?
Thank You
Jim,
1)No strong correlation exists between warming and space weather. Volcanic eruptions can cool the planet. They don’t explain 40 years of warming.
2)The Moon has no atmoshpere, so it’s energy balance is purely radiative. Mars’ climate is dominated by dust storms–it cools when there are lots of dust storms, warms when they decrease. The only commonality between Earth and other celestial bodies would be the Sun. Solar irradiance has not changed sufficiently to account for observed warming
3)Climate change does not imply an end to weather.
You’re welcome.
i want each and everyone of you to do this simple experiment.
just write down when you last saw a frost this year.
Now cast your mind back to when you can remember when you were a kid
When did you first see a frost?
It is pretty simple.
Yes location will help.
jb @65 You need to clarify your request a bit, looking for anecdotal evidence of [something?]. When I last saw a frost this year would have been sometime in the spring, I didn’t make a note of the date – when I first saw a frost as a kid would have likely been the first time I was taken outside in the fall, maybe about 1 year old. The former would have been in far western Canada, the latter would have been in Detroit. What does this tell us about . . . anything?