Are the rising atmospheric CO2-levels a result of oceans warming up? And does that mean that CO2 has little role in the global warming? Moreover, are the rising levels of CO2 at all related to human activity?
These are claims made in a fresh publication by Humlum et al. (2012). However, when seeing them in the context of their analysis, they seem to be on par with the misguided notion that the rain from clouds cannot come from the oceans because the clouds are intermittent and highly variable whereas the oceans are just there all the time. I think that the analysis presented in Humlum et al. (2012) is weak on four important accounts: the analysis, the physics, reviewing past literature, and logic.
This time Humlum et al. did not directly remove part of the data which didn’t fit their conclusions, however, they chose to use a short record of global mean CO2 from NOAA Earth System Research Laboratory (ESRL), starting from 1980, rather than the longer Keeling curve from Mauna Loa starting in 1958.
The two CO2 records, however, are almost identical over 1980-2012 (green curves in Fig. 1), and hence it would be more appropriate to use the longer record because CO2 is expected to play a role for long timescales. Hence, the Humlum et al. paper highlights the need for sorting out some classic misunderstandings, namely the mix-up between time scales. We have already discussed the absurdly misguided claims of a “halted global warming” based on a brief period after 1998 (here and here and ….)
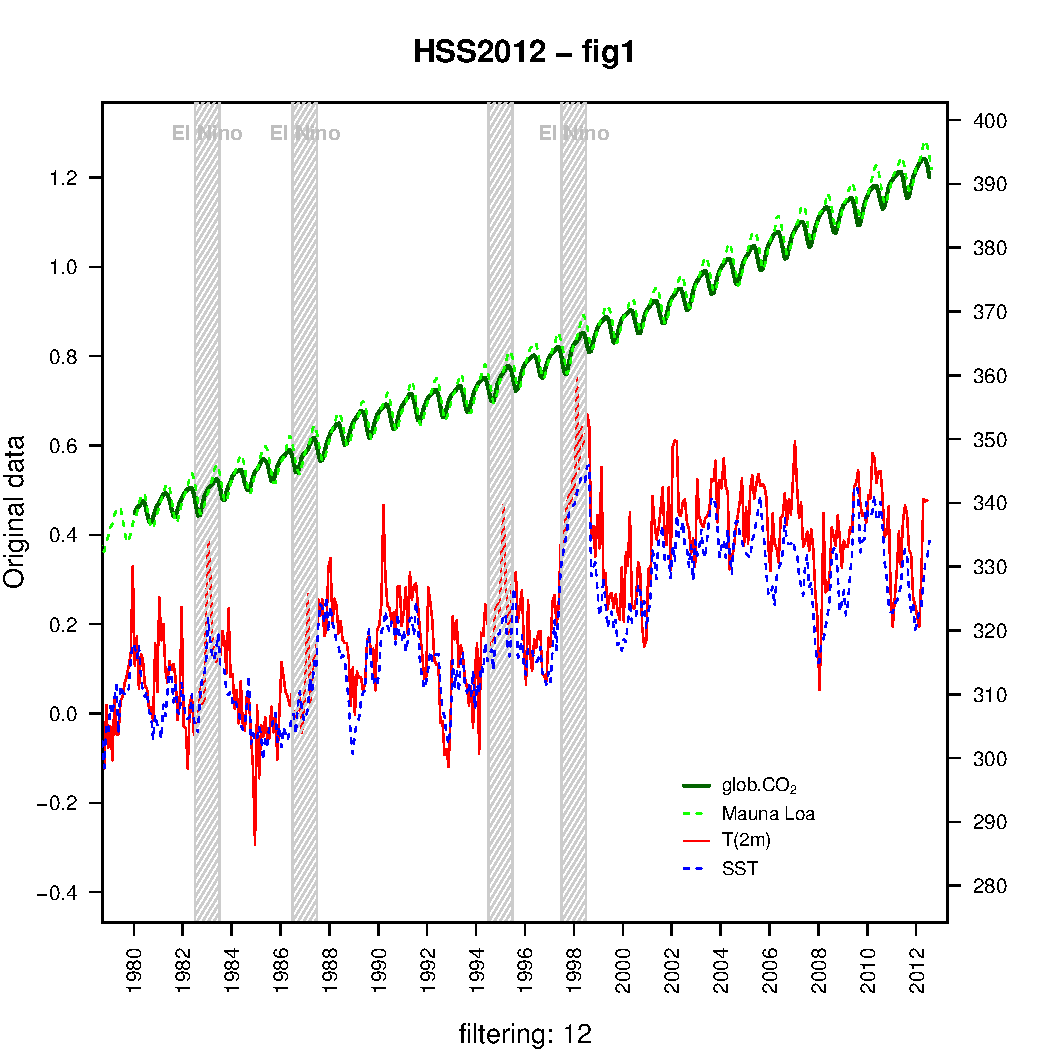
In order to assess the claims made in Humlum et al. (2012) (in italics above), I have repeated part of their analysis and got very similar results (all reproduced with the on-line R-script). Fig 1 here is a replication of figure 1 in Humlum et al. (2012) and I got almost identical results using the Keeling curve from Mauna Loa starting in 1958 rather than the global curve starting in 1980.
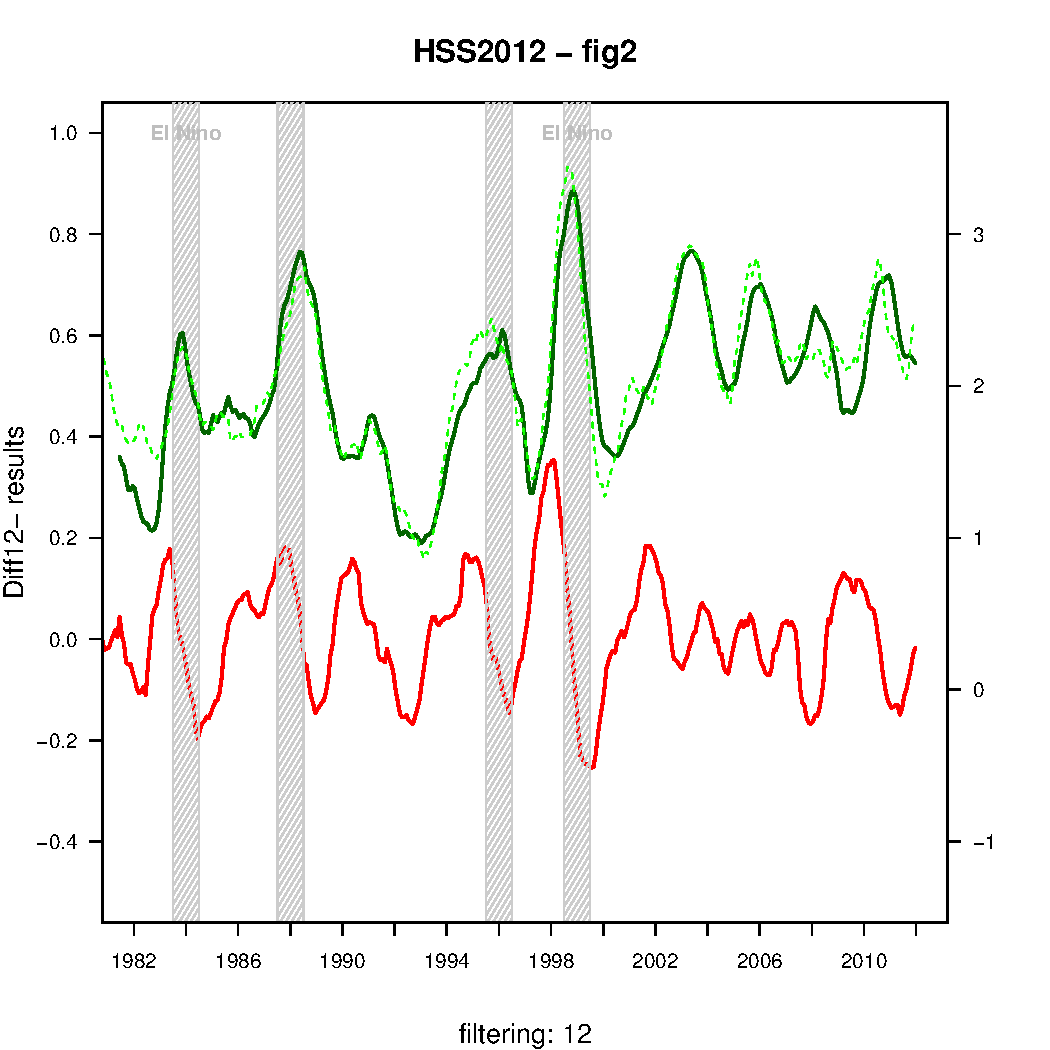
Fig. 2 corresponds to the lower panel in their figure 2, and shows the results of my attempt to reproduce the quantities making up the basis for their claims: their ‘DIFF12’ quantities (a type of differentiation operator) which really is meant to describe the rate of changes in the original curves.
Their main argument about causality between temperature and CO2, however, was based on a lagged correlation analysis between ‘DIFF12’ series from temperature and CO2. Fig. 3 corresponds to figure 4b in Humlum et al. (2012):
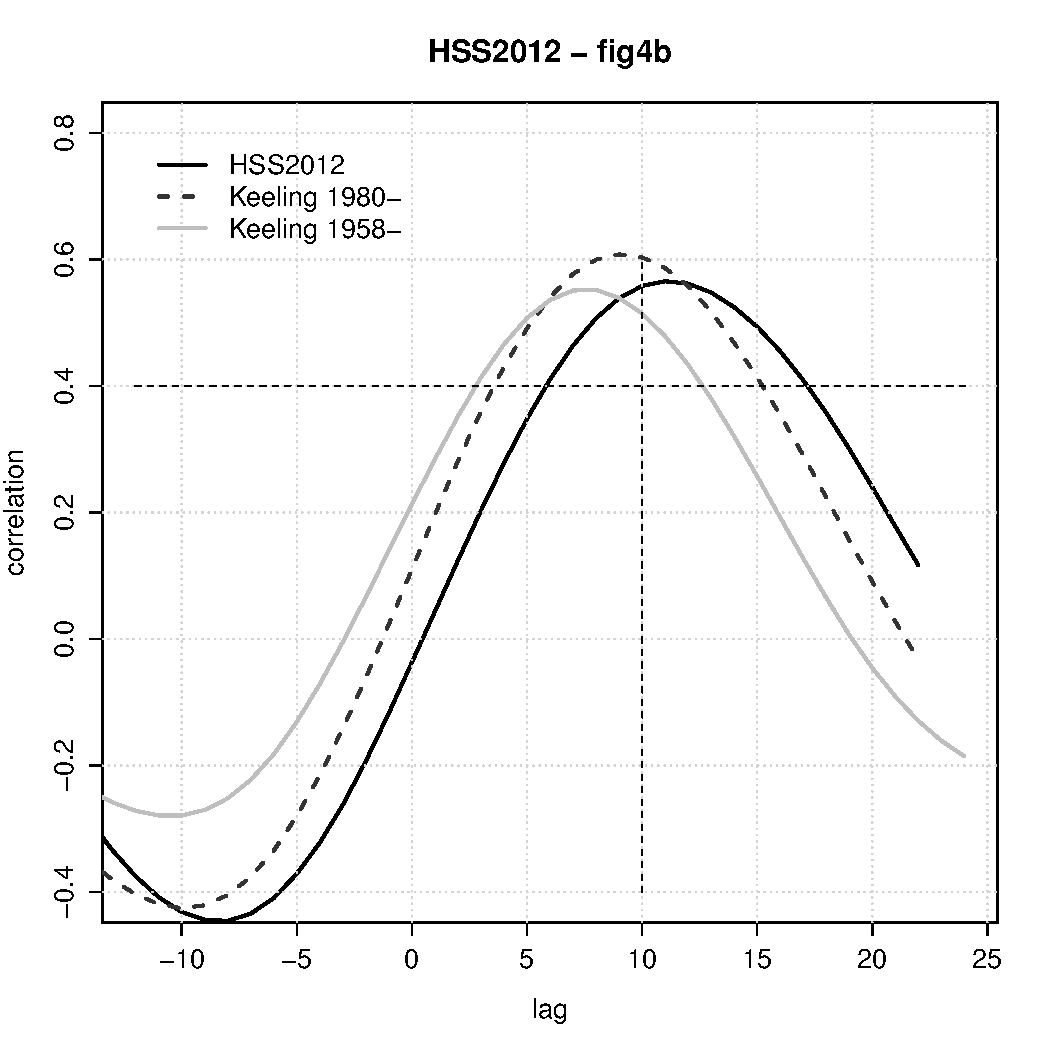
The correlation that I get is similar but not identical to theirs. Using a longer record did affect the lag correlation analysis as seen in Fig. 3. Nevertheless, the analysis still indicated that CO2 lagged the temperature. Big surprise?
No! Applying correlation to the results from the ‘DIFF12’ quantities cannot detect any trends – it’s just a simple mathematical fact. These results merely confirm already well-known facts, which ironically, they themselves hinted to in their paper (but they obviously did not make the connection):
changes in atmospheric CO2 appears to be initiated near or a short distance south of the Equator, and from there spreads towards the two Poles within a year or so.
The answer is of course: El Nino! A google scholar search with ‘”El Nino” AND CO2’ gives more than 20,000 hits, and Humlum et al. have rediscovered well-known facts which Keeling and Revelle discussed already in 1985.
El Ninos affect the CO2 concentrations for a brief time interval, through their effect on temperature and marine biology. But unlike Keeling and Revelle, this discovery caused quite some confusion, as evident in the following citation:
…showing that changes in the emission of anthropogene CO2 are not causing changes in atmospheric CO2.
So how did they get to this conclusion? The answer is in their analytical set-up, and for this they have quite an unusual record (here and here).
It’s well-known that taking differences also picks up short-term rather than long-term variations where mean trends are represented by a constant value. Hence, a correlation analysis is bound to give mean trends zero weight. This is demonstrated in Fig. 4:
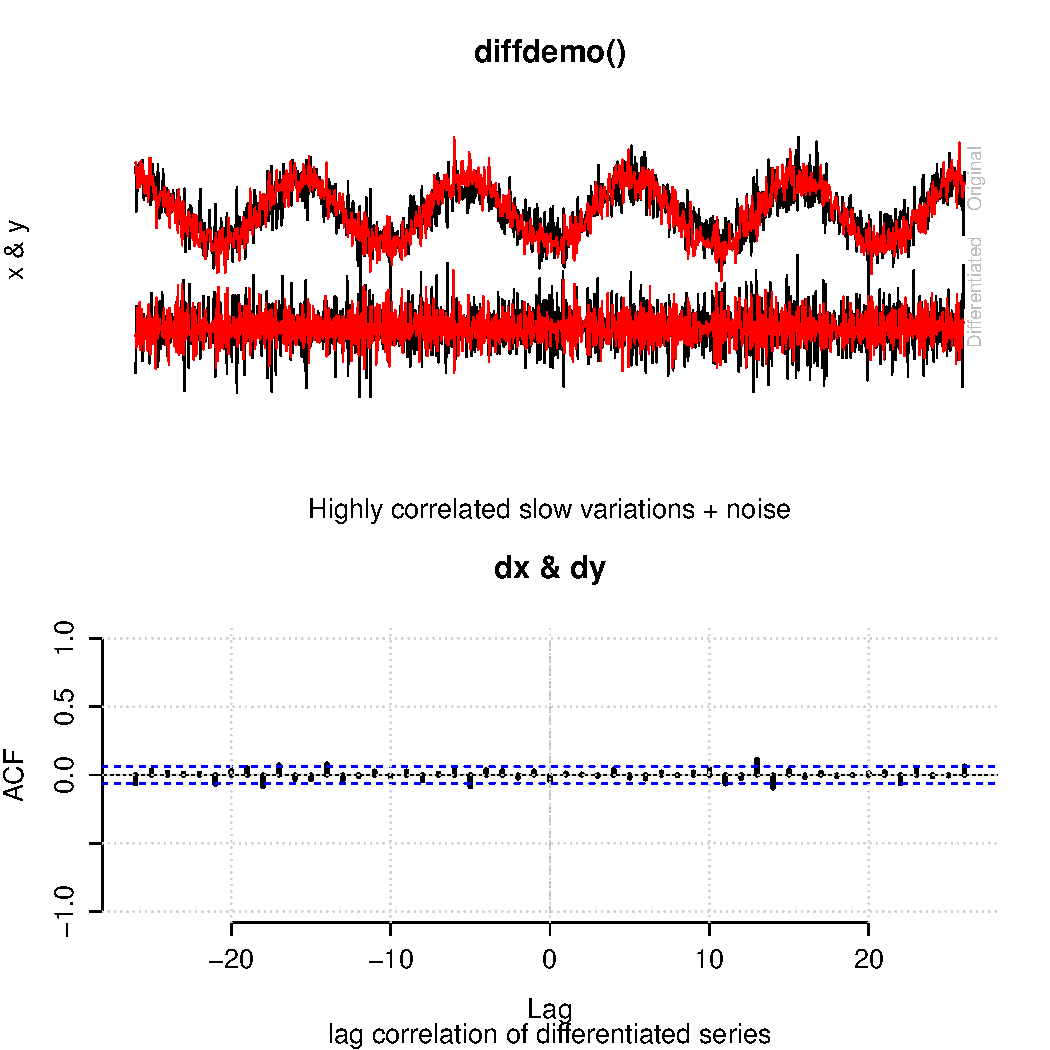
Simply by choosing a method that ignores trends associated with human activity, they argue that atmospheric CO2 is ‘largely independent of humans‘. This logic is circular reasoning, but since they did not specify time scales, their argument gets a bit fuzzy (the argument is true on short time scales but not on decadal time scales – just see the trends in the figure).
The set-up with ‘DIFF12’ also does a strange mix to the data and gives weird results as already noted on Troy’s scratchpad. It is indeed easy to show that the ‘DIFF12’ methods fail to pick up long-term co-variations, as done in Fig. 5:
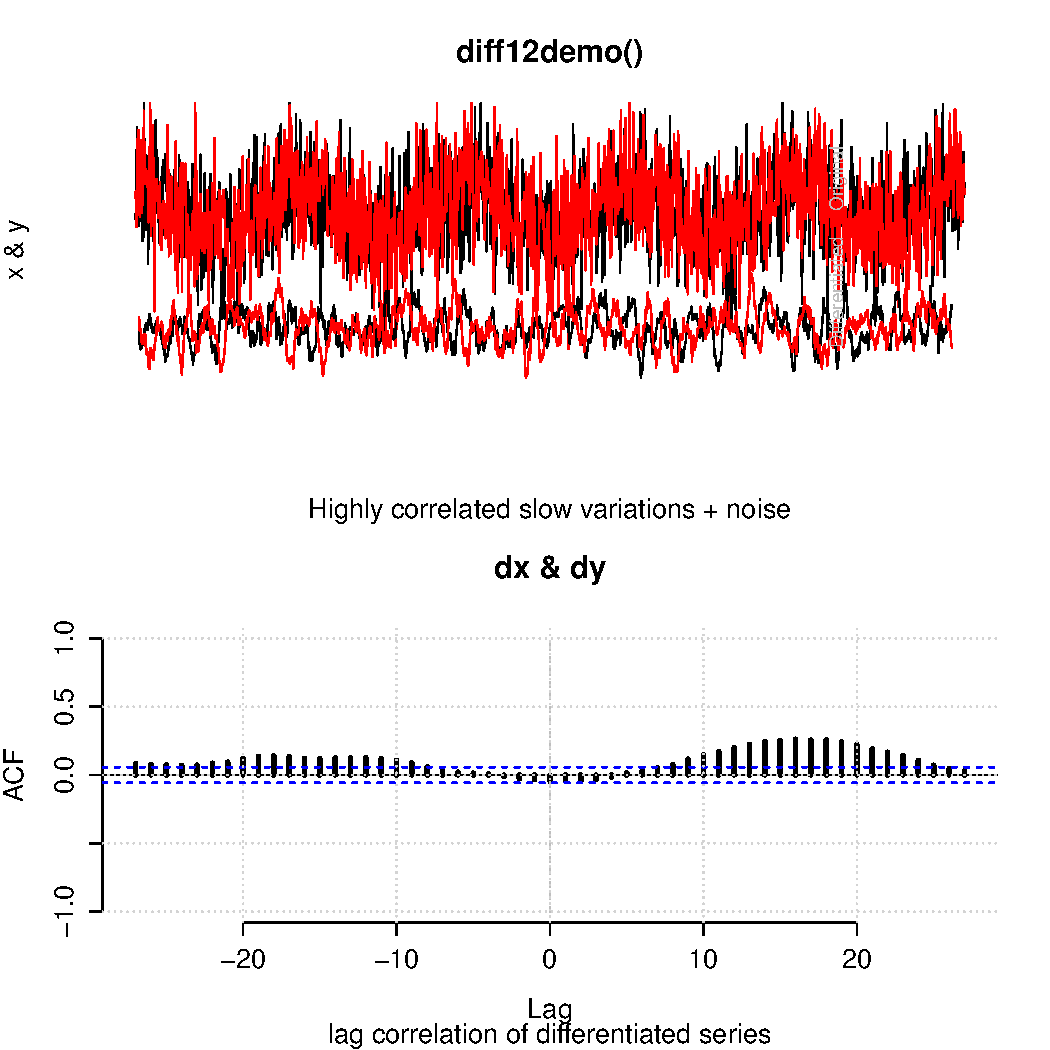
Contrast these results with the claim made by Humlum et al. (2012):
the association between periods of maximum DIFF12 CO2 increase and no or negative ocean surface temperature change … is difficult to reconcile with the notion of atmospheric CO2 changes controlling changes in ocean surface temperature.
Choosing a method discarding the trends may get one into trouble, however, one would also expect a consistent picture in terms of physics. Here is another glitch, and the weak-on-physics aspect is due to the failure to appreciate what implications their claims would have for the climate sensitivity.
They implicitly expected that minute and almost invisible similarities between the inter-annual variations in CO2 would have a visible effect on inter-annual variation in the global mean temperature (this is their hidden “strawman” argument; see curves in Fig. 1). Yet they ignored the CO2‘s steady march upwards.
Furthermore, they failed to note that the forcing is proportional to the natural logarithm of CO2 – ln(conventration in volume). Such are omissions expected from novices (my speculation: this is somehow related to the composition of the author team consisting of a professor in geology, a statistician from a telephone company, and an astrophysicist).
The extraordinary claims about the relationship between temperature, CO2, and human activity made in Humlum et al. (2012) also makes me think of a Carl Sagan citation: “Extraordinary claims require extraordinary evidence”. I must say I’m disappointed by the reviewing process of Global Planetary Change and this is the second (Humlum et al., 2011) unpersuasive paper in that journal making such bold claims.
Earth shattering claims should meet rigorous evaluations. It would be useful for reviewers to google the authors of the papers, as some do have quite a track record of well-established mistakes (here and here and here and here).
In addition to failing the analytical set-up and the physics (which should have been picked up), they also provided some unusual citations, missed important works, and referred to questionable publications.
Furthermore, using the NOAA ESRL CO2 data, Humlum et al. could have sought advice with the data providers before submitting their paper (the ESRL is not mentioned in their acknowledgement, and I wonder if they would have a view on this analysis). Indeed, the ESRL encourages such quality checks according to the heading of the data file:
If the data are obtained for potential use in a publication or presentation, ESRL should be informed at the outset of the nature of this work. If the ESRL data are essential to the work, or if an important result or conclusion depends on the ESRL data, co-authorship may be appropriate. This should be discussed at an early stage in the work. Manuscripts using the ESRL data should be sent to ESRL for review before they are submitted for publication so we can insure that the quality and limitations of the data are accurately represented.
I also wonder what the affiliated universities think about Humlum et al.s work and their past record, and I think misguided work, as presented here, is not exactly good advertisement. Furthermore, they are also involved with an organisation called “klimarealistene” (with collaborations with the Heartland Institute), which claims that the IPCC has ‘cheated‘ in terms of the temperature data (which ironically, they themselves rely on in Humlum et al. (2012)) and produced the ‘famous hockey stick’ (The people thanked in the acknowledgement reads like who-is-who within “klimarealistene”).
A good thing is that Humlum et al. now have obliged themselves to share their data, results and methods by using the CO2 data from NOAA:
RECIPROCITY – Use of these data implies an agreement to reciprocate. Laboratories making similar measurements agree to make their own data available to the general public and to the scientific community in an equally complete and easily accessible form. Modelers are encouraged to make available to the community, upon request, their own tools used in the interpretation of the ESRL data, namely well documented model code, transport fields, and additional information necessary for other scientists to repeat the work and to run modified versions. Model availability includes collaborative support for new users of the models.
I’ve asked them to share their results, data and methods before, but so far with little success. My job as a climate scientist is to replicate results. Further progress may take place if we can go through the analysis together, test methods and data, and agree on which give robust answers and which don’t.
References
- O. Humlum, K. Stordahl, and J. Solheim, "The phase relation between atmospheric carbon dioxide and global temperature", Global and Planetary Change, vol. 100, pp. 51-69, 2013. http://dx.doi.org/10.1016/j.gloplacha.2012.08.008
- O. Humlum, J. Solheim, and K. Stordahl, "Identifying natural contributions to late Holocene climate change", Global and Planetary Change, vol. 79, pp. 145-156, 2011. http://dx.doi.org/10.1016/j.gloplacha.2011.09.005
46 sbripman, that was the nicest thing I’ve ever seen posted on the internet. Your spouse is very lucky.
The problem with Humlum et al.’s paper starts right at the beginning with their hypothesis and methods. Rather than revealing the underlying trends in the (CO2 and temperature) data (their stated goal) their mathematical manipulations actually removed those trends. What their methods did reveal are secondary signals superimposed as those long-term trends of increasing CO2 and temperature. The phase relationships of the secondary signals – the gist of their further analyses – don’t necessarily tell you anything about the phase relationships of the underlying trends. Those secondary signals are, in fact, feedback signals, and, as such, the secondary temperature signal must always precede the CO2 signal. Because the limits of the period analyzed leave us out on an essentially linear (if you were able to successfully remove all the “noise”) “limb” of the modern CO2-temperature episode, it would not be possible to establish the phase relationship of the underlying signals – you would need to “see” either the starts or the peaks of the two signals to determine that phase relationship – exactly what has been done in the case of the paleo data.
What is unfortunate is that there may well be something interesting lurking in the results of this type of analyses. If the peer-review process had worked properly in this case, the authors might have been challenged (admittedly not likely given their apparent prejudices) to defend their methods and, as such, may have come to see the basic flaw in their logic, remove their erroneous conclusions, explore the valid implications of their results and reveal something worthwhile about the Real Climate.
I would like to see the graphs scaled at the estimated immediate response climate sensitivity rate. If Xppm rise in CO2 should result in YC increase, then it would be useful for them to be of the same visual size. I’m suspecting that if that were done, the CO2 curves would be much smaller. If so, then CO2 simply can’t drive temperature at these time scales, and the result is pre-ordained?
“Scientists here and elsewhere have stressed that regional results are wicked hard to predict.”
“Science and geography is great combination to explain this issue.”
As a non-climate scientist, I occasionally turn to turn to climate science literature to see what specific regional predictions are being made that may be relevant to my own line of work (fish systematics and zoogeography). Consequently, I have seen the sentiment expressed in the two preceding quotes appear often on this website.
Although my limited reading of the primary climate science literture makes clear that there is a rich and abundant literature using time frequency and phase effects from climate relevant physical observations (ie temporal autocorrelation), I see much less use and detailed discussion of spatial autocorrelation among such contributions. While presumably the “difficulty” in making predictions is do at least in part to the well known phenomenon that slight change in boundary conditions can dramatically affect the magnitude and even direction of solutions to differential equations, this particular discussion prompts a more general question of exactly how do climate scientists attempt to statistically correct for obvious asymmetries in planetary regionality imposed on climate models by positional effects of highly irregular terrestrial and oceanic boundaries?
Pointers to how climate scientists take into account spatial effects and specific results that demonstrate how statistical methods sensitive to and correcting for spatial effects have been used to address this issue would be appreciated. Perhaps a more roust discussion of spatial effects might well better elucidate cause and effect among measured variables on a regional, if not global scale.
As an academic note, I don’t like the NOAA ESRL policy statement you quote:
“If the data are obtained for potential use in a publication or presentation, ESRL should be informed at the outset of the nature of this work. If the ESRL data are essential to the work, or if an important result or conclusion depends on the ESRL data, co-authorship may be appropriate. This should be discussed at an early stage in the work. Manuscripts using the ESRL data should be sent to ESRL for review before they are submitted for publication so we can insure that the quality and limitations of the data are accurately represented.”
Data is data. I think it’s fine for ESRL to be listed as a coauthor if their data is essential to the paper, but I do not think it’s fine that they should act as gatekeepers for the use of their data in general–which they seek to do when they say they should review papers prior to submission. Is it a good idea for a researcher to get ESRL’s input on whether things are working out? Sure. But should the researcher be obligated to get ESRL’s input? No way.
[Response: I agree. If data are online they are usable by anybody as long as they are properly cited. There are of course many mistakes that can be made and these can often be prevented by talking to the data originators, but pre-review and publication veto power are inappropriate. I’m a little surprised at this statement though – I know of nothing similar in other climate data repositories. – gavin]
I’m surprised the Humlum paper wasn’t published in E&E. Surely that journal’s overdue for another corker.
Gavin:
A question about your response to Jonathan Teller-Elsberg (30 Sep 2012 @ 8:03 PM). Is your concern about the NOAA ESRL policy due to the fact that they make their data available to all up front? For example, would you object if agreement to their policy was required prior to access to data in the first place, or do you think that any publicly funded original data source should release data unfettered immediately upon its collection?
I favor the idea of free access, but don’t know what other important factors may be at play.
Steve
[Response: Not sure what you mean. I think it’s great that they make data available up-front and they should continue to do so. There is a quite widespread feeling among data originators that doing so will allow other people who don’t know what they are doing to mis-use it (and that certainly happens), which is why a policy statement like the one for ESRL was written. However, I think that is pretty much unenforceable and not sensible in the first case – people don’t have time to do the research that they want to do, let alone vet everyone else’s screw-ups. So the alternative is to simply let the data out into the wild and rely on the peer-review process (or post publication review process) to weed out the more dubious uses (and that mostly works out). – gavin]
Gavin (1 Oct 2012 @ 10:04 AM):
Thanks.
Steve
> people who don’t know what they are doing to mis-use it
Maintainers of web pages where data sets are publicly available could coordinate a moderated response to that.
If maintainers would provide a recognizable consistent button — next to the data ‘download’ button — they could have _available_ to, as time allowed, accumulate references/links/comments on published (or blogged) claims that supposedly relied on the data set.
Moderated so the septics wouldn’t use it for advertising.
Basically — not saying _do_ a lot of work, but just do what “hypertext” was supposed to do for us, give one list of pointers right next to the source, “this data referenced in”
——
Simpler:
Does Google Scholar’s “cited by” button work for published data?
It should.
Maybe with a rating icon, for stuff not peer reviewed.
“So the alternative is to simply let the data out into the wild and rely on the peer-review process (or post publication review process) to weed out the more dubious uses (and that mostly works out). – gavin]”
Well, sure, assuming you don’t care about reality. Peer-reviewed = minor player. Watts can play with some data and he will have far more influence than any three peer-reviewed scientists.
[Response: You can’t expect a few thousand scientists to act as policeman of truth for the whole world. The answer to bad information is better information – and that is the only sustainable long term strategy. – gavin]
Jim Larsen: “Peer-reviewed = minor player.”
This is simply not true. Science is STILL the best guide to truth about nature–and truth eventually prevails. I would rather scientists go about generating science and allow laymen who care about science to inform idiots of their idiocy.
I wish someone would give a link to the full Humlum paper, such that people not in the field don’t have to pay $40.
It looks like the well-known sitaution where temperature affects CO2 levels in the short term (several months), and CO2 affects temperature over the long term (years to decades). It’s possible to separate the effects statistically, and there is no doubt that the latter effect swamps the former.
> The answer to bad information is better information
We may fervently hope so.
The alternative answer is the epitaph for democracies:
“You can fool enough of the people enough of the time.”
> I wish someone would give a link to the full Humlum paper, such that people not in the field don’t have to pay $40.
Google (scholar) is your friend, just search for the title and grab the PDF.
http://scholar.google.com
Type in “The phase relation between atmospheric carbon dioxide and global temperature”
Press Enter key.
You ready for 37 pages of what everyone deems is a bad paper? Personally I’d spend my time reading the more important papers.
Gavin said, “You can’t expect a few thousand scientists to act as policeman of truth ”
Yep, I agree. This isn’t a fair fight, and scientists have been thrust into roles which are diametrically opposed to their chosen life paths. Asking a scientist to out-politician a politician is durn near futile and unfair to boot, but when the stakes are so high, you take your best shot, and if that slows the science a tad, then the question is which is more important. This blog is a grand example of your walking my talk.
However, I think the window for scientists to help via “convincing the world” is about over, so I’m crying about spilt milk. The Arctic sea ice will continue to degrade, and Antarctica and Greenland are being closely monitored too. I’d guess we’re one US presidential election cycle from climate change being a core issue.
thank you Unsettled Scientist for the source, which I should have tried anyway.
About reading the article – the journal Global and Planetary Change seems to be respectable and the paper was peer reviewed. At least it should be answered in a comparable way.