Last week the science community was shocked by the claim that 42% of the sea-level rise of the past decades is due to groundwater pumping for irrigation purposes. What could this mean for the future – and is it true?
The causes of global sea level rise can be roughly split into three categories: (1) thermal expansion of sea water as it warms up, (2) melting of land ice and (3) changes in the amount of water stored on land. There are independent estimates for these contributions, and obviously an important question is whether their sum is consistent with the total sea level rise actually observed.
foto (c) Stefan Rahmstorf 2012
In the last IPCC report (2007), the time period 1961-2003 was analysed in some detail, and a problem was found: the individual contributions summed up to less than the observed rise – albeit with rather large uncertainties in the estimates. In the years since then, much research effort has been devoted to better quantify all contributions. For the last decade there is also improved observation systems, e.g. the GRACE satellite mission and thousands of autonomous ARGO floats monitoring globally the warming ocean.
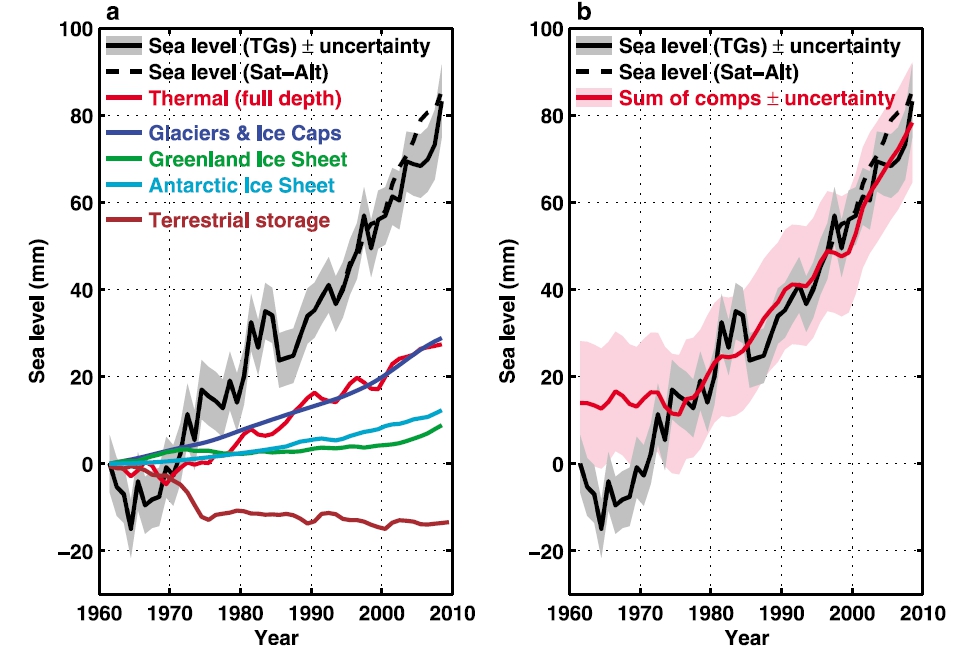
Last year Church et al. (2011) provided a new sea-level budget analysis (see Fig. 1). For the period 1972-2008 the budget is closed, with a total rise of about 7 cm. A bit over half of that is due to melting land ice, and a bit less than half due to thermal expansion. Land water storage makes a small negative contribution, because the water stored in artificial reservoirs (which lowers sea level) is estimated to be larger than the amount of fossil groundwater pumped up for irrigation (which mostly ends up in the sea). Also for the shorter recent period 1993-2008 (for which we have satellite measurements of global sea level rise, found to be about 3 mm per year) John Church and colleagues successfully closed the sea level budget. Granted, the uncertainties in the estimates are still significant so the issue cannot be considered completely resolved. Nevertheless, the Church et al. paper defines the current state of the art against which all further studies need to measure up.
Fig. 1. Sea level rise for 1961-2008. On the left the individual contributions are shown, on the right the sum of these contributions (red) is compared to the measured rise (black). Graph from Church et al. (2011)
The groundwater shock
On May 20, Nature Geoscience published a Japanese model simulation of global land water storage (Pokhrel et al. 2012), which surprised the expert community with the conclusion that 42% of sea level rise (about 3 out of 8 cm) over the period 1961-2003 is due to reduced land water storage. In contrast to earlier studies, reservoir storage was assumed to be smaller, but mainly groundwater pumping was calculated to be several times larger.
Are the new numbers realistic? I and many colleagues I spoke to have serious doubts. It is a model result which is in stark contradiction to data-based estimates. The simulation is based on a simple assumption: first the total water demand was estimated, second the availability of near-surface water, and then the shortfall was assumed to be completely supplied by unlimited use of fossil water. The realism of this assumption is debatable – to me it seems to run a risk of greatly overestimating the withdrawal of fossil water.
The uncertainties also need to be discussed: the fossil water withdrawal is estimated by subtracting two large, uncertain numbers. Yet there is no proper uncertainty analysis. Instead, a single number with three significant digits is presented (359 km3 per year for 1950-2000). That is almost five times the rate of 82 ± 22 km3 per year computed by Konikow (2011) for 1961-2008, based on data for groundwater usage and actual observations of water-level declines in aquifers being depleted. Leonard Konikow, a hydrologist with the US Geological Survey, says about the huge amount of groundwater depletion simulated by Pokhrel: “Groundwater hydrologists would have noticed if such a large volume of water were ‘missing'”.
A bit dubious is also the fact that for the largely overlapping period 1950-2000 Pokhrel et al. find that less than 20% of sea level rise is due to land water storage, not 42% as for 1961-2003. Yadu Pokhrel responded to my query that this is due to a large short-term increase in the landwater contribution to sea level between 2000 and 2003, combined with the fact that their rates are computed simply from the difference between the end points (2003 minus 1961). 2003 happened to be a drought year with little water stored on land. Church et al. compute their budgets based on linear trends, which is more robust by using all data points and not just the end points.
Pokhrel et al. don’t even mention the Church et al. paper (although that was published before their paper was submitted). They relate their discussion to the old IPCC finding of “missing sea level rise”, claiming to now have found the source of this missing water. The media largely followed this story line.
Impact on future projections
If the Pokhrel numbers were right, what would this mean for the future? There are two methods to estimate future sea level rise: complex process-based models, which try to compute all individual contributions (e.g. glacier melt) under changing climate conditions, and semi-empirical models, which exploit the observed relationship between global temperature and sea level and are calibrated with past data (see my article Modeling sea level rise at Nature Education). Both have their problems and limitations, and currently I don’t think anyone can seriously claim to know which will turn out to be closer to the truth.
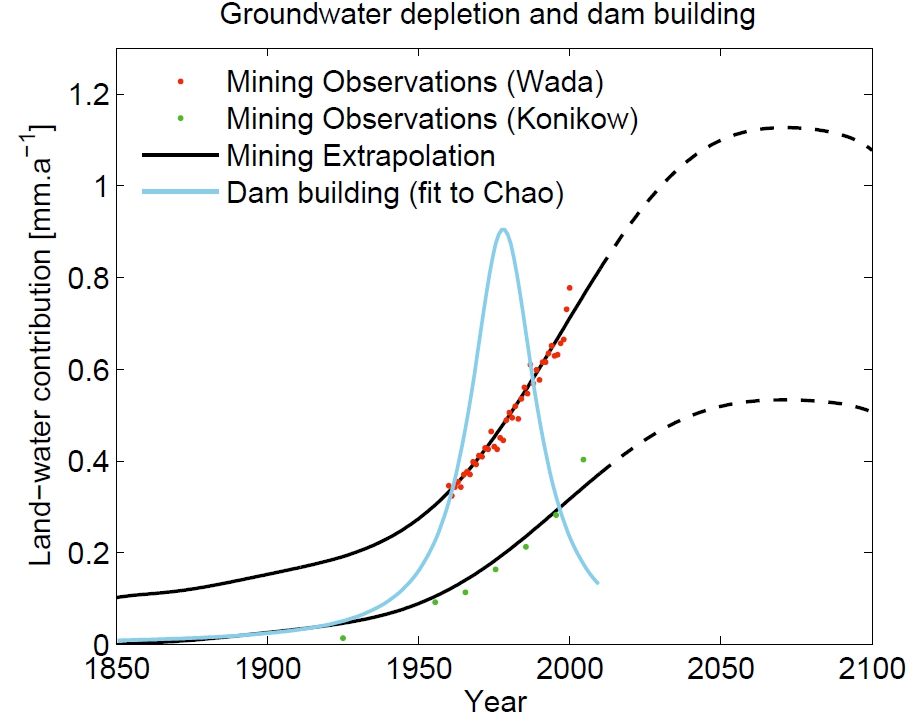
Fig. 2. Change in sea level in mm per year due to the contribution of groundwater pumping (black curves – estimated based on data by Konikow 2011 and Wada et al. 2010) and water storage in artificial reservoirs (blue – this contribution is negative, i.e. lowers sea level). From Rahmstorf et al. (2011).
For the process-based models, the high fossil water pumping rates according to Pokhrel would simply have to be added to the projections (artificial reservoirs are generally thought to not offset much of this in future, because reservoir construction is well past its peak and there is not much scope for a large expansion). Last year we published simple projections of the groundwater pumping contribution (Rahmstorf et al. 2011, see Fig. 2), based on the data by Konikow (2011) and an earlier study by Wada et al. (2010) together with the medium UN global population projection. In the upper of the two curves, groundwater pumping raises sea level by 10 cm by 2100. If, based on Pokhrel, we assume groundwater pumping rates that are roughly twice as high, this could add 20 cm to sea level. Very recently, a new study by Wada et al. (2012) gave a more detailed projection up to 2050 which lies in between our two curves. By 2050 they find 2-4 cm sea level rise due to groundwater pumping. If the rate did not increase any further after 2050, this would add up to 5-8 cm by 2100. Whether 5, 10 or 20 cm – it is clear that groundwater pumping is a factor that must be accounted for in future sea level projections.
The impact of groundwater pumping on semi-empirical projections is smaller, because here we have two partly compensating effects. On one hand there is the added water as just discussed, on the other hand the climate-related part of the projection gets smaller, since the climatic effect on past sea level rise is also smaller, which affects the calibration of the model. In our paper we found that accounting for groundwater depletion according to Wada (i.e. upper curve of Fig. 2) lowers the projections for a moderate global warming scenario (RCP4.5) by 6 cm. If we assume again that Pokhrel’s numbers are roughly twice as high as this, also for the future, then our best estimate for this scenario would come down to 91 cm sea level rise, as compared to 98 cm in our ‘default case’ (for which we used the lower curve of Fig. 2, based on the Konikow data).
Overall, accounting for the Pokhrel landwater estimates would thus tend to increase the process-based sea level projections and lower the semi-empirical projections, thereby reducing the discrepancy between the two – in my view a very welcome feature. But do I believe it?
Weblink
PIK sea level pages (publications, data, graphs, animations and more)
References
Church, J.A. et al (2011) Revisiting the Earth’s sea-level and energy budgets from 1961 to 2008, Geophys Res Lett 38, L18601, doi:10.1029/2011GL048794
Konikow LF (2011) Contribution of global groundwater depletion since 1900 to sea-level rise. Geophys Res Lett 38:5. doi:10.1029/2011gl048604
Pokhrel, Y.A. et al (2012) Model estimates of sea-level change due to anthropogenic impacts on terrestrial water storage. Nature Geoscience, doi:10.1038/NGEO1476
Rahmstorf, S, Perrette, M & Vermeer, M (2011) Testing the robustness of semi-empirical sea level projections. Clim. Dynam. 97, 1-15, http://dx.doi.org/10.1007/s00382-011-1226-7
Wada Y, van Beek LPH, van Kempen CM, Reckman J, Vasak S, Bierkens MFP (2010) Global depletion of groundwater resources. Geophys Res Lett 37:L20402. doi:10.1029/2010gl044571
Wada, Y et al (2012) Past and future contribution of global groundwater depletion to sea-level rise. Geophys Res Lett 39, L09402, doi:10.1029/2012GL051230


Lovely photograph! A click on its properties shows ‘Outer banks’, which a Google indicates is in North Carolina. At first, I would have thought ‘Middle East’, as one of the people in the foreground look as if they are in Arabic dress. But perhaps just wrapped in a large shawl.
Oakwood, that person you see wrapped in Arabic dress?
That’s a surfboard.
Here are three more: http://imgc.allpostersimages.com/images/P-473-488-90/61/6166/TTNG100Z/posters/three-surfboards-standing-on-beach-in-a-row.jpg
Stefan:
A hopefully trivial question- how much of the buoyancy of floating ice is due to occluded air bubbles?
How does this number vary from new ‘black ice’ , to calved bergs that started as porous snowfall?
Glacier simulator: http://intern.forskning.no/arnfinn/polaraaret/glacier.html
Russell, looks like there would be answers out there; here’s a zero:
Characterization and flexural strength of iceberg and glacier ice
http://www.igsoc.org/journal/igs_journal_vol41_issue137_pg103-111.pdf
RE GAGNO – Cited by 11
Icebergs, large floating pieces of glacier ice, pose a serious hazard to ships and …. This zero-porosity limit for the density of ice is 916.9 kg m-3 at O°C. Using this …. Fabric demonstrated a fairly strong degree of preferred c-axis orientation.
Re HR 52. Of course its a surf board. The resolution on my screen was limited. Zooming in, I see you’re right. Show’s how easily the eye and brain can be tricked into ‘seeing’ the wrong thing.
> That’s a surfboard
Fooled me too for a moment
Gnarly right body break, but the board is better off in the sand.
Hank: as glacial erratics testify, bergs can contain a lot more than air, so I think I’ll discount the zero limit.
You’ve got to love Hank and his whole ‘it’s out there’ thing!
Yes, my dimming memory of the density of glacial ice, as opposed to firn, is that a cubic meter of it is so close to being solid water that you wouldn’t want to hit it at speed with any sort of sea-going vessel.
> bergs can contain a lot more than air
Sure, they carry rocks, gotta account for the ballast. I recall studies of the erratics found on the seabed carried out during episodes of icebergs.
Yup, just sayin’, there’s at least that one journal full of detailed investigation of what was found in floating ice, ample reading for those who like that kind of thing.
I suppose those navies that operate under the ice would also have info on both sea ice and bergs broken off ice shelves and glacers, since they’d be looking upward at the stuff and interested in what it was. Doubt they’d publish.
I wonder how much sea ice has added plastic frozen in nowadays.
Martin, Hank, dbostrom, et al, thanks for the info. I would guess that spreading and subduction would have an effect, though maybe (another guess) cancel each other. I need to pursue some of the references given.
“whole ‘it’s out there’ thing!” — I am the merest of acolytes.
[Response:“With a flip of the wrist they can hide your dissertation behind piles of old Field and Stream magazines” Exactly as it should be :) –Jim]
Hank 144:
This particular subsidence mechanism is the same (but in reverse) as the GIA (glacial isostatic adjustment) land uplift mechanism, i.e., the whole oceanic lithosphere is going down squeezing out asthenospheric mantle material that moves to below the continents, causing those to move up. The role of compression is very small and may be neglected.
Part of this is the on-going post-glacial uplift in the large ex-glaciation areas of Hudson Bay (Laurentide ice sheet) and Fennoscandia; a large remote zone or “forebulge” around these areas is subsiding, including most U.S. coastlines. But otherwise the phenomenon is global.
Rod B 162:
The second guess would be mine too. Yes, the ocean floor spreading from the mid-oceanic ridges slowly subsides due to cooling of the rock (that’s why those are ridges!), but this is a stationary situation where new, warm ocean-floor rock is manufactured at the same rate as old, cold ocean floor disappears down the subduction zones.
Also the role of sediment porosity is stationary: new sediment is created by erosion and laid down at the same rate as subduction takes it down into the mantle and squeezes out the pores and volatiles, which bubble up through conduits creating island-arc volcanism (like Japan).
Thank you Martin.
I posted this link on the NC thread, but maybe it’s more appropriate here:
http://thinkprogress.org/climate/2012/07/01/508782/greenland-ice-sheet-melt-nearing-critical-tipping-point/
Should this radically change our view on how fast the rate of global sea-level rise will be? Would this put it into the multi-meter range by the end of the century?
Wili, that article quotes scientists on
> “… a state of inevitable decline” …
> “It appears that we’re about to cross a threshold in summer . . .
> you might even call it a tipping point
> as we go into a net energy absorption”
So my take on your questions is:
No, this does not radically change … sea level rise, and
No, this does not put it into multi-meter … end of the century
It doesn’t say that, it doesnt’ suggest that, and I don’t see how you get to it except that you seem to keep posting the conclusion, offering a variety of possible reasons to reach it.
Be wary of starting with the answer and looking for citations or even blog reports of press reports of interviews to support the answer.
“Reverse citation” is not a good approach to science.