A group of colleagues has all but solved one of the greatest remaining puzzles in climate science. But the story is not one of scientific triumph – rather, it is so embarrassing that we had controversial discussions in our group whether to break this to a wider public at all.
The puzzle is known amongst climatologists as the “wrong sign paradox” – our regular readers will probably have heard about it. Put simply, it is about the fact that a whole number of things in climate science would fit very nicely together, if only the sign were reversed. If only plus were minus.
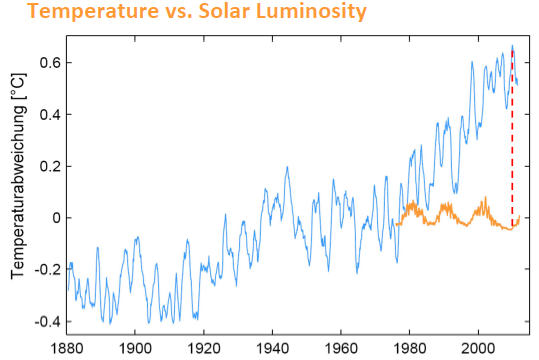
Perhaps the best-known example is how we could explain global warming with variations in solar activity: the hottest year on record (2010) happens to coincide with the deepest solar minimum since satellite measurements of solar luminosity began in the 1970s (Fig. 1). This can’t just be coincidence. But the sign is wrong: physical theory stubbornly insists that temperature should be highest when the sun shines the brightest, not the other way round. The “wrong sign paradox” here is reinforced by the fact that the overall trend in solar luminosity is gently downward over the past 30 years – just those 30 years when we see the well-known strong global warming.
Fig. 1: Global temperature (blue, GISS) and solar luminosity (orange), both as 12-months running means.
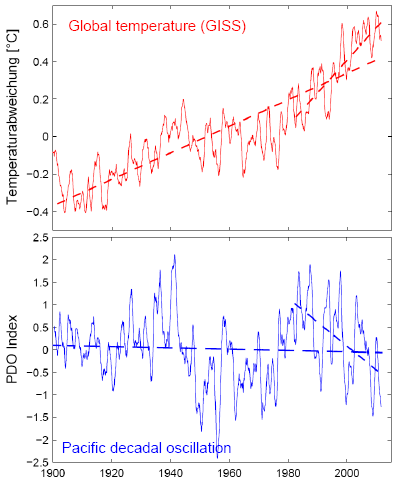
Another prominent example is the Pacific Decadal Oscillation (PDO). Basic physical considerations would suggest that the global temperature is warm when the PDO-Index is high, i.e. when sea surface temperatures in the North Pacific are high. A theory that would beautifully fit the data – if only the sign were reversed (Fig. 2)!

Fig. 2. PDO-Index vs. global temperature, with linear trends (dashed) since 1900 and over the last 30 years.
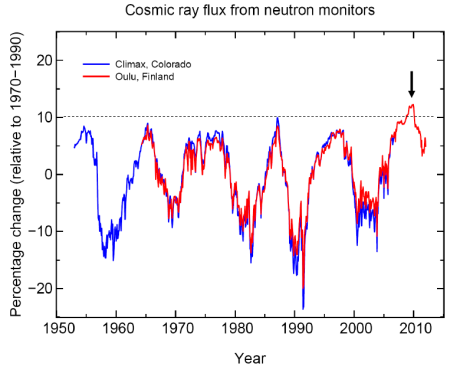
And just to round this off with a third example (there are more of course – perhaps our readers can provide some others): cosmic rays. A very beautiful theory holds that cosmic rays help cloud formation: lots of cosmic rays means lots of cloud and hence cool global temperature. Now cosmic rays have been measured since the 1950s, and they reached their all-time maximum in 2010 (Fig. 3). Bingo: the warmest year on record! But no: a high cosmic ray count should cause cold temperatures, not hot ones.
Fig. 3. Cosmic ray flux as measured at two neutron monitor stations.
Even a lay person can imagine how powerful these (already popular) theories would be, if only the data showed exactly the opposite of what they actually show! If the warmest year on record coincided with the strongest solar maximum and not the deepest solar minimum, or if the PDO showed an upward trend over the past 30 years and not a downward trend. But now a solution seems to be in sight.
Solving the mystery
A group of Dutch and US scientists, led by Harry Van den Budenmeyer (Utrecht University), has now proposed a surprising explanation. “At first I did not want to believe it”, Van den Budenmeyer explained to RealClimate, “but once we started to pursue this, things just fell into place”.
The story goes back to the late 1980s or early 1990s (the exact date has not been traced back yet), when a German climate modeller had persistent problems with results of obviously the wrong sign in his model. He was unable to track down the error, so instead he introduced a FORTRAN integer variable called ICHEAT (sorry to get a bit technical, but you really need to understand this) into his computer code, assigned it the value -1 and simply multiplied unruly results by ICHEAT wherever they occurred in his code. Once he’d find the real problem, he would only need to set ICHEAT to +1 and the code would be correct again. But he never got round to fix the problem, his model performed very nicely and over time he forgot about it.
What he did not consider, perhaps understandably at the time: useful computer code spreads like a virus amongst scientists. The code was free for download, hundreds of other scientists started to use it and many only used bits and pieces – nobody ever starts writing scientific code from scratch if colleagues have already solved aspects of the task at hand and the code is free.
“At first we were really puzzled when we found a piece of code with ICHEAT that was used in our lab for climate analysis”, says Van den Budenmeyer. “But once we discovered what it was we started to search more systematically and ask colleagues, and by now we’ve found the ICHEAT bug not just in different European countries but also in California, New York, Sydney and even a Chinese climate centre. We’ve only begun to explore the implications, but I am sure that a lot of the wrong sign paradox that has plagued our science thus far will just go away.”
We will keep you updated here at RealClimate, of course.
p.s. And yes, this is an April fool’s joke, in the Realclimate tradition of pieces like the Doubts about the Advent of Spring, or the famous Sheep Albedo Feedback.


Such great news on this very day!
Strange…. my version of the code has ‘JCHEAT’ but not ‘ICHEAT’. Do I need to change it, too ? A mutation maybe ?
Ahah… ICHEAT…;-)
I love Van den Budenmeyer/Zbigniew Preisner music, anyway.
Happy April Fools’ Day.
Really, this all comes down (or should that be up?) to what I call “northernhemispheriphilia” – the absurd insistence by scientists of ALWAYS showing the Earth with the northern hemisphere on top. If you guys had had the good sense to show the Southern Hemisphere on top then all the signs would have automatically reversed and the problem would have never arisen in the first place.
Anyway, I think this reversal requires a more thorough analysis, so I’ve alerted the boffins over at WUWT to the situation, who should be able to provide some serious discussion, here: http://wattsupwiththat.com/2012/03/30/open-thread-weekend-9/#comment-941180
;)
A giant , invisible bunny , out for his first spring day, explained this to me. Until then it had me fooled.
Dear Stefan,
Nigel Calder recently produced a graph apparently from Svensmark and Friis-Christensen (2007) that shows exactly the opposite of your Fig. 3. I asked Nigel here and here if he could explain the contradiction, although I was not entirely satisfied with his response.
If I may I would like to ask the same question here. How is it that Svensmark and Friis-Christensen have a graph that appears to contradict yours. Please don’t tell me it’s the ICHEAT bug. :) But it surely must be explained what they have done that is wrong.
[Response: There is of course a real correlation between the 11-year solar cycle (which also modulates the cosmic ray count) and global temperature – quite a few papers have shown this, including recently Foster&Rahmstorf (ERL 2011). -stefan]
Date_and_time(DATE=today)
IF(today.EQ.”20120401″) THEN
ILOL=.TRUE.
ENDIF
I’m confused. The comparisons showing the wrong sign above are between solar activity, PDO and cosmic rays with the temperature record, all observations. How would a bug in the code of climate models affect these comparisons since everything shown above is observations?
In commercial computer code, where people are trying to avoid litigation for copying proprietary code, the concept of “Clean room” development is well understood. You lock people away from net access and have them develope the functionality you want to copy from scratch. Sounds like some climate modelers need to try the method … or at least do some serious code analysis looking for shared sections and have them reimplemented independently.
It would have been so much better if you’d just had the name of the Dutch scientist right. It is Van den Budenmayer!
How can we believe anything you say if you can’t even get the name right? Pah!
[Response:Must be a different guy. I’m talking about the colleague mentioned in the acknowledgements of this paper. -stefan]
It’s probably a bad idea to publish satire in a climate blog. In a few days thisarticle will by cited on WUWT and pompously editorialized about on Forbes. It will end up being the 2123rd “final nail in the coffin” of AGW theory.
Good to have this sorted at last. Have to say ‘though, that the ICHEAT methodology has been a great help in efforts to extract useful interpretations from recalcitrant data as attested, for example, by the outstanding efforts of Drs Roy (Julie) Christie and John (Woy) Spencer, not to mention the clever applications of Professor Mitt Linzwest (and others).
And it’s great to see how this very special-ised methodology has been embraced by the hoi polloi, to such an extent that a complete absence of scientific insight is no longer a hindrance to the very productive data “re-interpretation” that we see at all corners of the Internet!
You should publicize those first graphs more, perhaps make it a quiz where people have to guess the trend in them after they are shown the temperature trend. Is there any reason to think that PDO is affected by the CO2 or the sun/cosmic rays?
If they are all uncorrelated then it won’t be pretty if they all point the same way. What temp rise per decade would we get then.
(thought you were just going to say the the temp graph was upside down because the satellites were programmed in the wrong hemisphere)
This seems to have spread into my bank’s software as well. I’m going to demand they release their code, but with no great hope that they’ll comply :(
As a game developer I’ve done the same thing many times. It’s pretty common in programming – most non programmers don’t appreciate that when you only have 1s and 0s -1 is as good as 1, but takes up half the memory. All of the really cheap sites on the web use -1s and the letter o. It keeps the costs down. Happy -1th of April.
Not so new, first proposed by Avril le Fou
Nice april fools joke.
April Fools’ Day!?
But anyway a good check on knowledge and logic.
I am a lay person!
Pieter
Are de GHG, stupid
Brilliant, ANOTHER climate conspiracy from the alarmists! I aim to be the Prometheus in this situation, by which I mean I will deliver your remarks straight to Fox News for immediate dissemination.
However, being a humble man, I will not use my own name, as I wish no fame for myself for reporting this “discovery.” Also, I wouldn’t want to get famous on this particular day, since April is of course Hitler’s birth month.
While we argue and discuss this and that, seemingly going around in circles, but also maybe getting somewhere, step by step, here is my new book about POLAR CITIES that everyone dismissed so vehemently three years ago.
TRAILER VIDEO for “POLAR CITY RED ” – sci fi novel by Jim Laughter
http://www.youtube.com/watch?v=zxmtHvIzuQY&list=LLJnOfTO5xqGrbqM202HK_nQ&feature=mh_lolz
POLAR CITY RED info link:
http://pcillu101.blogspot.com
I’m missing something here, how does an error in the code for a computer model make a difference in the observational data series you’ve shown? Has ICHEAT been used to produce final numbers for all these data? That is, has the PDO etc. been different than we thought? You really need to explain things better before weird memes propagate.
I am not sure I grasp the relevance of a computer bug to the data measurements shown in the Figures above.
Could you elaborate on just what the “paradox” of data observations being anti-correlated with expectations has to do with a computer fudge factor?
Thanks.
Gillard has obviously taken your important new finding seriously.
http://anhonestclimatedebate.wordpress.com/2012/03/31/breaking-julia-gillard-repeals-carbon-tax/
As a resident artsie here at RC, I share your embarrassment not a whit!
However, in order to begin to right the cosmic balance again (so to speak), I will ask a (perhaps foolish) question: does this mean that the long-standing and very well-accepted ‘pirate effect’ and ‘sheep albedo effect’ are now of the wrong sign?
If so, your travails are surely not over…
Let’s see now…today is what?
A very dangerous April Fool’s joke. Betcha Watts swallows it….and from then on it will be immortal in the blogosphere
The people who think Stephen Colbert is a conservative will take ICHEAT to be fresh evidence of a scandal.
I was about to sputter with rage, but then I noticed the date–nice one!
Nice ;-)
I was reading the last few lines when I suddenly realised, that also this theory will be falsified. Very soon, I think. Maybe already tomorrow.
Re; ‘ . . We will keep you updated here at RealClimate, of course.’
Once a year will be quite enough, thank you.
Thanks for the hard work RC.
Unfortunately, I believe you have the start date incorrect. The issue pre-dates Van den Budenmeyer by a couple decades. There are also reports from the astronomical community coming out that ICHEAT has been applied even earlier to the faint young sun “problem,” but it turns out stellar luminosity actually goes down with time!!
This correction now explains why Mars has evidently cooled over geologic timescales, and beautifully explains the transition from greenhouse to icehouse climates over the last several tens of millions of years. It turns out that Earth is inevitably headed for a snowball state sometime soon, depending somewhat on the size of the sheep-albedo feedback (though some new minor issues open up in explaining previous, similar events).
I project that next week someone will get real and find the Fortran variable UCHEAT in another program available as an undocumented tuning parameter.
I have to say that, while potentially embarrassing, I would much rather this news be broken honestly, on a reputable climate science blog like this one, as opposed to entering the media through some denialist source. Mistakes are part of the scientific method, and I’d much rather our side keeps the moral/scientific high ground by being honest about mistakes when we find them. So, thanks for posting this.
Is this an April fool joke? Could you show a graph of a climate variabile where ICHEAT is -1 vs +1? You have only shown graphs where the system does not respond as naively expected.
Didn’t expect German climate crooks to have humour.
Love it. Had to check the date!
I think you and your colleagues have more work to do. Please consider the first letter of “iCHEAT”. Everyone knows i is an imaginary number!
Dave123 @28:
I always figured that every Watts post was an April Fool joke and he just hasn’t figured how to use a calender.
Alex Harvey @7
Good to see you joining in with the April 1 jokes! Svensmark and Friis-Christensen did indeed use the iCHEAT method.
I’m not sure why everyone is releived? This is terrible news! Now we know for sure that it’s the Sun, there is sweet FA we can do about it.
Yes Elf i is an imaginary number. That is why the version that Michael Crucifix has is jCHEAT – He must have the engineering edition.
Ha!
Well done. :)
Time to see who it spreads to.
I saw the ICHEAT as a reference to Fortran using variables beginning with I…J as integers.
This ICHEAT seems to be a useful subroutine – to bad it has been exposed. When word about this gets out to the deniersphere, this is going to create problems. Think of the headlines it will make: SCIENTISTS SCREW UP THEIR DATA USING ICHEAT! OMG, all those hefty paychecks from the government will dry up, and all you guys will have to get REAL JOBS!
:-P
On a more serious note:
How many climate change deniers does it take to screw in a light bulb?
None. They only know how to screw the planet!
Dang! You had me for a bit. Not till I started reading the cosmic ray section did I realize what you were doing. :-) Nicely done.
Looks like as the latest Forbush decrease has confirmed the Svensmark’s hypothesis.
http://www.vukcevic.talktalk.net/Ap-Cl.htm
Amazing, I made it all the way to the line about solar activity and ran right smack into the words ‘coincides with the deepest solar minimum’ when I realized the paradox was the relationship between the science outlined in the article and the time segment on a per anum scale. If the time segment occurs on a particular the ‘Wrong sign paradox’ make perfect sense to those that understand the coincidence factor. This also proves that if you choose your data correctly correlation handily proves causation.
The relationship immediately became obvious and suddenly I realized that we’ve all been thinking about this wrong-headedly. This goes to the opposites attract theory. When two opposites come together in a binding relationship it is well known that bliss ensues until of course the opposites come to the notion that they do have something in common – the fact that they are opposite. This is akin to anti-matter/matter interaction at that point.
po’ po’ po’