
Last June, during the International Polar Year conference, James Overland suggested that there are more cold and snowy winters to come. He argued that the exceptionally cold snowy 2009-2010 winter in Europe had a connection with the loss of sea-ice in the Arctic. The cold winters were associated with a persistent ‘blocking event’, bringing in cold air over Europe from the north and the east.
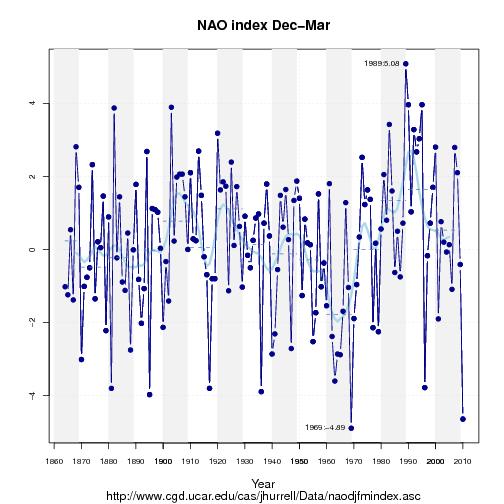
Last year’s cold winter over northern Europe was also associated with an extreme situation associated with the North Atlantic Oscillation (NAO), with the second lowest value for the NAO-index on record (see figure below).
I admit, last winter felt quite cold, but still it wasn’t so cold when put into longer historical perspective. This is because I remember the most recent winters more vividly than those of my childhood – which would be considered to be really frosty by today’s standards. But such recollections can be very subjective, and more objective measurements show that the winters in Europe have in general become warmer in the long run, as explained in the German blog called ‘Wissenlogs’. If there were no trend, then such a low NAO-index as last year’s would normally be associated with even colder conditions over Europe than those observed during the previous winter.
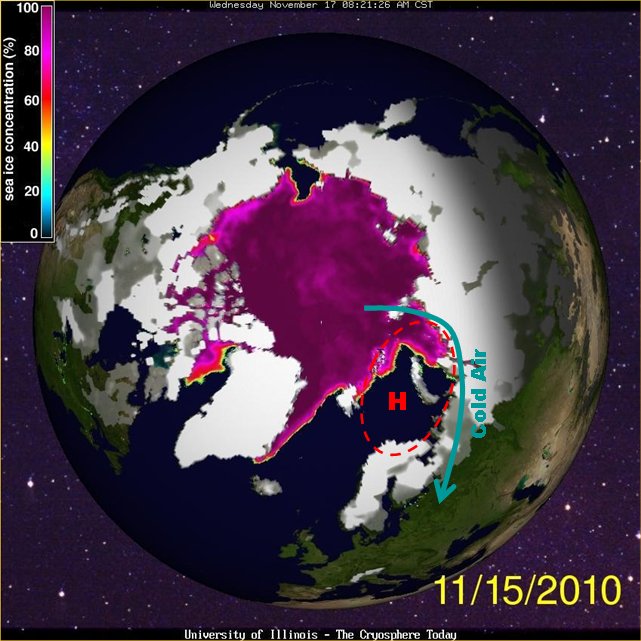
In a more recent press-release, Vladimir Petoukhov and Vladimir Semenov, argue that Global Warming could cool down winter temperatures over Europe, and a reduced sea-ice extent could increase the chance of getting cold winters. Also they propose that cold winters are associated with the atmospheric circulation (see schematic below), and their press-release was based on a paper in Journal of Geophysical Research (JGR), which may seem to have a serendipitous timing with the cold spell over Europe during the last weeks. However, the original manuscript was submitted in november 2009 (before the statement made by James Overland) and accepted in May 2010. One could regard the paper more as a ‘prediction’ rather than an ‘explanation’.
Although Petoukhov and Semenov’s findings sound plausible, I don’t think they are as straight-forward as they initially seem in terms of their implications for this winter either. For one thing, it is impossible to prove that one single event is due to a change in the long-term, as we pointed out for the case of hurricanes (The 2010 hurricane season this year, by the way, was quite active).
I think it is important to keep in mind that the Petoukhov and Semenov study is based on a global atmosphere model that simulated a non-linear response to the loss of sea-ice in the Barents-Kara seas: initially warm winters, followed by cold, and then warm winters, as the sea-ice extent is gradually reduced.
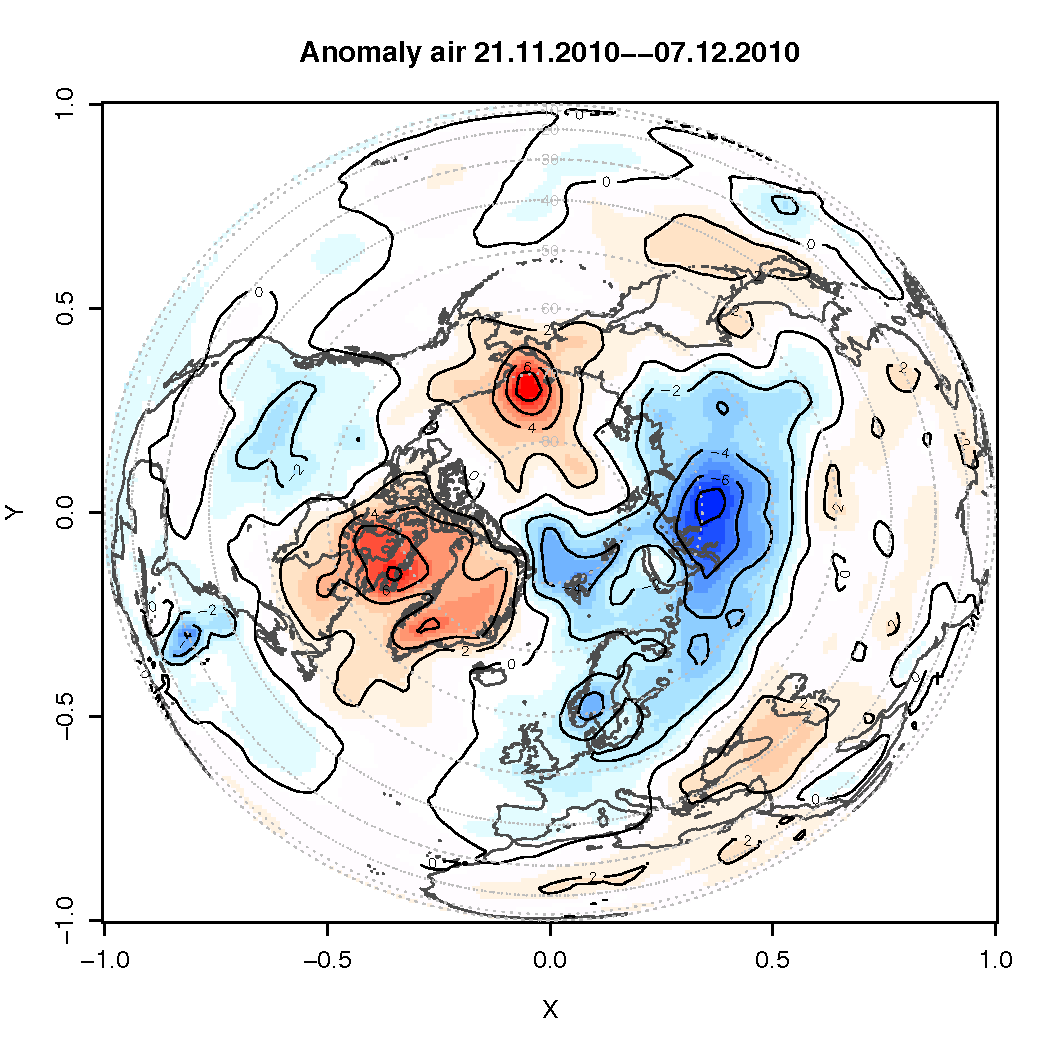
One interesting question is how the Barents-Kara sea-ice affects the winter temperatures over the northern continents. By removing the sea-ice, the atmosphere above feels a stronger heating from the ocean, resulting in anomalous warm conditions over the Barent-Kara seas. The local warming gives rise to altered temperature profiles (temperature gradients) along the vertical and horizontal dimensions.
Changes in the temperature profiles, in turn, affect the circulation, triggering a development of a local blocking structure when the sea-ice extent is reduced from 80% to 40%. But Petoukhov and Semenov also found that it brings a different response when the sea-ice is reduced from 100% to 80% or from 40% to1%, and hence a non-linear response. The most intriguing side to this study was the changing character of the atmospheric response to the sea-ice reduction: from a local cyclonic to anti-cyclonic, and back to cyclonic pattern again. These cyclonic and anti-cyclonic patterns bear some resemblance to the positive and negative NAO phases.
They also show a different response in surface air temperature (SAT) during December, January, and February. From their Figure 2, it is not immediately obvious from that figure that a sea-ice reduction leads to lower SAT during January. This is, however, very much in line with similar analysis that I have carried out with colleagues and struggled to find a consistent response (albeit we looked at the summer season).
But Petoukhov and Semenov provide theoretical support for their observations, and argue that the non-linear response can be explained in terms of ‘convectional-frictional’ and ‘baro-clinic-frictional’ mechanisms. The former includes warming over the areas where sea-ice disappear, and changes in the vertical temperature gradients, stability, and hence friction, while the latter involves a change in the surface friction force associated with temperature changes over distances.
I think that the scientific community will need some time to confirm this link, and there are some
important caveats: For one thing, the spatial model resolution (the size between the boxes in the grid mesh, through which the models represent the world) has an influence on their ability to represent blocking frequency. Hazeleger et al. Has observed that “… different horizontal resolutions … confirm the resolution-dependence found in NWP [Numerical Weather Prediction]”. The atmospheric model used by Petoukhov and Semenov has a fairly coarse spatial resolution (2.8 degrees x2.8 degrees), and it is legitimate to question whether it can reproduce the
frequencies of blocking events realistically, and whether that has a bearing for the conclusions.
But also the fact that the sea-surface temperatures (SSTs) were fixed in these experiments may affect the conclusions. Balmaseda et al. found that the atmospheric response to changes in sea-ice conditions may depend on the background SSTs, at least for the summer months. They also compared results from a coupled ocean-atmosphere model with the results from an atmosphere model for which the SSTs were given. Their unexpected finding was that the atmospheric response in these two cases were very different.
In fact, global atmospheric and climate models are better at describing the large picture than more regional and local characteristics. There is a limit to what they are able to describe in terms of local regional details, and it it reasonable to ask whether the response to changes in regional sea-ice cover is beyond the limitation of the global model. If different models give different answers, then it is likely that the response is not robust.
Another interesting question is whether the sea-ice the is whole story. Not long ago, there were some suggestions of a link between low solar activity and cold winters (this correlation, however, is so weak that you would never notice without statistical analysis. Also see comment here). Do these factors affect the circulation patterns over the North Atlantic? The sunspots tend to vary on a time scale of 10-12 years, but the NAO-index suggests that few of the extreme low values were repeated over two subsequent years. In other words, the NAO doesn’t show the same persistence as the sunspots. It will be interesting to see if this winter will break with previous patterns – if it does, that could be interpreted as a support of Petoukhov and Semenov hypothesis.
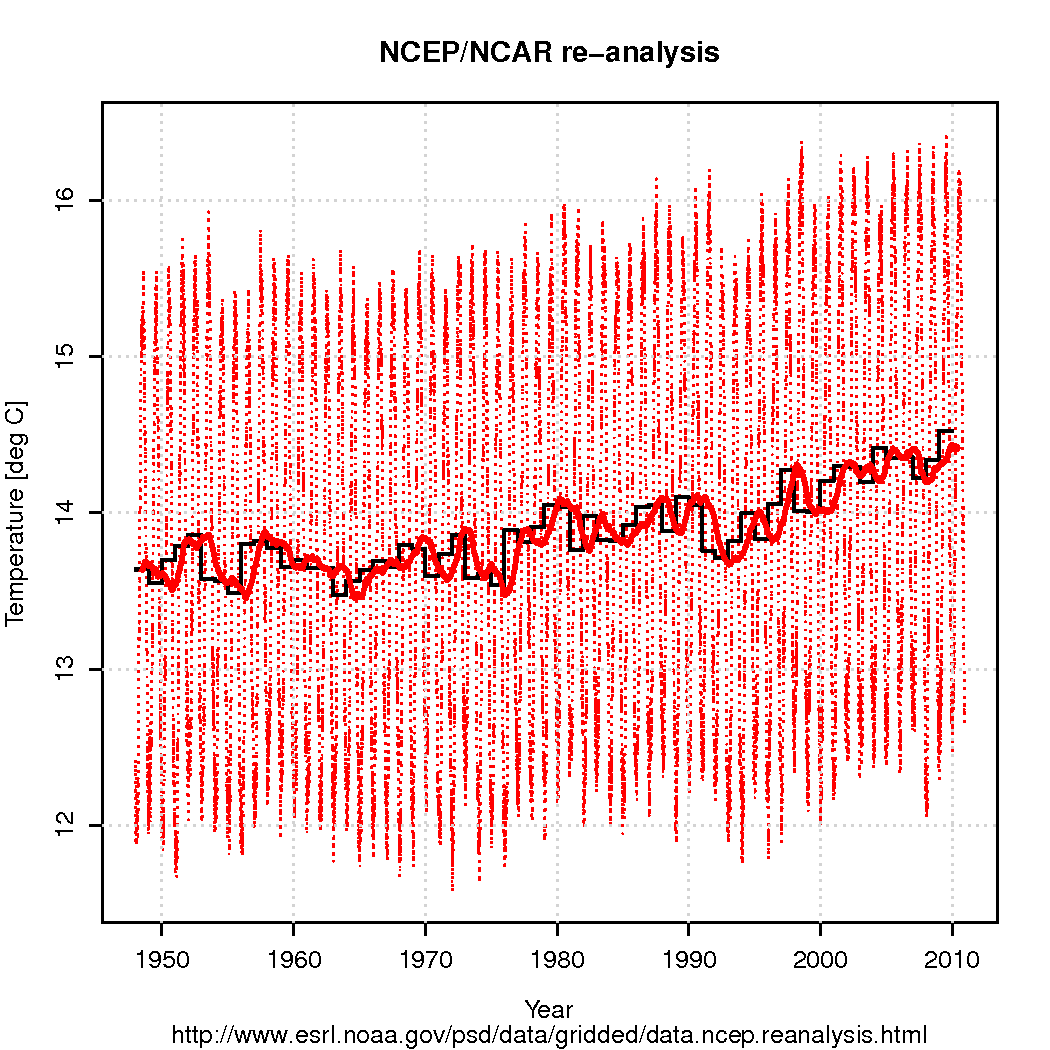
It is nevertheless no contradiction between a global warming and cold winters in regions like Europe. Rather, recent analysis suggest that the global mean temperature is marching towards higher values (see figure below), and Petoukhov and Semenov argue that the cold winter should be an expected consequence of a global warming.
> for years we heard of the “fact” that warmer weathers
> were the consequence of global warming, and that children
> in Great Britain would grow up without ever experiencing snow.
If you rely on bloggers and PR sites for your facts, no wonder you’re perplexed.
Can you cite those claims you “heard of” to science journals?
Let us know what source you’ve been trusting.
Petoukhov and Semenov study discusses cold NAO+ winters. It does not cover NAO- winters at all. It also does not link CO2 to NAO- conditions in any way.
Thus it is very misleading to discuss Petoukhov and Semenov study together with 2010-2011 winter, since it does not apply to this winter.
Re #248, Esop:
The Arctic north of 80° N constitutes just 0.76 % of the Earth’s surface. Spatial variability is rather small, but day-to-day variability is rather high. It’s a pronounced spike, but not unprecedented:
Daily 2m temperatures north of 80° N, NCEP Reanalysis 2 (running mean of 6-hourly values)
Blue: mean of last 31 years, green: mean of last 5 years, red: 2007/2008, black: 2010, other individual years from light gray (1979/1980) to dark gray (2009/2010). The even warmer spike last week is 1986, the highest spike in December is 2002. It makes more sense to look at the difference between both means, which are just 13 years apart (center of each period).
To compare: North pole (actually the mean of the northernmost gridpoints at 88.54° N), Arctic ocean (all non-land grid points north of the Arctic circle), Arctic, Greenland, Arctic circle, global, global (land), global (ocean) (including ice-covered oceans and great lakes).
To illustrate how warm parts of the Arctic is right now, here is the 8 day forecast for Bjørnøya (Spitsbergen), at 74.5 deg latitude:
http://www.yr.no/sted/Norge/Svalbard/Bjørnøya_radio/langtidsvarsel.html
Forecast for December 29th is +2C and rain. No wonder the sea ice is melting up there.
Wonder if sun spotters like Pierce Corbyn et.al have any comments or forecasts for the high Arctic.
Re #245, Anne van der Bom:
Long range weather forecasts are possible and there are many of them. They’re just very different type of forecast than short range forecasts, and both are different from climate forecasts. Typically they can say things like “probability of a cold next winter at X is increased from 33% to 40%”. Skill tends to be positive, but much of it depends on ENSO predictablity and SST persistance. Skill for Europe is near zero, but forecasts are usable for much of the tropics.
[more links to come, but need to resolve what is considered spam]
My previous post got lost in moderation. to sum up it was ref to a New Scientist article saying the recent lack of sunspots could be a cause of the recent cold winters. The Little Ice Age which caused very cold weather in Europe was characterized by a lack of sunspots. If so it is happening independently of climate change.
Seasonal forecasts for Nov/Dec/Jan in Europe:
IRI: Oct Sep Aug Jul
MetOffice: Oct Sep Aug
CFS: Oct Sep Aug Jul
Hank Roberts:
for years we heard of the “fact” that warmer weathers > were the consequence of global warming, and that children > in Great Britain would grow up without ever experiencing snow.
If you rely on bloggers and PR sites for your facts, no wonder you’re perplexed.Can you cite those claims you “heard of” to science journals?
Let us know what source you’ve been trusting.
The quote by Dr. Viner has been widely circulated and I assume he has never denied or retracted it. Nevertheless, in case you have never seen it here is the original newspaper article:
http://www.independent.co.uk/environment/snowfalls-are-now-just-a-thing-of-the-past-724017.html
Quote:
However, the warming is so far manifesting itself more in winters which are less cold than in much hotter summers. According to Dr David Viner, a senior research scientist at the climatic research unit (CRU) of the University of East Anglia,within a few years winter snowfall will become “a very rare and exciting event”.
“Children just aren’t going to know what snow is,” he said.
The effects of snow-free winter in Britain are already becoming apparent. This year, for the first time ever, Hamleys, Britain’s biggest toyshop, had no sledges on display in its Regent Street store. “It was a bit of a first,” a spokesperson said.
Fen skating, once a popular sport on the fields of East Anglia, now takes place on indoor artificial rinks. Malcolm Robinson, of the Fenland Indoor Speed Skating Club in Peterborough, says they have not skated outside since 1997. “As a boy, I can remember being on ice most winters. Now it’s few and far between,” he said.
Michael Jeacock, a Cambridgeshire local historian, added that a generation was growing up “without experiencing one of the greatest joys and privileges of living in this part of the world – open-air skating”.
…
David Parker, at the Hadley Centre for Climate Prediction and Research in Berkshire, says ultimately, British children could have only virtual experience of snow. Via the internet, they might wonder at polar scenes – or eventually “feel” virtual cold.
Heavy snow will return occasionally, says Dr Viner, but when it does we will be unprepared. “We’re really going to get caught out. Snow will probably cause chaos in 20 years time,” he said.
The chances are certainly now stacked against the sortof heavy snowfall in cities that inspired Impressionist painters, such as Sisley, and the 19th century poet laureate Robert Bridges, who wrote in “London Snow” of it, “stealthily and perpetually settling and loosely lying”.
Not any more, it seems.
dhogaza: “And the west coast, too, which has been on the receiving end of a series of “pineapple express” storms.
Pineapples don’t grow where it’s cold, and those storms don’t bring cold weather. Currently Portland, Oregon is right on average, slightly warmer at night and slightly cooler during the day.”
They aren’t called “pineapple express” storms because the local temperatures are high. They are called that because of where they originate. Temperatures in the entire state of California have been below average for all of 2010.
I would suggest not using short-term local or regional conditions to try to illustrate or prove that global temperatures are rising. California had a very pleasant and balmy year, and we don’t think that proves anything.
Don Shor:
Apparently it’s fairly rare, because Heathrow was crippled by a mere 5″ of it, and it’s certainly been exciting for those trapped there five days …
Yes, they come from the general direction of Hawaii, and when they arrive on the West Coast they are warm. Here in the PNW, when they arrive late enough in the year that deep snow has accumulated in the Cascades, the wet, warm rain associated with them lead to massive floods due to melting massive amounts of snow.
Thus the Christmas Flood of 1964 and the 100-year flood of 1996, each of with came within a foot or so of topping the seawall along the Willamette River.
Temps in December of 60 degrees or so (as happened due to the Pineapple Expresses that triggered those two floods) are warmer than average, whatever their reason. It’s not been that warm this year, but the Pineapple Express that triggered the first heavy snowfalls in the mid-West did cause above-average temps here (and moderate flooding).
I’m not, indeed I’m fighting those that argue that cold weather in the mid-west and parts of the east coast is indication that global warming is a fraud, not happening, blah-blah. My post and the one I responded to were clear as to their purpose.
SM,
http://www.guardian.co.uk/media/2008/apr/28/pressandpublishing.climatechange
Try here (remember, climate is a longterm trend, and personal opinions are not refereed).
http://scholar.google.com/scholar?hl=en&as_sdt=2000&q=+climate+change+snowfall+England+Britain+UK
Andreas
Long range forecasts dont stand a chance if they do not include Arctic (more than 65 degrees North) sea ice conditions. Of which there will be talk at the pubs about the winter (soon without snow) being radically strange.
And this is in essence the climate change we all been talking about…
Quick off-the wall thought pertaining to atmospheric circulation:
(these are not causal links, these are proposed analogies)
QBO ~ sunspot cycle
ENSO,NAM(AO?),SAM ~ Earth’s magnetic field reversals
At 246, I mentioned current weather phenomena in the northeastern NA, as differentiated from general NA conditions. This may have been taken as an indication that I thought it was a result of climate change. My intention was to note a regional difference in weather and whether it is related to the patterns noted in the northeastern Atlantic.
Re #262, wayne davidson:
Long range forecasts do include sea ice. Some models are still very primitive, but they are getting more advanced. CFS will get a reasonable sea ice model next month. Met Office made a projection of September 2010 Arctic sea ice extent based on its seasonal forecast:
http://www.arcus.org/files/search/sea-ice-outlook/2010/07/pdf/pan-arctic/mclarenetaljulyoutlook.pdf
Andreas #253
Review your basic calculus; the Arctic north of 80° N constitutes 8.68 % of the Earth’s surface.
Brian (266), that can’t be right, can it? Eyeballing it indicates that the northern hemisphere then has more than 75% of the earth’s surface. I guess I’d better dust off my sliderule.
“In the Northern Hemisphere, the ratio of land to ocean is about 1 to 1.5. The ratio of land to ocean in the Southern Hemisphere is 1 to 4.”
http://www.eoearth.org/article/Ocean
Rod B #267, Oops! Nevermind #266.
Mixed up sine and cosine! 8.68% is surface area between 0 and 10 degrees N.
Andreas wrote in 253:
Brian Brademeyer wrote in 266:
Eyeballing it there is already a problem. At 80° the difference in latitude is only one tenth of the Northern Hemisphere. You have the Southern Hemisphere to consider — and then the narrowing of longitude as you move towards the poles. A bit like as you move towards one of the the points of a triangle, except this is a spherical triangle with the equator as the base. So clearly it can’t be 8.68%.
My calculus is rusty, but I seem to remember that the Peter’s Projection is area proportional. To create a Peter’s Projection map you place a sphere inside of a cylinder then project light from the polar axis through the sphere to the cylinder.
This means that the vertical position of a point will be proportional to the sine of the angle. So 80° latitude is at 0.985 the height of the sphere — which is proportional to the area from the equator to that latitude. This means the area from 80°lat to the North Pole constitutes 1.52% the area of the Northern Hemisphere. Divide that by two and I get 0.76% the area of the sphere.
Andreas was right.
#262 (Wayne): Based on the statistics since 1988, the prediction would probably be right (positive NAO in January in 18 years out of 23.)
Negative NAO in January in only 5 of these years, but the last two were last winter and the one before that. Looking at the long term NAO forecast (NOAA), the index seems to go slightly positive right after New Year, but looks like it will go very negative again shortly after.
Timothy Chase,
We’re dealing with solid angle–2pi*rcos(theta)/4pi~8.6%
The fraction of a hemisphere poleward of a latitude theta is 1 – sin(theta). Thus there is 100% north of the equator and 0% north of the north pole.
This only applies to a perfect sphere.
Ray Ladbury wrote in 272:
Here is a quick thought experiment. Take the circular region from 80°N-90deg;N. Create a copy but shifted 10° latitude so that they touch but do not overlap. Now create another copy shifted in the same direction another 10° latitude so that it touches the previous one but does not overlap. Now keep doing this until your last copy touches the original copy. You now have 18 copies.
If the original area was 8.6% of the globe as you contend then the total area of the original and the copies would be more than 154% of the globe, covering it, covering half of it again — and then having some left over. But clearly the area total area of the original and all those copies is much less than the total area of the sphere.
In terms of solid angles I would recommend the following page:
http://mathworld.wolfram.com/SolidAngle.html
From this we get the equation:
dΩ = sin(φ) φ θ
… but φ is the polar angle of colatitude rather than latitude. (ibid.)
Now we can integrate over θ from 0 to 2π first, then integrating over φ we get 4πR(1-cos(φ)) where R is the radius of the sphere. But we can divide by 4πR as we are concerned with the fraction of the total area of the sphere. This leaves us with the very same equation I derived based upon my recollection of the Peter’s Projection in 270.
PS For a polar angle of 10° — going from the North Pole to 10°(co-)latitude south of the North Pole and where we are first integrating over one full turn around the North Pole — we get ~0.76% of the area of the sphere. For those who might be a little rusty regarding integrals (as I am a little rusty) the integral of sin(φ) is -cos(φ) so the integral with a lowerbound of 0° and an upperbound of Φ the integral of sin(φ) becomes 1-cos(Φ).
CORRECTION
Where I stated above in the comment prior to the PS:
… that should have been 20, not 10. But there will still be 18 of the regions touching, circling the Earth along a great circle of longitude.
#262 Esop, is likely the case, -NAO with less sea ice in Nov-Dec. Low pressure systems penetrate and especially are maintained longer at higher latitudes over zones transferring energy to them. Remote sensing platforms may detect the higher heat flux areas:
http://www.esrl.noaa.gov/psd/map/images/olr/olr.png
perhaps the models incorporate this data. But I don’t see a greater variance due to thinner and thicker sea ice.
And there is certainly wind mixing causing a distorted image.
Cyclones “sculpt” high pressures in shape and position. This morphing occurs fast if cyclones are devoid of heat sources. As there is more Arctic heat sources, the lows transform the climate with steadier flows. I believe that this apparent steadiness is what is causing abnormal temperature changes in some regions.
Andreas #265
“CFS will get a reasonable sea ice model next month”. Better late than never…
Another CORRECTION to 274:
I was missing a couple of ds.
I had written:
… but that should have been:
dΩ = sin(φ) dφ dθ
… where φ is the colatitude (equal to 0 at the North Pole, but π/2 at the equator) and θ is the longitude, Ω the “solid angle” or area on the surface of the sphere and d a vanishingly small difference. Nevertheless, a better way of writing this would be:
dΩ = dφ sin(φ) dθ
… since as φ tends towards zero and thus we move closer to the North Pole the lines of longitude converge whereas the distance between the lines of colatitude (or alternatively, latitude) remains the same. sin(φ) may therefore be regarded as a scaling factor for dθ that takes into account the convergence of the lines of longitude as one approaches the pole. Thus one is essentially calculating the area dΩ of vanishingly small rectangles of height dφ and width sin(φ) dθ then adding the areas of the vanishingly small rectangles to come up with the total area of the solid angle on the surface of the globe.
Incidentally, as the cosine of the colatitude is equal to the sine of the latitude Barton Paul Levenson’s solution is equivilent to mine.
The surface area of a zone is proportional to its height. Total height of a sphere with radius 1 is 2. So a zone between latitudes θ1 > θ2 has a relative area of (sin(θ1) – sin(θ2)) / 2. Thus, for θ1 = 90°, θ2 = 80° the relative area is (sin(90°) – sin(80°)) / 2 ~ 0.0076.
So many record cold winters globally. That is not what the IPCC report has been saying.
[Response: Or indeed, the data. PS. It’s a holiday, please take a break. – gavin]
I happen to have Peter’s projection (Timothy #270) world map on my wall. The description on the map explains that it:
The part from 80-90° north is 3mm high and the entire map is 510mm high, making the northern 10° 0.6% of the total. Allowing that measuring my map with a ruler is not that accurate and the projection method could have some round-off error, this is in the right ballpark for Andreas’s (#279) 0.0076.
Timothy, you’re right, of course. My fault for going from memory rather than doing the math.
Ray Ladbury wrote in 282:
If you hadn’t disagreed I would still be stuck at the level of, “Well, its like that guy Peter and his projection, you know…” Heck, long division was making me break into a cold sweat a few months back. And I used to be good at calculus. Currently my textbook is up there with The Republic, patiently waiting for me like a prodigal son.
Andreas wrote in 279:
Maybe the bit about Peter’s Projection wasn’t that far off afterall. But essentially what you are doing here is the same as Barton Paul Levenson, except with two bounds rather than just one.
I should have followed the links that Andreas had given before responding.
Andreas wrote in 279:
A brief explanation of Archimedes’ Hat Box Theorem can be found here, but the one you give here is much more rigorous, a demonstration video can be found here, and the explanation of the Hat Box Theorem directly corresponds to the description of Peter’s Projection given here. A formula and actual map is given here.
Incidentally, this is what the author at the first link I gave has to say:
PS
Actually the fellow at:
The Peters Projection
http://www.chaos.org.uk/~eddy/math/peters.html
… and I both had it wrong. What we were describing is the Lambert Equal Area Projection. The Peters Projection introduces a scaling factor that stretches things vertically at the equator so as to eliminate the distortion at precisely 45° latitude — the standard parallels. However, the Lambert Equal Area Projection has no such factor and thus the distortion vanishes at the equator. It exactly corresponds to Archimedes Hat Box Theorem.
The Sunday NY Times has as op-ed by Judah Cohen in which he attributes the cold winters in the NH continents to increasing snow cover in Siberia. It was pretty superficial, so I did a Google Scholar search of him and came up with quite a lot of interesting stuff. I mostly have just read the abstracts of several of the papers he has co-authored. I would be interested in comments on this from Rasmus and others. At first glance it would appear that there are a lot of interconnected processes set in play by Arctic warming and the loss of sea ice, with all kinds of complex feedbacks. He argues that Siberian snow cover as the key predictor, but surely it all begins with Arctic warming and sea ice loss.
There is an editorial at the NY Times by Judah Cohen ascribing the large AO to increased autumn snow cover albedo in Siberia.
And there is an recently published paper In AGR talking about the same effect.
The Met Office just released a map showing the temperature anomalies for the period Dec 1-20:
http://i.dailymail.co.uk/i/pix/2010/12/21/article-1340436-0C8D98CF000005DC-966_634x366.jpg
re 287/288 on Judah Cohen – Remember correlation is not causation, no attribution from Cohen. Cohen is in the business of making the 3-6 month forcasts someone here was asking for – meteorology, not climatology. See Snow Domes and Crystal Balls in this Newsweek pdf.
Andreas,
24 December 2010 at 6:45 PM
True, but I would go as far as calling that the ‘accurate predictions’ that Matthew is asking for.
Cohen’s work isn’t directly related to climate change. He operates a commercial seasonal forecast product, where the extent of October snow cover in Siberia / Eurasia is a key predictor, based on its correlation to the Arctic Oscillation of the following winter.
Early snow cover in Siberia is assumed to be persistent until winter. It allows the establishment of a high pressure system over Siberia which leads to warming in the stratosphere that descends to the Arctic troposphere in January. Result is a warm Arctic and a cold temperate zone, particulary the northeastern US and eastern Europe.
Although the forecast isn’t based on climate change, sea ice conditions in the Arctic Ocean most likely do have some influence on early snow cover in Siberia. There’s a clear trend in October snow cover, but it changed sign after reaching a low in the late 80s / early 90s. The most recent trend is still unclear. 2007 and 2008 had the smallest snow cover extent since 1994, but 2009 returned to more snow cover than normal. 2010 is still above normal.
It is notable that the prediction that global warming may cause colder winters in Europe is only news when the winters in Europe become colder than usual. While we were having milder than average winters,then these were presented as evidence of global warming. You need to be careful. What does global warming science predict for the next 5 years (on average). Colder,or warmer? From what you say today, it should be colder. But what will you say if we now have another spell of milder winters in Europe? That they’re due to global warming?
[Response: Who is “you”? On average winters are getting warmer and will continue to do so. Discussing other possibilities for influences on circulation patterns – which are quite speculative – is certainly not the same thing as stating “it will be colder”. I can’t speak for anyone else, but I have yet to find these arguments persuasive. Unfortunately though you are correct in your underlying point that these perfectly normal discussions are being presented in the media as being swings between extreme points (as if all scientists collectively change their minds every time a paper with an opposite point of view is published). The public are surely going to be confused – but this is not the fault of scientists. It is much more a problem in the media, who are very happy to find to post-hoc explanations to trumpet whenever something happens. Regardless of how well supported an idea is the headline always says “Scientists say….”. – gavin]
Also, something predicted is happening:
On the emergence of an Arctic amplification signal in terrestrial Arctic snow extent – Ghatak et al. (2010)
Would this likely cause domino or, er, snowballing effects further away?
Could someone comment of Mike Rivero’s comment on whatreallyhappened.com. Personally, I think he is correct on many political issues, but knows not his arse from a hole in the ground when it comes to climatology, except he has a huge following, and this is one of the sources behind this so-called pooh-poohing of the hard science.
[edit – text replaced with a link]
Once again it is stated that the northeastern US is in a cold temperate zone as a result of these phenomena. Whatever the models say, I have lived in it for 50 years and I can tell you that it is not cold this year so far as well as last winter. Normally we would be having cold arctic air from at least the beginning of December if not earlier. Normally we would be getting down to sub-zero F blasts. Temperatures remain in the 20s to 30sF and occasionally near 40F. If it changes, I’ll be sure to post it.
We are in a ice age. That is the devil at the root of this. It is so incongruous that we could have catastrophic warming during a geologic time scale ice age that minds are simply unable to grasp it. Even when they don’t actually know we are in an ice age because they think ice ages mean glaciation.
I suppose somewhere there is discussion of GW within the context of the current ice age but I have never seen it.
http://www.independent.co.uk/environment/snowfalls-are-now-just-a-thing-of-the-past-724017.html
http://www.springerlink.com/content/m041hm5k415464j8/
Climatic Change, Volume 74, Number 4, 413-434, DOI: 10.1007/s10584-006-3486-5
Hedonic Pricing of Climate Change Impacts to Households in Great Britain
“… This study investigates the amenity value of climate to British households. By using the hedonic price approach, the marginal willingness to pay for small changes in climate variables is derived. ….
… British people would typically prefer higher temperatures in January….”
Personally, I doubt the free market is going to take care of this. But it’s always inspiring to see the economists’ approach to these questions.
Nick Gotts at #196:
Old friend, in your daily travels, do you not ever find even the slightest bit odd that anyone who disagrees with you is always guilty of not wanting to understand, but that your own motives are beyond question? Why is it so hard for you to believe that others, equally or far more educated, can have an honest difference of opinion?