
Last June, during the International Polar Year conference, James Overland suggested that there are more cold and snowy winters to come. He argued that the exceptionally cold snowy 2009-2010 winter in Europe had a connection with the loss of sea-ice in the Arctic. The cold winters were associated with a persistent ‘blocking event’, bringing in cold air over Europe from the north and the east.
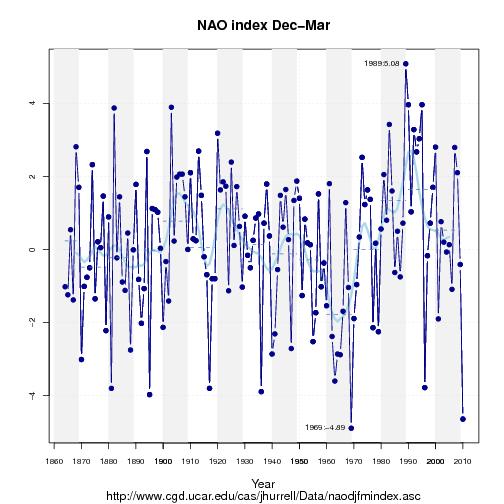
Last year’s cold winter over northern Europe was also associated with an extreme situation associated with the North Atlantic Oscillation (NAO), with the second lowest value for the NAO-index on record (see figure below).
I admit, last winter felt quite cold, but still it wasn’t so cold when put into longer historical perspective. This is because I remember the most recent winters more vividly than those of my childhood – which would be considered to be really frosty by today’s standards. But such recollections can be very subjective, and more objective measurements show that the winters in Europe have in general become warmer in the long run, as explained in the German blog called ‘Wissenlogs’. If there were no trend, then such a low NAO-index as last year’s would normally be associated with even colder conditions over Europe than those observed during the previous winter.
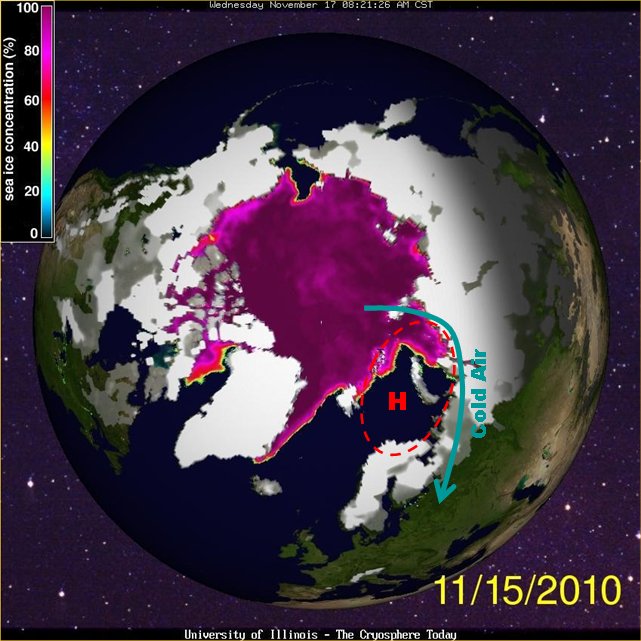
In a more recent press-release, Vladimir Petoukhov and Vladimir Semenov, argue that Global Warming could cool down winter temperatures over Europe, and a reduced sea-ice extent could increase the chance of getting cold winters. Also they propose that cold winters are associated with the atmospheric circulation (see schematic below), and their press-release was based on a paper in Journal of Geophysical Research (JGR), which may seem to have a serendipitous timing with the cold spell over Europe during the last weeks. However, the original manuscript was submitted in november 2009 (before the statement made by James Overland) and accepted in May 2010. One could regard the paper more as a ‘prediction’ rather than an ‘explanation’.
Although Petoukhov and Semenov’s findings sound plausible, I don’t think they are as straight-forward as they initially seem in terms of their implications for this winter either. For one thing, it is impossible to prove that one single event is due to a change in the long-term, as we pointed out for the case of hurricanes (The 2010 hurricane season this year, by the way, was quite active).
I think it is important to keep in mind that the Petoukhov and Semenov study is based on a global atmosphere model that simulated a non-linear response to the loss of sea-ice in the Barents-Kara seas: initially warm winters, followed by cold, and then warm winters, as the sea-ice extent is gradually reduced.
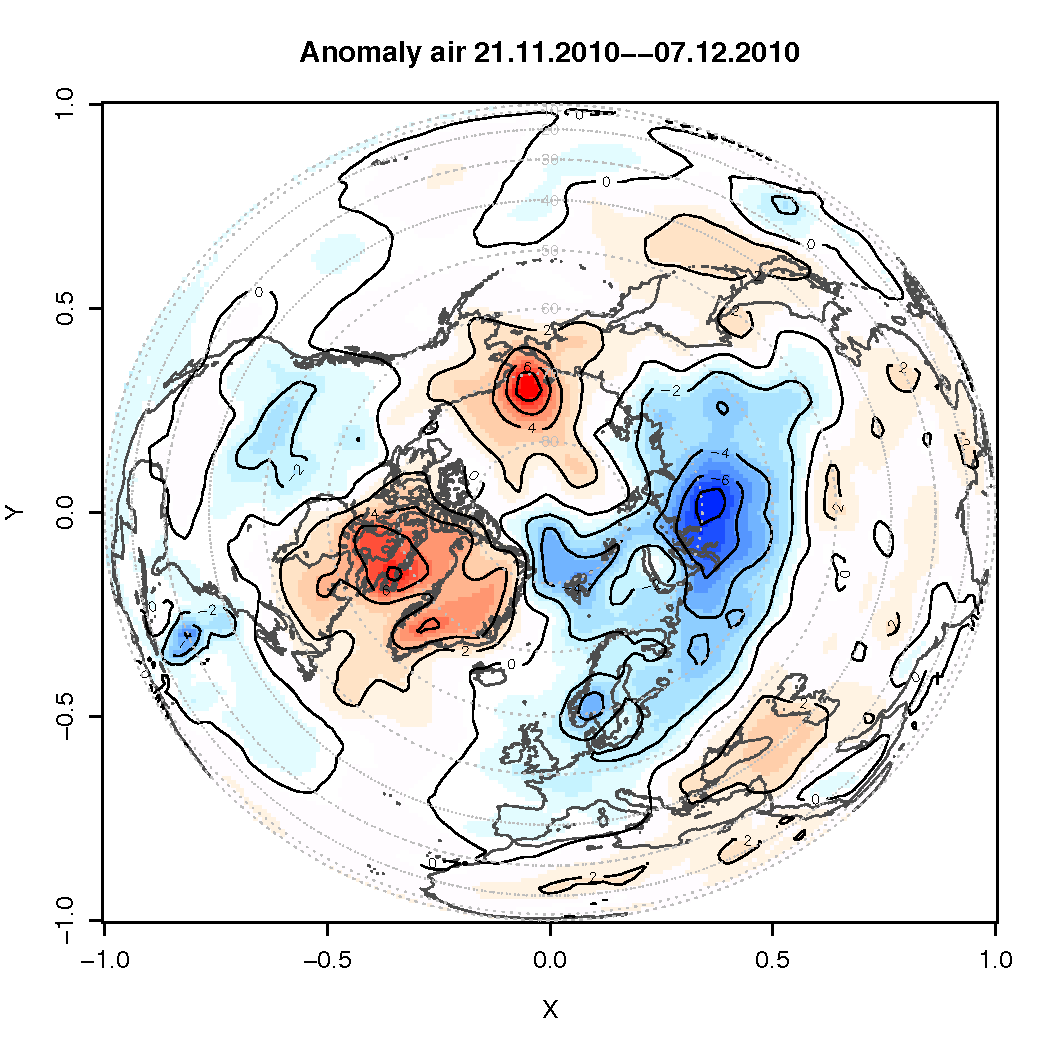
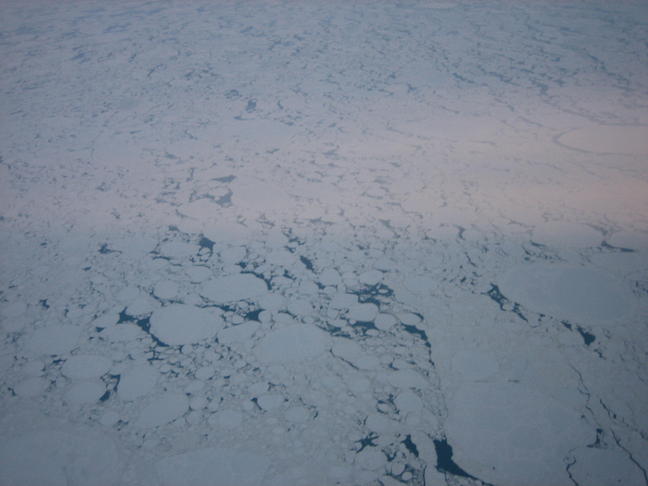
One interesting question is how the Barents-Kara sea-ice affects the winter temperatures over the northern continents. By removing the sea-ice, the atmosphere above feels a stronger heating from the ocean, resulting in anomalous warm conditions over the Barent-Kara seas. The local warming gives rise to altered temperature profiles (temperature gradients) along the vertical and horizontal dimensions.
Changes in the temperature profiles, in turn, affect the circulation, triggering a development of a local blocking structure when the sea-ice extent is reduced from 80% to 40%. But Petoukhov and Semenov also found that it brings a different response when the sea-ice is reduced from 100% to 80% or from 40% to1%, and hence a non-linear response. The most intriguing side to this study was the changing character of the atmospheric response to the sea-ice reduction: from a local cyclonic to anti-cyclonic, and back to cyclonic pattern again. These cyclonic and anti-cyclonic patterns bear some resemblance to the positive and negative NAO phases.
They also show a different response in surface air temperature (SAT) during December, January, and February. From their Figure 2, it is not immediately obvious from that figure that a sea-ice reduction leads to lower SAT during January. This is, however, very much in line with similar analysis that I have carried out with colleagues and struggled to find a consistent response (albeit we looked at the summer season).
But Petoukhov and Semenov provide theoretical support for their observations, and argue that the non-linear response can be explained in terms of ‘convectional-frictional’ and ‘baro-clinic-frictional’ mechanisms. The former includes warming over the areas where sea-ice disappear, and changes in the vertical temperature gradients, stability, and hence friction, while the latter involves a change in the surface friction force associated with temperature changes over distances.
I think that the scientific community will need some time to confirm this link, and there are some
important caveats: For one thing, the spatial model resolution (the size between the boxes in the grid mesh, through which the models represent the world) has an influence on their ability to represent blocking frequency. Hazeleger et al. Has observed that “… different horizontal resolutions … confirm the resolution-dependence found in NWP [Numerical Weather Prediction]”. The atmospheric model used by Petoukhov and Semenov has a fairly coarse spatial resolution (2.8 degrees x2.8 degrees), and it is legitimate to question whether it can reproduce the
frequencies of blocking events realistically, and whether that has a bearing for the conclusions.
But also the fact that the sea-surface temperatures (SSTs) were fixed in these experiments may affect the conclusions. Balmaseda et al. found that the atmospheric response to changes in sea-ice conditions may depend on the background SSTs, at least for the summer months. They also compared results from a coupled ocean-atmosphere model with the results from an atmosphere model for which the SSTs were given. Their unexpected finding was that the atmospheric response in these two cases were very different.
In fact, global atmospheric and climate models are better at describing the large picture than more regional and local characteristics. There is a limit to what they are able to describe in terms of local regional details, and it it reasonable to ask whether the response to changes in regional sea-ice cover is beyond the limitation of the global model. If different models give different answers, then it is likely that the response is not robust.
Another interesting question is whether the sea-ice the is whole story. Not long ago, there were some suggestions of a link between low solar activity and cold winters (this correlation, however, is so weak that you would never notice without statistical analysis. Also see comment here). Do these factors affect the circulation patterns over the North Atlantic? The sunspots tend to vary on a time scale of 10-12 years, but the NAO-index suggests that few of the extreme low values were repeated over two subsequent years. In other words, the NAO doesn’t show the same persistence as the sunspots. It will be interesting to see if this winter will break with previous patterns – if it does, that could be interpreted as a support of Petoukhov and Semenov hypothesis.
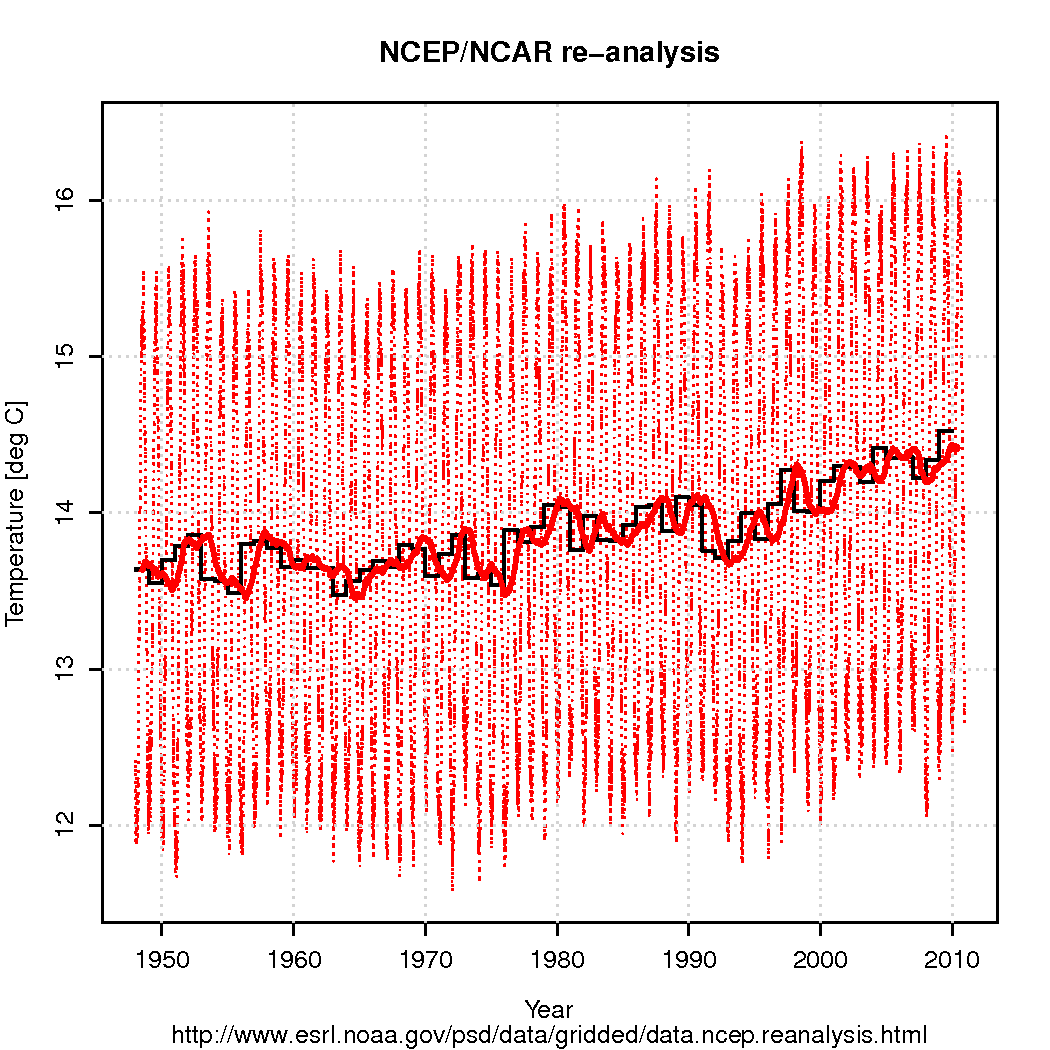
It is nevertheless no contradiction between a global warming and cold winters in regions like Europe. Rather, recent analysis suggest that the global mean temperature is marching towards higher values (see figure below), and Petoukhov and Semenov argue that the cold winter should be an expected consequence of a global warming.
Thanks for the thoughtful responses, SA and KM. I think those of us even partly aware of the full implications of our multiple predicaments end up with a kind of dual consciousness. We go about our daily lives around people who mostly don’t seem to have a clue, and try mostly to go along with their relatively non-chalant attitudes; yet when we are with our own thoughts, or visiting here, or reading the latest book or article on our increasingly dire situation, we return to the real world, one that screams out for immediate, drastic changes on every level of society. There is no one ‘right’ way to handle this disparity.
#425. You forgot the most important trend, 10000 years global trend! Global warming has a long history.
[Response: Your evidence for a 10,000 yr global warming trend? The fact that LIA glacial advance almost everywhere obliterated morraines left by every advance since the Younger Dryas would suggest otherwise – particularly in the Northern Hemsiphere. Ocean core records also show a much more nuanced picture. – gavin]
Cherrypicking is a noble art. Did you forget the 2003 heat wave in Europe? The IPCC didn’t, e.g. AR4 synthesis report p. 56
Steven,
I am sorry, but I can only give you an honorable mention for stupidity for that post. We had a guy in here last month who was arguing that the important trend was over the past 500 million years. You’ll have to try harder to reach that level of weapons grade stupidity.
Gavin’s comment to #602. ?? LIA glacial advance ?? Look e.g. at this graph (sorry about the language) : http://sv.wikipedia.org/wiki/Sverige_under_paleolitikum
10500 years ago in the Baltic region. Enormous areas under ice still 10500 years ago. No glaciers in this region during the LIA except mountain tops. As for the global figure you may have to add a few thousand years to get a strong signal which doesn’t really change anything in the argument.
[Response: Your dates are mixed up. (Believe it or not, I do actually know there was a ice age maximum a while back.) The end of the Younger Dryas (and the start of the Holocene) was around 11,500 years ago, so the glaciers you point to were long gone at 10,000 yrs ago (you are probably confusing radio-carbon age with calendar age). And as I said, there are very few morraines between the maximum extent at the Younger Dryas and the LIA, which implies that none of the Holocene advances were as cold as the LIA. Not something indicative of a even a 10,000yr ‘hemispheric warming trend’, let alone a global one. – gavin]
#425, #602, #604 with comments. OK Gavin, fair enough. You may be right about the exact dating but this is not the point and you know it. You are also aware of the ice age which means that if we take a good date then (when it WAS cold) and compare with now and take a linear trend we have global warming over this period in the linear sense.
[Response: But a linear fit over that time period is pointless – it provides no predictability at all. Similarly with a linear trend since the Eocene or Cretaceous or the Neo-proterozoic glaciation. If you are going to try and use a statistical fit to suggest something is or is not going to continue, you need to have at least some evidence that it has predictability over the range of time you are using it. Comments on the level of ‘global warming has been happening for 10,000 years’ are both wrong on the facts and on the implications. – gavin]
The whole point in this excercise was, of course, that there is no reason to stop our trends at a mere 130 years back as #425 did just because we know that at that particular time significant fossil burning started. In fact, I actually missed to make the point that YOU stressed the Little Ice Age (LIA) coldness (far more important here than the ice age). [edit]
Since we now seem to agree on a warming trend since 400 years back it should also be possible to agree that it is near impossible to decide how large part of the recent warming that is due to the continuing warming (not necessarily linear – the underlying cause is unknown) since 400 years back and which part is due to a more recent possible AGW effect.
[Response: If you are arguing that attribution of recent trends is impossible, then I obviously don’t agree. Read my posts on the subject. Similarly, I don’t believe that it is impossible to attribute variability in the pre-industrial period. – gavin]
Re #604, Steven Jörsäter:
An estimate of the timeline of the retreat of the Scandinavian ice sheet is in Boulton et al. 2001 (fig. 12). And large ice sheet extent doesn’t imply low temperatures, although they may cause negative feedback.
Andreas, thanks for the link. 0,5km/year is quite much, I reckon the edge of the weichselian sheet was largely isothermal by the fastest melt?
Hank Roberts
“[Citation needed] — are you talking about the reduction in sulfate aerosols?” :
I was talking first about the doubling of GHG radiative forcing since 1975.
http://www.esrl.noaa.gov/gmd/aggi/aggi_2010.fig4.png
I don’t think that sulfate aerosols have played a great role in this period. So very naively one would have expected at least a quadratic behavior of the temperature vs time, and a doubling of the trend. I was asking for a simple explanation of why it is not observed (and I think, even statistically fairly excluded, although I haven’t seen Tamino dealing with this issue -unfortunately his “open mind” doesn’t accept my questions anymore).
Re 608 Gilles – for a very simplified case, where T’ is temperature anomaly, RF is radiative forcing (anomaly), and F is feedback (defined here in units of radiative forcing per unit temperature; defined here to include the Planck response, so it will be negative if the climate has finite positive climate sensitivity), and C is the heat capacity (per unit area)
dT’/dt = (RF + F*T’)/C
(note that equilibrium climate sensitivity = ECS = T’eq/RF can be found by taking
dT’/dt = 0 when T’ = T’eq; so
RF + F*T’eq = 0
T’eq/RF + 1/F = 0
ECS = T’eq/RF = -1/F )
But C is effectively larger for changes occuring over longer periods of time (a greater average depth of the ocean is involved), so it’s not quite that simple. (Also, some feedbacks don’t act instantaneously in response to T’ – actually few would, but the response time for water vapor and some others is sufficiently fast relative to the response time C*ECS = -C/F (e-folding time of radiative disequilibrium RF+F*T’, where, if RF (and C and F) is constant and T’ is initially 0, T’eq-T’ = ECS*RF*exp[-t/(C*ECS)] ) that they can be approximated as instantaneous)
597 come on Hank!
Calibration of models is fundamental to any science and because somebody foolish misunderstands how that works, that makes it a ‘talking point’ that has to be shied away from?
Instruments like even thermometers are calibrated. Differential Equations are solved only if the initial conditions are included, these being a form of calibration.
Do I need to provide a list of textbooks as a citation?
Re 610 Jim Bullis – if the prediction is for a given temperature anomaly, and if you want to know the absolute temperature, just add the baseline value to the anomaly. Of course, the science is informed by observations of present/near past climate and beyond, and specifically the baseline climate state must be known to some extent in order to calculate forcing and the response even absent other feedbacks besides the Planck response (there is overlap between CO2 and H2O,clouds, greenhouse forcing depends on the temperature profile, Planck response would be different at different temperatures, etc.; and then there’s observations that inform the parameterizations of sub-grid scale processes)
However, the observed change in climate is not generally used to calibrate models – hence it is a test of models to predict that change. Which is not to say that statistical analyses have not been done (some have been done famously poorly).
SecularAnimist @ 596:
I think that it’s very convenient to blame others for why “Global Warming” seems to be so thoroughly rejected by some, while utterly ignoring the criticisms of how “Global Warming” is being sold.
A lot has been made about how manufactured crises are used to raise money and pads ones wallet at the expense of the people who are being led around by the nose, hoping to prevent whatever ill or evil is about to happen. People have become cynical about what’s going to happen and who bad it’s going to be if we don’t give, give, give. To me, that’s a much better explanation. Given the “We never said there was Global Cooling in the 1970’s!” attitude I find here and elsewhere, I have little or no hope that “Global Warming” will stop being viewed as a manufactured crisis until it’s entirely too late.
Meanwhile since we are talking floods, Brisbane is heading for what would probably be a record flood if we didn’t have flood mitigating dam, Wivenhoe, completed in 1984. The last figure I heard was Wivenhoe was at 173% where 100% = normal storage capacity and 200% = flooding the top of wall. So we are fast reaching the point where releasing water at low tide (the Brisbane is a tidal river) no longer exists. Without the dam, we would easily have reached the 1974 flood level, possibly the even higher 1893 flood level. Two once in a century floods in 36 years doesn’t in itself support a claim the climate is changing. But add up all the data points worldwide, and you have to wonder when it will become clear that the cost of business as usual is much higher than cleaning up the energy economy. This is after all when we are at only 0.8°C of global warming. What will 2° or 3° do to intensifying the hydrological cycle?
#613 Philip
That is exactly what I have been banging on about in this thread!
In your comment you say “Two once in a century floods in 36 years doesn’t in itself support a claim the climate is changing” – then you go to draw that exact conclusion – and you go on to say that cleaning up the “energy economy” is the solution.
No consideration of the concept that it might be just “weird weather” or that long term, natural, global warming could be to blame – no, you state unequivocally that it’s clearly AGW and cleaning up the energy economy is the solution!
Gavin made a comment to one of my earlier pieces in this thread that he was frustrated by politicians and the MSM coupling every exceptional weather event with AGW – and you have just done exactly that.
QED
Ray, I wonder if science has the time to breathe at times? So to a defender of science, I send a discovery,
really cool stuff. http://www.eh2r.com latest news, I can use any 2 subsequent pictures to prove the nature of the lower atmosphere, and lately in the Arctic its been warm, a controversy for conrarians was that many people have been
seeing brighter twilights in the Arctic , I have taken the time to resolve it. So I hope you enjoy this little bit of science, meteorology by way of light is taking off !
David Walker: You are making the same mistake as before, but in a different context.
We don’t base our conclusions on a single flood, or two floods, or on a single regional temperature record.
We base our conclusions on many, many, many strands of evidence that all weave together and support each other, ruling out alternative explanations. Basic physics tells us what greenhouse gases will do. Carbon inventories and the CO2 records show that greenhouse gases are increasing, and why. Then many, many, many different observations all show unambiguously the results that we expect if and only if climate is changing as we expect it to under anthropogenic global warming. You will find 11 of these observation series at NOAA, all showing the expected trend.
To me, the downward trend in stratospheric temperature is one of the deciders. The strong downward trend is exactly what AGW predicts, and it also rules out many other explanations.
You can complain about each individual weather event if you want. But don’t stand so close to one tree that you miss the GINORMOUS FOREST!
#616 Dida
… and there you go doing exactly the same thing.
Let me take an entirely sceptical stance in reposte:
Fact – the floods in Brisbane are in exactly the same places as previous higher level floods.
Fact – A 30/35 year cycle suggests that flooding should be expected right about now
Fact – The de-salination plants that the alarmists said would be needed because QLD would be suffering permanent drought are in moth balls.
Fact – Alarmists say the droughts in QLD is proof of AGW and now flood is proof of AGW
Can you not see why a reasonably intelligent person, might just question the the logic and rationale of all this?
You say “To me, the downward trend in stratospheric temperature is one of the deciders. The strong downward trend is exactly what AGW predicts, and it also rules out many other explanations.”
To be honest, I don’t know what that means. However, I assume, for you, it is a compelling piece of evidence that seals the deal as far as you are concerned and you cannot understand why others aren’t fully on board.
The CET graph does it for me. It cuts through all of the rhetoric, it exposes all of the ridiculous claims and headlines about the English weather. Insofar as England is concerned, there is nothing happening – other than the long term trend that is clearly visible.
It allows me to “dismiss”, many of the earnest, threatening, hand-wringing impending disaster, end of the world is nigh, claims – based upon on the evidence produced by the Met Office themselves (who are not generally perceived to be reticent in proclaiming their stance in these matters).
Moving on therefore, in order to “buy in” to the AGW argument, I have to accept that the oldest continuous record in the world, that reflects the temepraures for the country that I live in – is a “blip”. Somehow, my country’s cliamate is not being affected by AGW – but the rest of the world is.
Sorry Dida – but my brain just wont let me do that.
[Response: You might want to have that seen to then. ;-) However, you have completely mischaracterised the basis for concern. You see a trend and yet you don’t ask why that might be happening. When the likely causes are accelerating dramatically (and they are), you are ignoring what that implies for the future. Instead of imagining what the argument for concern is (as you have done above), why not deal directly with the argument that is actually being put forward? – gavin]
Dave Walker, #617–
Can you really not see that you are systematically dismissing massive amounts of evidence? Didactylos just presented us all (thanks, Did!) with global data on 11 different parameters, all of which support the mainstream science, and the concerns that follow. You also have many people here who are willing to explain their significance to you–including stratospheric cooling!–if you but care to make the effort.
Phillip M. (#613) alluded to a bigger picture–“add up all the data points worldwide”–and Didactylos (#616) actually handed a great many of them to you on the metaphorical silver platter. Yet you maintain that the CET, and only the CET, tells you all you need to know! (And, in my opinion, you misread it, as well–but we’ve been over that ground before, and you’ve dismissed all other interpretations but your own “nothing to worry about here” take on it.)
Do you have the guts to look at the evidence squarely and honestly–or will you continue to disregard 99% of it as “too hard to understand,” all the while attempting to pillory others for (supposedly) drawing too-large conclusions from this or that bit of “weird weather?”