Guest Commentary by Dirk Notz, MPI Hamburg
 It’s almost routine by now: Every summer, many of those interested in climate change check again and again the latest data on sea-ice evolution in the Arctic. Such data are for example available on a daily basis from the US National Snow and Ice Data Center. And again and again in early summer the question arises whether the most recent trend in sea-ice extent might lead to a new record minimum, with a sea-ice cover that will be smaller than that in the record summer of 2007.
However, before looking at the possible future evolution of Arctic sea ice in more detail, it might be a good idea to briefly re-capitulate some events of the previous winter, because some of those are quite relevant for the current state of the sea-ice cover. The winter 2009/2010 will be remembered by many people in Europe (and not only there) as particularly cold, with lots of snow and ice. Not least because of the sustained cold, some began to wonder if global warming indeed was real.
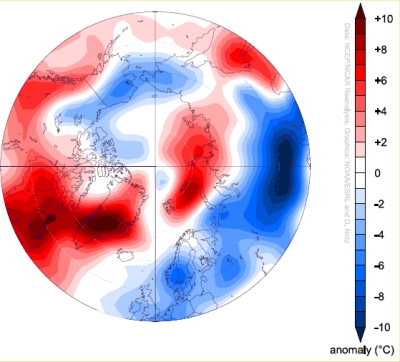
Such questioning of global warming based on a regional cold period of course neglects the crucial difference between weather and climate, with the former being the only thing that we as individuals will ever be able to experience first hand. A single regional cold spell has not a lot to do with climate – let alone with global climate. This becomes quite obvious if one instead considers the mean temperature of the entire globe during the last 12 months: this period was, according to the GISS data, the warmest 12-month period since the beginning of the records 130 years ago. Regarding sea ice, it was particularly important that temperatures in parts of the Arctic were well above average for most of the winter. This was directly experienced by some members of our working group during a field experiment at the West Coast of Greenland.

Fig. 1: Temperature anomaly at 1000 hPa during the first half of January 2010 with respect to the period 1968-1996. Warm anomalies in the Arctic and cold anomalies in Northern Europe and parts of North America are clearly visible.
The initial plan of this field experiment was to study the growth and decay of sea ice in great detail throughout an entire winter. In particular, we wanted to focus on the evolution of very young sea ice that had just formed from open water. Therefore, we wanted to start our measurements just before initial ice formation, which usually takes place in mid-November, at least according to past experience of the local Greenlandic population. Hence, we traveled to our measuring site close to the Greenlandic settlement of Upernavik in early November to put out our measuring buoys. We were hoping that ice formation would start shortly after we had put out the instruments such that they were protected from storms and waves. However, with temperatures that were often more than 10°C above the long-term mean, sea ice was nowhere to be seen. Even in January, there were days on end with above 0°C temperature and heavy rain fall. Finally, in February a stable ice cover formed, which of course remained relatively thin and which hence had melted completely by mid May.
The fact that it was sometimes warmer at our measurement site at the West Coast of Greenland than it was in Central Europe at the same time surprised us quite a bit. However, some recent studies indicate that such a distribution of relatively high temperature in parts of the Arctic and relatively low temperature in Northern and Central Europe and parts of the US might become somewhat more wide-spread in the future. While the Arctic has always shown large internal variability that lead to large-scale shifts in weather patterns, in the future the ongoing retreat of Arctic sea ice might cause those weather patterns to occur more often that allow for Northerly winds to bring cold air from the Arctic to the mid-latitudes. Hence, it is quite possible that because of the retreat of Arctic sea ice, some smaller parts of the Northern Hemisphere will experience pronounced cold spells during winter every now and then. The mean temperature of the Northern Hemisphere will nevertheless increase further, and the export of cold air from the Arctic of course leads to warm anomalies there.

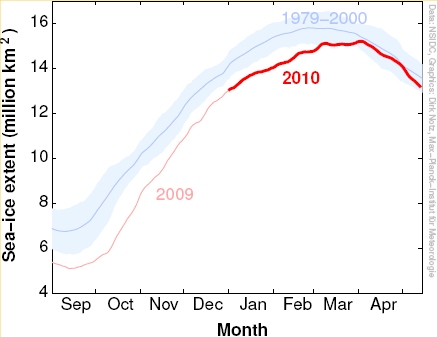
Fig.2: Evolution of Arctic sea-ice extent from September 2009 until mid May 2010. The blue line denotes the mean extent from 1979 until 2000, while the shaded region denotes the variability during that time (± 2 standard deviations)
But let’s return to the evolution of Arctic sea ice. Because of relatively high temperatures, Arctic sea-ice extent remained well below the long-term mean for most of the preceding winter. However, in March temperatures suddenly dropped for a couple of weeks, in particular in parts of the Barents Sea and in parts of the Beaufort Sea. This in turn lead to the formation of a thin ice cover in these regions, which caused a marked increase in observed sea-ice extent. For the measurement of this extent, it doesn’t matter at all how thick the ice is: any ice, however thin, contributes to sea-ice extent. Therefore, only considering a possible “recovery” of just the extent of Arctic sea ice always remains somewhat superficial, since sea-ice extent contains no information on the thickness of the ice. A much more useful measure for the state of Arctic sea ice is therefore the total sea-ice volume. However, for its estimation one additionally requires information on the overall distribution of ice thickness, which we have not been able to measure routinely in the past. While this will hopefully change in the future because of the successful launch of the Cryosat 2 satellite a couple of weeks ago, at the moment we unfortunately must rely on judging the current state of the Arctic sea-ice cover mostly by its extent.

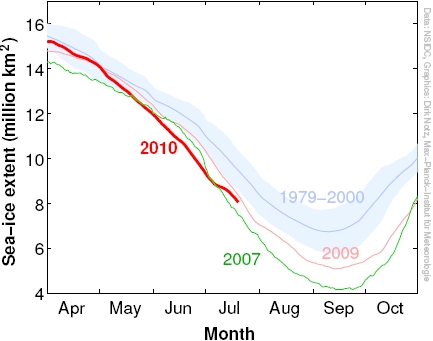
Fig.3: Evolution of Arctic sea-ice extent since April 2010 in comparison to 2007 and 2009. The blue line denotes the mean extent from 1979 until 2000, while the shaded region denotes the variability during that time (± 2 standard deviations)
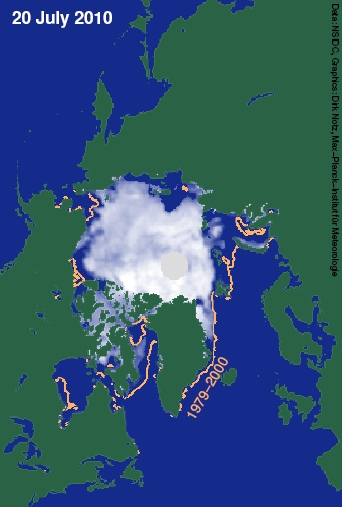
Because of the very low thickness of much of the Arctic sea ice, it wasn’t too surprising that at the end of the winter, sea-ice extent decreased rapidly. This rapid loss lead up to the lowest June sea-ice extent since the beginning of reliable observations. After this rapid loss of the very thin ice that had formed late in winter, the retreat slowed down substantially but the ice extent remained well below the long-term mean. Currently, the ice covers an area that is slightly larger than the extent in late July of the record year 2007. However, this does not really allow for any reliable projections regarding the future evolution of Arctic sea ice in the weeks to come.
The reason for this is mostly that sea ice in the Arctic has become very thin. Hence, in contrast to the much thicker ice of past decades, the ice now reacts very quickly and very sensitively to the weather patterns that are predominant during a certain summer. This currently limits the predictability of sea-ice extent significantly. For example, in 2007 a relatively stable high-pressure system formed above the Beaufort sea, towards the north of North America, leading to rapid melting of sea ice there. If again such stable high pressure system forms in the Arctic throughout the coming weeks, we might well experience a sea-ice minimum that is below the record minimum as observed in 2007. However, if the summer should turn out to be colder than during the previous years, a sea-ice minimum similar to that observed in 2009 would not be too surprising. Hence, at the moment all that remains is to wait – and to check again and again the latest data of Arctic sea-ice extent.

Fig.4: Arctic sea-ice extent on
Dirk Notz is head of the research group “Sea ice in the Earth System” at the Max-Planck-Institute for Meteorology in Hamburg.
The original version of this article was published in German at KlimaLounge
References:
Honda, M., J. Inoue, and S. Yamane (2009), Influence of low Arctic sea-ice minima on anomalously cold Eurasian winters, Geophys. Res. Lett., 36, L08707, doi:10.1029/2008GL037079.
Notz, D. The future of ice sheets and sea ice: Between reversible retreat and unstoppable loss. Proc. Nat. Ac. Sci. 106(49), 20590–20595, doi:10.1073/pnas.0902356106 (2009).
Polyakov, I. V., and M. A. Johnson (2000), Arctic decadal and interdecadal variability, Geophys. Res. Lett., 27(24), 4097–4100.
Credits:
Figure 1: NOAA ESRL Physics Science division
Figures 2-4: Data: NSIDC, Graphics: D. Notz.
(theorized of). #147, one explanation I remember for the increase of Antarctic sea ice is as follows: The global warming increases the moisture in air. This moisture will fall down anywhere it’s cold enough. The coldest place on earth is Antarctica interior. The snow from added moisture will turn into ice over time in Antarctica. This slightly increases the gravitational gradient of ice streams around the Antarctic coasts. This will speed them up. The added ice to ocean from the ice streams is unsalted. As the ice from ice streams of Antarctica melts, this heightens the freezing point of salty ocean water. Thus, GW increases the amount of sea ice on places and at times where there is an increase in the glacial calving and subsequent melting.
Can’t remember where I 1st saw this explanation, possibly it was on early 1990s, when this issue wasn’t so topical yet for me.
Could have been this one I read in 1995 or 1996: http://journals.ametsoc.org/doi/abs/10.1175/1520-0442(1992)0052.0.CO;2
and remembered wrong… Doesn’t change the logicx in the prev answer though :-/.
Then there’s Cavalieri’s
http://www.sciencemag.org/cgi/content/abstract/278/5340/1104
but should register to read it (again). Maybe I will.
This was a surprise find on this article chase.
http://tintin.colorado.edu/CVEN5718/Readings/Mercer_Nature_1978.pdf
previously I thought the potential collapse of WAIS was a matter considered first in late 1980s.
“(CNN) — An 11-year-old girl was killed and her mother injured when a chunk of ice struck them near a cave attraction in Washington state.
The two were on a family outing Saturday near the Big Four ice caves in Mount Baker-Snoqualmie National Forest, authorities said.
The pair was not in or on the caves, said Lt. Jeff Brand of the Snohomish County Sheriff’s Office.
The 11-year-old girl died after an ice patch fell on her head, he said. Her mother was injured in the leg, but she was not hospitalized.
Brand said ice at the popular attraction is melting so much this year that it is not stable, and warned visitors to stay away from the ice caves.”
I know that a singular event can’t be attributed to global warming, but we will eventually get enough small statistics like this to add another confirmation of adverse effects of AGW. Phrases such as “Climate change”, “recent trend in sea-ice extent”,or “trends in extreme weather events” are safely abstract and faceless.
[edit]
More likely it was this one:
http://www.nature.com/nature/journal/v352/n6330/pdf/352019a0.pdf
should go to the university library for this one. (captcha: flying vexation) Note to beginning scientists, always keep a notebook handy to write the proper references down.
Didactylos wrote in 150:
Back on 8 April 2009 I included links to a few resources that might on where the increase in sea ice is occuring, the warm outer West Wind Drift, the cold inner East Wind Drift, etc. here: Comment 267 of Wilkins Ice Shelf Collapse. But briefly, my thoughts, for what they are worth is that increased melt in Antarctica, particularly along the West Antarctic Penninsula during the Antarctic summer is resulting in more fresh water, stratification, similar to what we are seeing in the Arctic with lighter fresh water on top. As fresh water freezes more easily, this leads to more ice, particularly as it hits the cold inner East Wind Drift.
Big thing to remember, though, is that we aren’t particularly worried about sea ice melting per se. This isn’t what is going to raise sea levels. We are worried about the reduction in Arctic Sea Ice because of what changes this may imply for ocean circulation in the Atlantic, for example, a collapse of the Atlantic Conveyor Belt could cause temperatures in North America and Europe and oxygen levels in the Atlantic to drop rather severely. But at this point we aren’t seeing anything like this. More importantly, the loss of Arctic Sea Ice makes the loss of much of the ice in Greenland a virtual certainty, at least in the long run.
Antarctica? What worries us the loss of glaciers along the West Antarctic Penninsula and ultimately the (inland) ice sheet that is anchored below sea level. And sea ice around the West Antarctic Penninsula — being outside the Antarctic Circumpolar Current — is on a downward trend.
The whole Southern Hemisphere? Sea ice is showing a positive trend of +1.2%. The Bellingshuasen Sea to the west of the West Antarctic Penninsula? -5.3%. The Ross Sea, essentially a bay of water that is closest to the South Pole and well within the Antarctic Circumpolar Current? +4.8%.
*
I see that Patrick 027 has put his finger on the fact that ocean has greater thermal inertia than land as the reason why the Southern Hemisphere is currently lagging behind the Northern Hemisphere in terms of global warming.
Please see comment 149:
Ocean water mixes. In fact you will find that you can detect 20th Century warming as far down as a mile. Land? Does mix much. So basically all you have to do is warm the surface and heat will only gradually flow to the lower layers. So where you have more land things can warm at the surface more rapidly.
Anyway, the Article that he points you to suggests that a number of mechanisms are in play, including ozone depletion chilling Central Antarctica and resulting in stronger winds resulting in more polynyas formation and thus sea ice formation — as well as the presence of more fresh water.
Please see comment 149
PS to my above comment
I had pointed to an earlier comment of mine from 2008, and while I think that post has value, particularly in terms of what it links to, at one point I speak of the storm track continuing to move poleward. This may however be slowed or even reversed for a time if the ozone hole heals significantly. If it heals this should weaken the Antarctic Polar Vortex and the storm track will shift towards the equator or at least move poleward more slowly. (In a warming world storm tracks are expected to move poleward.)
If the storm track shift towards the equator then the moist warmer maritime air will shift towards the equator as well. This will slow the strong warming trend that we have seen along the West Antarctic Peninsula. So far, both as a consequence of global warming and ozone depletion, the warming of the West Antarctic Peninsula has resulted in glacier loss moving at a more or less steady pace inland over the years towards the West Antarctic Ice Sheet.
The ozone hole has been both the cause and to some extent the effect of a stronger polar vortex. Moisture carried aloft into the stratosphere by a stronger polar vortex results in further ozone destruction. This increases the temperature differential between the upper troposphere and lower stratosphere and thus strengthens the polar vortex.
Found the following that may be of interest… The strengthening of the Antarctic Polar Vortex by global warming and ozone depletion has served to move the storm tracks southward and contributed to drought in Australia:
Would be interested in the study itself, but haven’t been able to find the title as of yet.
jyyh, on Antarctic sea ice:
https://www.realclimate.org/?comments_popup=4469#comment-182806
pointing to this:
http://moregrumbinescience.blogspot.com/2010/03/wuwt-trumpets-result-supporting-climate.html
Much more info in the comments and links there
Re Gavins response to 144:
Dr Meier (from NSIDC) was quoted in a blog post last month on WUWT saying that PIPS is not a suitable source for data to compare thickness of ice from year to year. The quote did not say why. Presumably they are interested in other things (speculation: they plot maximum thickness of an area not average thickness because that is what ships care about). The PIPS data is not intended to be integrated for volume and is not suitable for that use. The PIPS concentration data is also substantially different from AMSR-e.
Thank you Hank Roberts, might have been the Manabe & al (1992) paper, I read about 15 years ago as well. As Grumbine says, this prediction is old.
To do another back-of-envelope-calculation, based on http://psc.apl.washington.edu/ArcticSeaiceVolume/IceVolume.php:
mean volume loss per decade: 3400 km3
mean minimum volume for considered period: 14000 km3
volume anomaly against mean volume 2010: -10000 km3
remaining volume 2010: 4000 km3
expected time to zero volume in summer: 1,2 decades, that is 2022.
Any mistakes made (except assuming linearity)?
I see Bremen has gone off line again. This is the only same that gives same day ice extent. Time the got it sorted out. does anybody know why they have these problems?
How come I can only read this article in german? I have only the title in English and clicking on it only takes me to the comments? I have raised this issue twice before with no effect
hey Ian K!! watch what you wish for, now there’s 2 articles with the German version the front page!
But you can read the English version by clicking the Brit flag beside it.
reCartcha: outsold nearby
Just a note, due solar storms that occurred on 1-2 Aug there may be some delay on the updates on several sites covering the satellite measurements.
thanks flxible. it was a dumb mistake!
I still don’t understand why there is such a large divergence between giss and dmi
“”Walt:
What catches my eye is the temp anomaly. Plus ten on a sustained basis?””
Plus ten temperature anomaly? I cannot see any ‘plus ten’ here.
http://ocean.dmi.dk/arctic/meant80n.uk.php
How secure is your data?
.
I made a plot of the http://psc.apl.washington.edu/ArcticSeaiceVolume/IceVolume.php data with the intent to put it into wikipedia. (I “reverse engineered” the values of ice volume.) Can anybody please give me a hint how “hard” these data are. As I understand, they stem from a complex numerical model stiffened by real weather, temperature, current and sparse ice thickness data and crosschecked against ICESat measurements. Do they have kind of 15% precision, what do you think?
Picking up on greg robies’ discussion in 106–one of the reasons Arctic melt is of concern to me is that it would seem to greatly increase the likelihood that seabed methane, especially in the shallow continental shelf north of Siberia, would dissociate at increasing rates, perhaps freeing up what I understand are very large quantities of free methane below. Do we have any latest data on methane release in areas like ESAS this summer?
Also, has there been further important research on what an ice-free Arctic Ocean will mean for North Hemisphere weather patterns and for ocean currents…
As to the condition of Arctic ice, the term I have seen from people actually interacting with it is “rotten ice,” for example here environmentalresearchweb.org/cws/article/yournews/41112 and google the phrase to find many more such examples.
I notice in the comments section that there is a lot of misconception as to the current Arctic temperature trend.
It has been quit cold in the Arctic for 3 months. Where do people get the information that it has been warmer?
Thank you.
Sigurdur, quite cold is still less cold than it used to be. Above minus 11 C sea ice melts from below… the very melt holding the summer rise in check… until it’s all gone. There are many charts around to show the anomaly… here’s one: http://polar.ncep.noaa.gov/sst/ophi/color_anomaly_NPS_ophi0.png
Post #19
“I feel I can make this educated guess at what the thermal dynamics of our changing climate
will do to the ice extent this year.”
take a look at the current graph – slightly different to your prediction!!
#171–
“The Arctic” covers a lot of ground (and ice.) If you are talking about DMI data by some chance, it’s valid for 80 degrees to the Pole, and yes, it’s shown a colder than average summer.
On the other hand, if you are talking about the Canadian Archipelago, it has been quite a bit warmer than usual for most (though not all) of the summer. Northern Russia–well, that’s been in the news, hasn’t it?
NCDC July blended land/sea data:
http://www.ncdc.noaa.gov/sotc/get-file.php?report=global&file=map-blended-mntp&year=2010&month=7&ext=gif
NCDC June blended land/sea data:
http://www.ncdc.noaa.gov/sotc/get-file.php?report=global&file=map-blended-mntp&year=2010&month=6&ext=gif
There doesn’t seem to be an open thread, but this is sort of on-topic:
Looking at the arctic map at cryospheretoday.com, it seems that the arctic ice cap no longer connects to either North America or Eurasia.
As far as I can tell, this has never happened before. Am I wrong?
If this week is the first time that has happened in recorded history, shouldn’t that be noteworthy?
Thanks for any clarification…