The blogosphere (and not only that) has been full of the “global warming is taking a break” meme lately. Although we have discussed this topic repeatedly, it is perhaps worthwhile reiterating two key points about the alleged pause here.
(1) This discussion focuses on just a short time period – starting 1998 or later – covering at most 11 years. Even under conditions of anthropogenic global warming (which would contribute a temperature rise of about 0.2 ºC over this period) a flat period or even cooling trend over such a short time span is nothing special and has happened repeatedly before (see 1987-1996). That simply is due to the fact that short-term natural variability has a similar magnitude (i.e. ~0.2 ºC) and can thus compensate for the anthropogenic effects. Of course, the warming trend keeps going up whilst natural variability just oscillates irregularly up and down, so over longer periods the warming trend wins and natural variability cancels out.
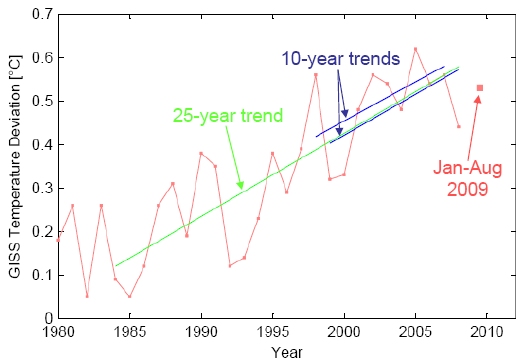
(2) It is highly questionable whether this “pause” is even real. It does show up to some extent (no cooling, but reduced 10-year warming trend) in the Hadley Center data, but it does not show in the GISS data, see Figure 1. There, the past ten 10-year trends (i.e. 1990-1999, 1991-2000 and so on) have all been between 0.17 and 0.34 ºC per decade, close to or above the expected anthropogenic trend, with the most recent one (1999-2008) equal to 0.19 ºC per decade – just as predicted by IPCC as response to anthropogenic forcing.
Figure 1. Global temperature according to NASA GISS data since 1980. The red line shows annual data, the larger red square a preliminary value for 2009, based on January-August. The green line shows the 25-year linear trend (0.19 ºC per decade). The blue lines show the two most recent ten-year trends (0.18 ºC per decade for 1998-2007, 0.19 ºC per decade for 1999-2008) and illustrate that these recent decadal trends are entirely consistent with the long-term trend and IPCC predictions. Even the highly “cherry-picked” 11-year period starting with the warm 1998 and ending with the cold 2008 still shows a warming trend of 0.11 ºC per decade (which may surprise some lay people who tend to connect the end points, rather than include all ten data points into a proper trend calculation).
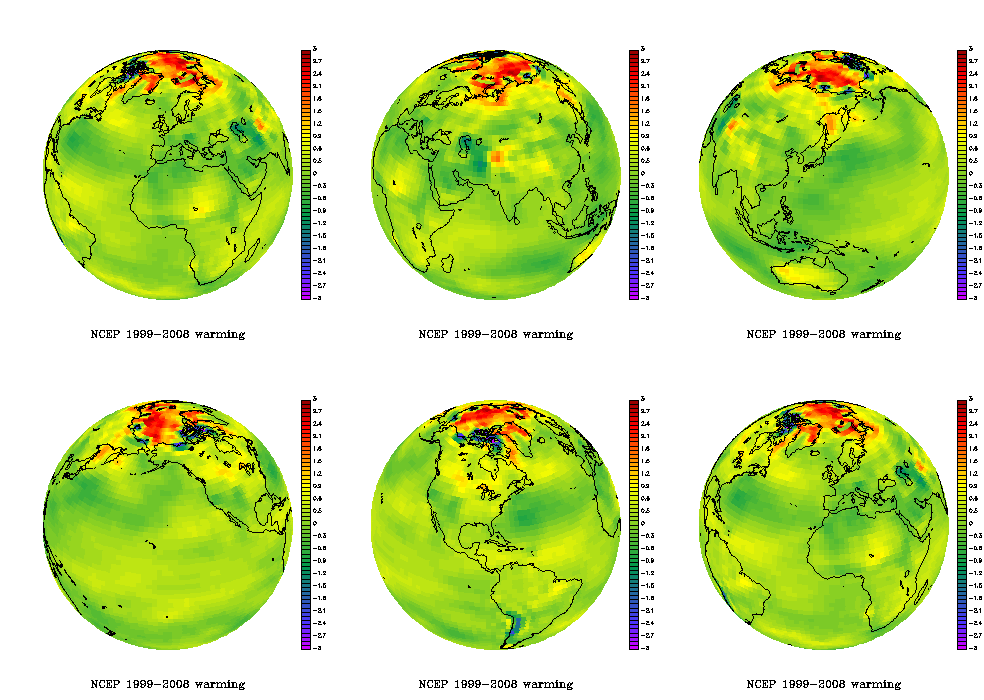
Why do these two surface temperature data sets differ over recent years? We analysed this a while ago here, and the reason is the “hole in the Arctic” in the Hadley data, just where recent warming has been greatest.

Figure 2. The animated graph shows the temperature difference between the two 5-year periods 1999-2003 and 2004-2008. The largest warming has occurred over the Arctic in the past decade and is missing in the Hadley data.
If we want to relate global temperature to global forcings like greenhouse gases, we’d better not have a “hole” in our data set. That’s because global temperature follows a simple planetary heat budget, determined by the balance of what comes in and what goes out. But if data coverage is not really global, the heat budget is not closed. One would have to account for the heat flow across the boundary of the “hole”, i.e. in and out of the Arctic, and the whole thing becomes ill-determined (because we don’t know how much that is). Hence the GISS data are clearly more useful in this respect, and the supposed pause in warming turns out to be just an artifact of the “Arctic hole” in the Hadley data – we don’t even need to refer to natural variability to explain it.
Imagine you want to check whether the balance in your accounts is consistent with your income and spendings – and you find your bank accounts contain less money than you expected, so there is a puzzling shortfall. But then you realise you forgot one of your bank accounts when doing the sums – and voila, that is where the missing money is, so there is no shortfall after all. That missing bank account in the Hadley data is the Arctic – and we’ve shown that this is where the “missing warming” actually is, which is why there is no shortfall in the GISS data, and it is pointless to look for explanations for a warming pause.
It is noteworthy in this context that despite the record low in the brightness of the sun over the past three years (it’s been at its faintest since beginning of satellite measurements in the 1970s), a number of warming records have been broken during this time. March 2008 saw the warmest global land temperature of any March ever recorded in the past 130 years. June and August 2009 saw the warmest land and ocean temperatures in the Southern Hemisphere ever recorded for those months. The global ocean surface temperatures in 2009 broke all previous records for three consecutive months: June, July and August. The years 2007, 2008 and 2009 had the lowest summer Arctic sea ice cover ever recorded, and in 2008 for the first time in living memory the Northwest Passage and the Northeast Passage were simultaneously ice-free. This feat was repeated in 2009. Every single year of this century (2001-2008) has been warmer than all years of the 20th Century except 1998 (which sticks out well above the trend line due to a strong El Niño event).
The bottom line is: the observed warming over the last decade is 100% consistent with the expected anthropogenic warming trend of 0.2 ºC per decade, superimposed with short-term natural variability. It is no different in this respect from the two decades before. And with an El Niño developing in the Pacific right now, we wouldn’t be surprised if more temperature records were to be broken over the coming year or so.
Update: We were told there is a new paper by Simmons et al. in press with JGR that supports our analysis about the Hadley vs GISS trends (sorry, access to subscribers only).
Update: AP has just published an interesting story titled Statisticians reject global cooling, for which they “gave temperature data to four independent statisticians and asked them to look for trends, without telling them what the numbers represented”.

John Millett, You are SOOOO confused! Dude, the greenhouse works both day and night. The atmosphere is largely transparent in the visible, which coincides with god ol’ Sol’s emission spectrum, and the ghgs are absorbing in the IR 24/7. Maybe you should stop dealing with imaginary planets and learn the science related to this very real one.
It’s epicycles all the way down, Mr. Millet?
Have a look at for example this, which Google Books lets you page through a bit of this, from a Woods Hole conference proceeding:
Biotic feedbacks in the global climatic system: will the warming feed the warming? By G. M. Woodwell, Fred T. Mackenzie
ISBN 0-19-508640 Oxford 1995
http://books.google.com/books?id=Tyrc32Pk5MkC&dq=%22planetary+atmosphere%22+lacking+%22greenhouse+gases%22&lr=&source=gbs_navlinks_s
#452 Hank Roberts, thanks for the reference.
Contradicting the AGW hypothesis, the authors conclude that increases in atmospheric CO2 concentration are not the primary cause of surface warming. They refer to a “lag of days to weeks between a change in temperature and the resultant change in CO2 concentration”.
They suggest that difficulty in balancing the carbon cycle is due to over-estimation of net carbon loss from forests. However, they say that net carbon loss from forests will increase in a warmer climate as they shrink in size, are subject to heightened attack by disease, insects and fire and increase respiration rates. Consequently, they say, growth in atmospheric CO2 concentrations will be higher than projected from human behaviour alone; and so too, via positive feedback, will the temperature increase.
The trouble is, the authors don’t explain the positive feedback mechanism – why, if a given concentration does not cause warming, would a higher concentration do so?
#451 Ray Ladbury, this site’s “The CO2 problem in 6 easy steps” led me astray to imaginary, atmosphere-free planets. Putting the issue as a question: Is it sensible to distribute the sun’s energy, as the referenced tutorial does in computing the magnitude of the natural greenhouse effect, over the full spherical surface when in reality it falls only over the day-time hemisphere?
the new glamor boy on the blogs seems to be h abdussamatov the ice age cometh
is there a short answer to this ,much appreciated
I predict that this time next year, when there’s been another year of no more warming that this discussion will be had again. Except this time there will be another year that doesn’t fit the late 90’s warming trend.
The problem is that the “Hockey Stick” and its pro-AGW fanatic supporters (not AGW realists, the “AGW Is My Religion” crowd) worked very well so long as there was a giant uptick, but hasn’t worked so good since.
I’ll also note that with the Atlantic hurricane season winding down, we’ve had three years in a row of nothing at all like 2005, despite assurances that we’d better get our act together because 2006^H7^8^9^H^H10 is going to be worse.
Forecast for 2010? Continued cooling trend, with increased denialism caused by poor science understanding and reporting. I sure hope the scientists in this crowd figure out how to explain AGW in a way that WORKS before the present flat-to-cooling period ends (my prediction — around 2020 to 2025) and the situation gets really ugly.