 Something over a week ago I had the pleasure of making my way up to the little ski resort of La Thuile in the Val D’Aosta to learn about the latest results from the Venus Express mission. (You can imagine it was a tough decision to go to La Thuile and hear real scientists talking about Venus when I could have instead been listening to luminaries such as Mark Morano drone on at the Heartland Institute pseudoscience bash. ) My own connection with the Venus Express meeting came about through some work I’ve been doing on habitability of the newly discovered "Super Earth" extrasolar planets like Gliese 581c. Many of us think these may be "super-Venuses" rather than "Super-Earths," so it seemed like time to touch base with the people working on our own Venus. The fact that we can put together the same bits of physics we use to understand global warming on Earth in order to understand the interplay of the carbon dioxide greenhouse with sulfuric acid clouds on Venus is a testament to the fundamental power of climate science, and gives the lie to Claude Allègre’s oft stated claim that there is no such thing as a science of climate. Altogether, it was a thrilling meeting.
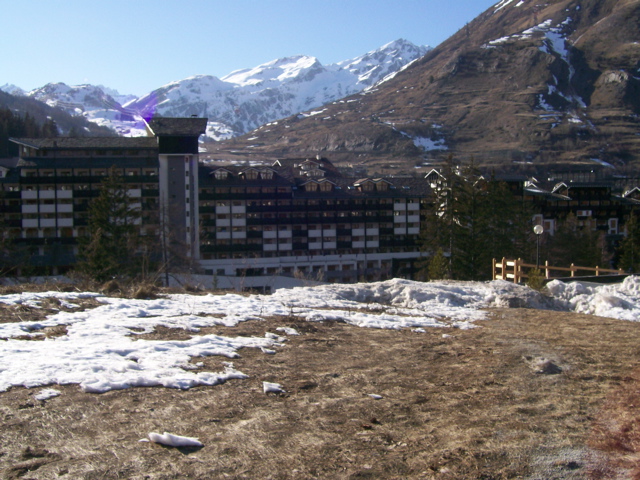 The Venus Express mission was described in this earlier RealClimate article, and you can read more about the mission at the VEX home page. Venus Express was done on the cheap, mostly using instruments cobbled together from leftover hardware from Mars Express and the Rosetta comet mission. The results have been nonetheless spectacular, and La Thuile provided a suitably spectacular venue in which to discuss them. This meeting was one in the series of Rencontres de Moriond in which scientists get together for a week of intensive discussion of leading-edge topics in physics — plus equally intensive skiing, climbing, hiking and enjoyment of good Northern Italian cooking. If you’ve ever read any of Jeremy Bernstein’s accounts of how he got involved in mountaineering through his attendence at particle physics meetings conducted in similar circumstances, you’ll know the general idea about how such things work. It’s a great way to shake loose creative thinking. And it’s one of those things that makes real science so much fun. Perfectly aside from the setting, it was a thrill to see the vigor of this field, and the influx of talented new young postdocs and graduates students, with all their fresh ideas and enthusiasm. I hope to give just a bit of the flavor of what went on during that eventful week.
A Field Guide to Venus
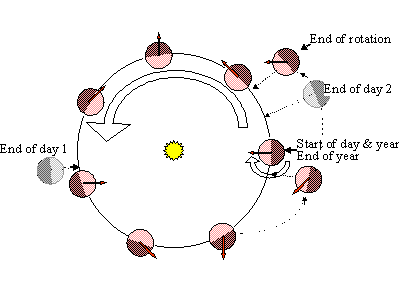
Venus has an Earthlike mass and surface gravity, the latter being 8.9 meters per second per second, only slightly less than Earth’s. Venus is in a very nearly circular orbit about the Sun with orbital period (year) equal to 224.65 Earth days. Venus rotates much more slowly than Earth, however, and this has many consequences for the atmospheric dynamics, since it greatly reduces the Coriolis accelerations that do so much to organize Earth’s large scale atmospheric circulations. In fact, the rotation of the planet is retrograde — i.e. opposite in direction to the rotation of the orbit. The siderial day on Venus — the period with which the star patterns would repeat, if you could see the stars from the surface — is 243 Earth days, but since this is in the retrograde direction, it adds to the angular velocity of the planet relative to the Sun. Thus, the rate of rotation relative to the Sun is 1/224.65 + 1/243 rotations per Earth day, leading to a solar day of 1/(1/224.65 + 1/243), or 116.7 Earth days. This is the time between sunrises, as would be seen from the planet’s surface. Thus, Venus’ solar day is roughly half of its year, as illustrated in the sketch below (credit K. Fuller).
You might think that the long day would result in the dayside heating to extreme temperatures while the darkness-plunged nightside plummeted to relatively frigid values. In fact, because of the dense 92 bar atmosphere, it takes a very long time for most of the atmosphere to heat up or cool down, and there is little day/night variation over most of the depth of the atmosphere. Higher up, however, there is a diurnal and seasonal cycle, as illustrated by the black vs. green lines in the accompanying sketch — Venus Express in fact found indications that the diurnal cycle extended deeper into the atmosphere than this traditional sketch suggests, with significant temperature variations penetrating to 45 km. altitude. The atmosphere of Venus is nearly pure carbon 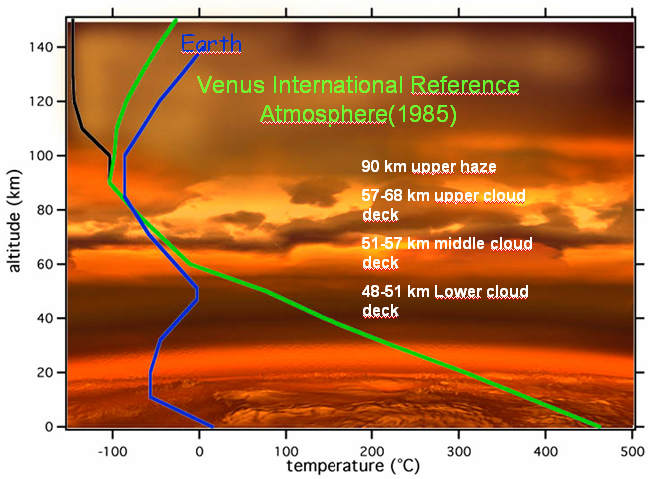 dioxide, with a few percent of nitrogen thrown in. It also contains traces of water vapor, which though tiny, contribute significantly to the greenhouse effect of the atmosphere.Most of the greenhouse effect comes from the carbon dioxide, however, which by itself is sufficient to raise the surface temperature most of the way toward its observed value of around 470C. A key feature of the atmosphere of Venus is the sulfuric acid cloud deck. These clouds account for the high reflectivity of Venus, but because they also reflect infrared back to the surface (unlike water clouds, which absorb and emit), they have a warming effect as well, and constitute the second most important factor in the greenhouse effect of Venus after carbon dioxide. Radiation model calculations demonstrate that the clouds have a pronounced net cooling effect on the planet, when both factors are taken into account. The cloud deck comes from combinations of sulfur dioxide with water, but the nature of the sulfur cycle allowing the cloud deck to be maintained is currently a matter of considerable uncertainty.
The VEX instruments
For a full list of the complement of instruments on Venus Express you can take a look at the VEX Instrument Summary .For the most part, I’ll focus on data from VIRTIS and SPICAV-SOIR. VIRTIS is a spectral imager which observes patches of Venus in a set of wavelengths ranging from the ultraviolet (0.25 microns) to the near infrared (5 microns). On the night-side VIRTIS infrared yields thermal emission, which can provide information about cloud structure and temperature, as well as information about atmospheric constituents.. On the day-side VIRTIS infrared images are dominated by reflection of the near-infrared component of sunlight; the absorption of solar near-infrared also provides valuable information about atmospheric constituents, as well as information about cloud structure that is complementary to the night-side thermal emission. SPICAV/SOIR is a spectrometer with somewhat different characteristics; it returns high-resolution ultraviolet images , which reveal interesting aspects of atmospheric dynamics. The reflection of short wavelengths like ultraviolet gives a good indication of the occurrence of cloud particles, but the utility of ultraviolet observations is enhanced by the presence of an as-yet unidentified ultraviolet absorber in the atmosphere of Venus, which shows up in the form of dark streaks on ultraviolet images. Besides being useful as an ultraviolet imager, SPICAV/SOIR is used with a technique called occultation, in which the attenuation of starlight or sunlight passing through the atmosphere provides information about the vertical profile of various atmospheric constitutents, including sulfur dioxide, water vapor (and its various isotopes), carbon monoxide, carbonyl sulfide and oxygen. SPICAV is derived from spare parts from a similar instrument (SPICAM) that flew on Mars Express, but SOIR, which adds infrared channels useful for solar occultuation measurements, was newly developed for Venus Express.
Venus Express also carried a thermal infrared spectrometer, PFS, which was intended to study wavelengths longer than 5 microns. Thermal emission in these wavelengths is important to the understanding of the radiation budget of Venus. Unfortunately, this instrument was the one disappointment in an otherwise spectacularly successful mission, as the PFS was rendered inoperative by the failure of a critical shutter to open. But no worries — the instruments that did work provide a great wealth of new material to think about.
Venus Express sports a lightweight radio-science package, VeRa. Radio occultation is a low tech but highly valuable workhorse of planetary observation. By observing the refraction of radio waves passing through the atmosphere, one can obtain density profiles, since the index of refraction is proportional to density. From density and the hydrostatic relation (i.e. pressure is the weight of all the fluid above you) it is possible to reconstruct temperature profiles if you know what the atmosphere is made of. On Venus, radio occultation can observe the atmosphere down to about 45 km. altitude from the surface.
Venus: A dynamic atmosphere
Venus is not the featureless cue-ball you’d think it is from low-resolution observations in the visible spectrum. 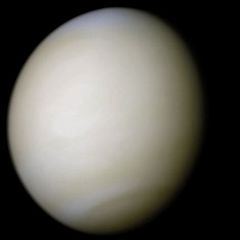 Observations of Venus in the infrared and ultraviolet spectrum show a variety of intriguing wave and vortex patterns. The highly dynamic nature of the upper atmosphere of Venus is not a new discovery, but the increasingly sophisticated observations have continued to enrich our understanding of Venus atmospheric dynamics. Indeed a new era of Venus meteorology is dawning. For multiple reasons, the deep atmosphere of Venus is a fairly quiescent place: the low rotation rate of Venus makes it easy for the dense atmosphere to transport heat and keep temperatures horizontally uniform, while the mass of the atmosphere and the limititation of infrared cooling by the dense carbon dioxide atmosphere even out the diurnal and seasonal cycle. Moreover, through a combination of reflection, scattering and absorption, only a trickle of sunlight reaches the surface to drive convection and other atmospheric circulations. Things can happen more rapidly in the upper part of the atmosphere, which can also support stronger temperature gradients. Keep in mind that the top 1% of the mass of the atmosphere of Venus is about like the whole atmosphere of Earth, and that there is plenty of dynamics and temperature variations at least down to the 2 bar level (about 45 km above the surface). There is plenty of active atmosphere to keep dynamicists happy. If you will, you can think of Venus as consisting of a dynamically active 2 bar "atmosphere" atop a sluggish deep "ocean."
Now let’s take a look at some of the circulation patterns revealed by Venus Express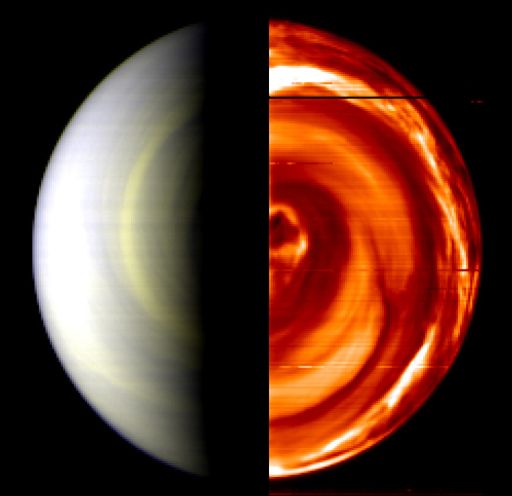 . The patterns are made visible through the modulation of the cloud distributions, and for the most part reflect motions taking place at altitudes of 45-60 km. In the night-side infrared, clouds show up as dark patches or streaks, since they block upwelling infrared; relatively cloud-free areas are bright. The image at the right shows the night-side VIRTIS infrared image, taken looking toward the South Pole, on the right half of the image. The left half is a day-side observation in the visible spectrum, from reflected sunlight. You can see a concentrated vortex structure near the pole, and an intriguing spiral cloud pattern, probably due to the differential rotation of the atmosphere — i.e. the fact that it is swirling like a bathtub vortex and not in rigid-body rotation. It is generally believed that there is subsiding motion near the pole, but the extent of vertical motions associated with these cloud patterns is not well known. Some of the patterns are interpreted as variations in cloud top height (hence temperature) induced by the vertical motion field, rather than as variations in cloud thickness. Many of the eddies give an appearance very much like two-dimensional vortices having little vertical motion, while other cloud and wave patterns look more like Earth’s boundary layer convective cloud streets (modulated by wind shear), or like gravity waves.
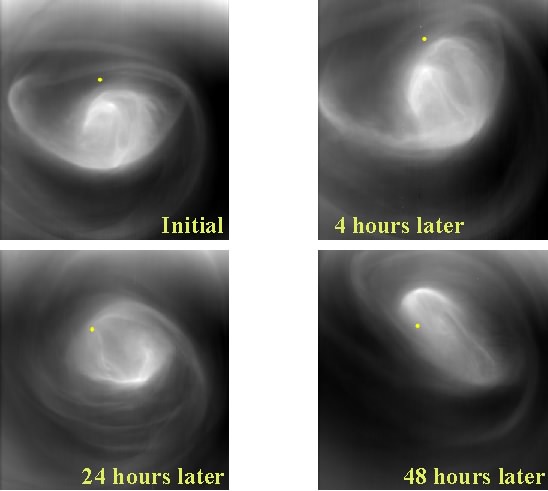
The South Polar vortex shows a dipole pattern very much like has been seen earlier at the North Pole. Here’s an example of the evolution, viewed by VIRTIS in an infrared channel thought to be mostly responding to cloud top height (see ‘South-polar features on Venus similar to those near the north pole’ by G. Piccioni et al. Nature,29 November 2007.) The vortex you are seeing is about 2000 km. across.
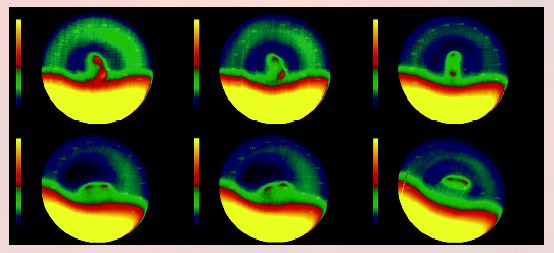
And this color image of the vortex, taken in the 5 micron band, shows the dipole structure more clearly. The bright yellow region is the dayside.
Although the surface of Venus rotates only slowly, the upper atmosphere has taken on a rotation rate of its own, and air around the 50km level circles the planet with a period of roughly 5 days. This is called super-rotation, because the rotation is in the same sense as the rotation of the planet, but stronger. It allows the upper atmosphere to support substantial temperature gradients, by providing a Coriolis acceleration which can offset pressure gradients associated with temperature variations. The super-rotation is not actually a rigid-body rotation, but has a very distinctive profile in latitude. Venus Express has provided new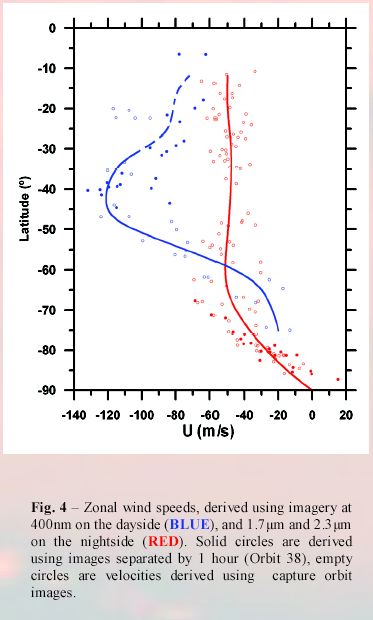 observations of the zonal wind pattern using cloud-tracking methods, an example of which is shown to the right. Note particularly the uniform velocity in the nightside winds, extending from 70S to the Equator; the polar regions are in something closer to rigid body rotation. What accounts for this pattern? In all theories, the transport of momentum by transient eddies is critical to redistributing the angular momentum and creating low-latitude super-rotation. Thus, the improved understanding of eddy dynamics from Venus Express will help us to determine the character of the eddies and their transports. An essential question remains to be answered: What are these eddies and where to they come from? Much prevailing thinking ascribes the eddies to instabilities of horizontally sheared jets — the barotropic instability — but the images themselves do not give a very clear impression of jet instability.
In a related notable result, the modelling team from the Laboratoire de Meteorologie Dynamique, Paris has achieved a very convincing simulation of super-rotation in a new Venus general circulation model. Though the deep atmosphere of Venus is sluggish, its dynamics is nonetheless crucial since it is this circulation which brings angular momentum from the surface to the upper atmosphere; this circulation is also critical for atmospheric chemistry, since it transports gases to the surface where they can react to form minerals, and (more speculatively) transports volcanic outgassing to the cloud deck.
Higher in the atmosphere, the extreme temperature difference between the dayside and the nightside, due to solar absorption in the atmosphere on the dayside, drives a circulation flowing from the hot dayside to the cold nightside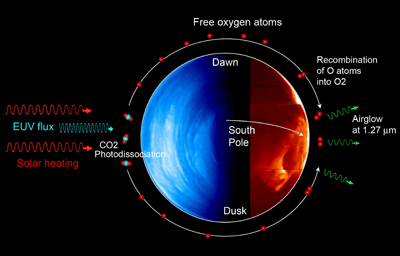 . This circulation also gives rise to another fascinating phenomenon, the oxygen airglow. On the dayside, extreme ultraviolet from the Sun can actually break up carbon dioxide molecules into their component parts, which liberates free oxygen atoms. These are carried to the cold nightside, where they recombine into O2, releasing energy in the 1.27 micron infrared range. Venus express carried out many new observations of the airglow phenomenon and the circulation in these extreme upper reaches of the atmosphere — which also bear on the processes allowing planetary atmospheres to escape to space.
Venus atmospheric chemistry: The cloud deck
Using occultation methods, Venus Express has shed far more light on atmospheric chemistry than I can begin to go into here, but I will at least mention a few of the results. Quite remarkably, the remote-sensing techniques can detect not only the profiles of water vapor in the atmosphere, but also the various isotopes, notably the heavier version — deuterated water, HDO, in which deuterium substitutes for one of the hydrogens. In the Earth’s upper atmosphere, the HDO to H2O ratio is depleted relative to the water vapor in the lower atmosphere, because the heavier HDO condenses out more readily when it rains. On Venus, the situation is the opposite, and HDO is greatly enriched relative to lower level water vapor. This occurs because water vapor is broken apart by sunlight, and the lighter hydrogen escapes more readily than the heavier deuterium. Venus Express also found, though, that oxygen is escaping from the atmosphere in the ratio expected from breakup of water, suggesting that non-thermal escape processes in which chemical reactions give an extra kick to atoms, are important. Putting together a consistent picture which simultaneously accounts for the oxygen escape and the deuterium enrichment will tell us much about the mechanisms by which planets lose atmospheres, and perhaps shed light on issues affecting habitability of extrasolar planets.
Because the sulfuric acid cloud deck has such a profound impact on the climate of Venus, the chemistry of the Venusian sulfur cycle is of great interest. What is the lifetime of the clouds, absent resupply? Venus Express measurements, and associated laboratory experiments, are helping to clarify these issues as well. Carbonyl Sulfide has been observed in the atmosphere, and there are good indications that the formation of polysulfur (S2, S4, etc.) and possible subsequent precipitation plays a role in the sulfur cycle. The nature of sulfur dioxide resupply connects up with the contentious issue of catastrophic resurfacing of Venus, which I’ll take up shortly.
Peeking at the surface
With such a thick CO2 atmosphere, you’d think it would be utterly impossible to see the surface of Venus in the infrared. The issue of "saturation" of the absorption of infrared by CO2 has been discussed previously on RealClimate, but it turns out that even with 92 bars of CO2 in the atmosphere, Venus is not saturated throughout the infrared spectrum. There is a narrow window region in the vicinity of 1 micron wavelength, which allows the surface to be observed in the infrared. Venus Express has exploited this window to make maps of infrared emission from the surface, which, combined with topography data from the Magellan radar altimiter, allow an estimate of surface emissivity. Hopefully, this will shed some light on the minerology of the surface, which is largely mysterious. Just as a sample of the new data, here is an image showing the surface brightness anomaly overlain with radar topography. This image comes courtesy of Joern Helbert and his student Nils Müller, and of course as for all results derived from VIRTIS, the VIRTIS P.I’s Giuseppe Piccioni and Pierre Drossart deserve a round of applause as well.
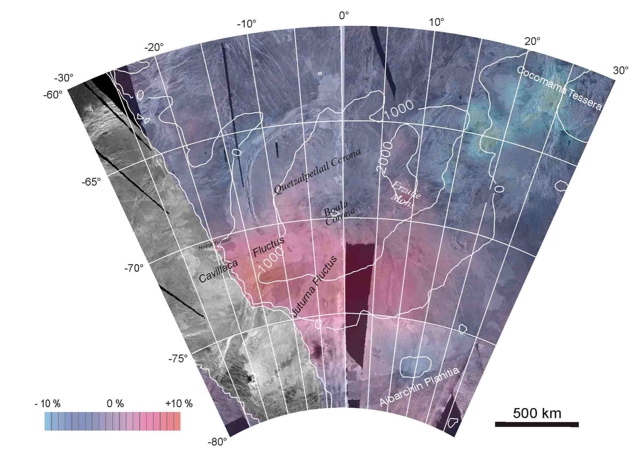
One of the most exciting questions concerning the nature of Venus is whether the planet has undergone catastrophic resurfacing in the relatively recent past.. Venus has no plate tectonics to gradually engulf part of the surface. Unlike Earth or Mars, impact craters are uniformly distributed over the surface. By some reckonings, there appear to be no old craters, as witnessed by the apparent lack of craters in a state of partial degradation. This would argue for the entire surface having been engulfed or flooded over with magma some time in the past half billion years or so. However, the morphology of the surface lends itself to varying interpretations, and these were the subject of a genteel debate between David Grinspoon (for resurfacing) and Sue Smrekar (in the opposing camp). I can’t say that anybody struck a knockout blow, but it was certainly informative, and serves as another example of the way real scientists try to hash out uncertainties and conflicting theories. There is no herd mentality here, any more than there is in studies of Earth’s climate. It’s in the DNA of scientists to poke at theories all the time, and never cease their questioning. “Consensus” does not consist in agreeing on everything, but rather in agreeing on a common set of tools and methodologies, as well as on a set of results that can be considered settled to a sufficient degree that further results can be confidently built upon them. Consensus of this sort exists for Venus as well as for Earth, and nobody makes a fuss about it.
The question of resurfacing has major implications for the climate history of Venus. No active volcano has yet been observed on Venus, and it has been conjectured by David Grinspoon that perhaps Venus goes through cycles of extreme volcanism and sulfur resupply to the cloud-deck, followed by long quiescent periods in which the clouds dissipate and leave the planet’s surface much hotter than its already torrid temperature. This is indeed a frontier area of planetary science, and one which engages phenomena extending from the interior to mineral reactions at the planet’s surface, and onward to photochemistry in the outer reaches of the amosphere.
The Earth seen from Venus: A Pale Blue Dot
Modern planetary probes are so versatile they can be re-programmed to do things their original designers never anticipated. With colleagues at the University of Chicago, I’m doing that now, using a minerology probe on the Spirit and Opportunity rovers on Mars to examine atmospheric argon. Taking a leaf from the Pale Blue Dot observations of Earth from Galileo, popularized by Carl Sagan (look. here. for a detailed report of those observations), Venus Express mission scientists have gotten the bright idea of using observations of Earth from Venus to test methods for searching for habitable extrasolar planets. The next generation of extrasolar planet-finders will return spectra of the planets averaged over the entire planetary disk, so learning how to make the most of "single pixel astronomy" is of the utmost importance.
Already, observation of the Earth spectrum by VIRTIS has detected Earth’s CO2, oxygen and water vapor. Observations by SPICAV show the absorption feature characteristic of ozone. Work is underway, spearheaded by Darren Williams, to see if Earth’s oceans can be detected through the characteristic sun glint they produce.
At the meeting I also had the pleasure of meeting Enric Pallé, a young astronomer who is probably best known to regular RealClimate readers for his attempts to estimate trends in Earth’s albedo through ground-based measurements of lunar Earthshine. . Enric’s connection with the Earth from Venus session comes about because he has been looking at ways to measure a planet’s length of day by examining fluctuations in reflected sunlight; he has also been trying to detect Earth’s vegetative "red edge" through Earthshine observations. Enric tells me that he has refined his somewhat controversial Earth albedo estimates, and these no longer show the mysterious and striking long-term albedo trends reported in the original paper. To tell the whole story, though, I should note that the satellite based CERES albedo estimates (which showed an opposite trend to Earthshine) have evidently also been revised, owing to discovery of a drift due to deterioration in a filter. We’ll have to wait for Enric’s paper to see the details, but estimates of albedo fluctuations appear to be converging, according to preliminary results he showed me. This is science at its best, and a reminder both that detecting trends from satellites is difficult, and that one should avoid building elaborate and earthshaking interpretations on data from novel observing techniques like Earthshine until they have time to mature. We all could have been spared a lot of grief if the Alabama boys who pushed their erroneous microwave satellite temperature trends over surface records for so long had been as diligent as Enric in re-examining their methods.
What a week!
All in all, quite a week! And despite the lack of good snow on the cross-country trails, I did manage to get in a few nice excursions up the valley, with the help of a prodigious supply of red klister. I am looking forward to seeing what another year of Venus Express observations brings.
John Olson, #146
“I’ve noticed this Real Climate site still talks about global warming as established scientific fact.”
Why is it you still talk about how Global Warming is false merely on one item which isn’t 100% proven accurate?
How come the items we DO know *must* be ignored because we don’t have measurements in all the places you want to see them made. Do you have anything that would explain how the places where measurements are taken would give the opposite picture of reality? No?
And I’ve heard in many places that Adam and Eve lived alongside the Allosaur (who was a vegetarian at the time).
And how come 40 years wasn’t enough to prove global warming yet less than 10 years is enough to prove it’s wrong?
John Olson, Where are you getting your information? The “oversampling” of land areas is irrelevant. What matters is that both land and ocean are sufficiently sampled. Indeed, the oversampling of land areas is a boon when it comes to dealing with local effects like urban heat island.
As to satellite errors, the absolute numbers are less important than trends, so this diminishes the importance of the errors. What is important is that when normalized to the same period, all temperature products give the same warming trend.
As to claims of “global cooling,” let us just say charitably that your source is misinformed. Climat is inherently noisy, and “trends” of less than 30 years are not reliable. See:
http://tamino.wordpress.com/2008/12/31/stupid-is-as-stupid-does/
Now the real question: Why do you consider the sources of such misinformation reliable?
Please take my advice– ignore John. I have had plenty of experience with him elsewhere and he has nothing intelligent to contribute to this discussion, and is bent on confusing people.
C
“I’ve heard it said in a number of places that the earth’s mean temperature is actually decreasing” – John Olson
Well of course, if you spend your time on denialist blogs, you will be told a lot of lies – what do you expect?
In addition to what others have noted, there is of course the continued melting of glaciers (most of which have receded for each of the past 18 years), the unprecedented summer melting of Arctic sea ice in 2007 and 2008, the continuing rise in ocean temperatures (that’s where most of the excess heat trapped by greenhouse gases goes), the shift of many species’ ranges polewards and/or upwards, and the earlier appearance of many spring phenomena.
re: Miskolczi as the Mad Hatter
May I say at the outset – that I think there may be a chance that amplification of the El Nino Southern Oscillation by the Pacific Decadal Oscillation may lead to 20 or 30 years of no warming. Given our state of understanding of these phenomenon – obviously quantification or even a definite maybe is out of the question. This is a year by year proposition. Will the current PDO cool mode hold out? Was the warm mode between 1977 and 1999, that contributed to warming through PDO amplfification of ENSO entirely natural, partly natural or driven by AGW? Relative imponderables for which we have no easy answer except to see which way events play out.
To get onto the subject of this post, Miskolczi, I have just had the unfortunate experience of suggesting in a skeptic forum that the short wave end of the spectrum (based on BBSO cloud work) might be a more fruitful avenue. Talk about a spirited defence.
The trouble is – the more I read – the more odd this paper seemed. I am happy to have read FM’s comments here – I was inclined before then to think it was a conspiracy to discredit skeptics. Really, I am only a skeptic because of the above imponderables. But I read Miskolczi. Thermal equilibrium that is not, internal kinetic energy that is not, atmospheric potential energy that is not, conservation of energy that is not. Radiation pressure that is bizarrely irrelevant and expressed as 1/3 of the surface upward energy flux. On what planet? Hydrostatic equilibrium on a real, blue spinning planet? I think not. Etc. Etc.
It is all claimed to be based on fundamental principles – but is in reality based on datapoints calculated from the TIGR database. What was it? Something Initial Guess something. Oh dear. The data is not properly presented or referenced – because it is all claimed to be based on fundamental principles – but if the principles don’t apply then it is based on proven and measured data that is more accurate than anyone else’s – but… so on and so forth.
I felt a bit like Alice in Wonderland at the Mad Hatters ball.
Cheers
Robert Indigo Ellison