Global climate
 Global climate statistics, such as the global mean temperature, provide good indicators as to how our global climate varies (e.g. see here). However, most people are not directly affected by global climate statistics. They care about the local climate; the temperature, rainfall and wind where they are. When you look at the impacts of a climate change or specific adaptations to a climate change, you often need to know how a global warming will affect the local climate.
Yet, whereas the global climate models (GCMs) tend to describe the global climate statistics reasonably well, they do not provide a representative description of the local climate. Regional climate models (RCMs) do a better job at representing climate on a smaller scale, but their spatial resolution is still fairly coarse compared to how the local climate may vary spatially in regions with complex terrain. This fact is not a general flaw of climate models, but just the climate models’ limitation. I will try to explain why this is below.
Regional climate characteristics
Most GCMs are able to provide a reasonable representation of regional climatic features such as ENSO, the NAO, the Hadley cell, the Trade winds and jets in the atmosphere. They also provide a realistic description of so-called teleconnection patterns, such as wave propagation in the atmosphere and the ocean. These phenomena, however, tend to have fairly large spatial scales, but when you get down to the very local scale, the GCMs are no longer appropriate.
Minimum scale
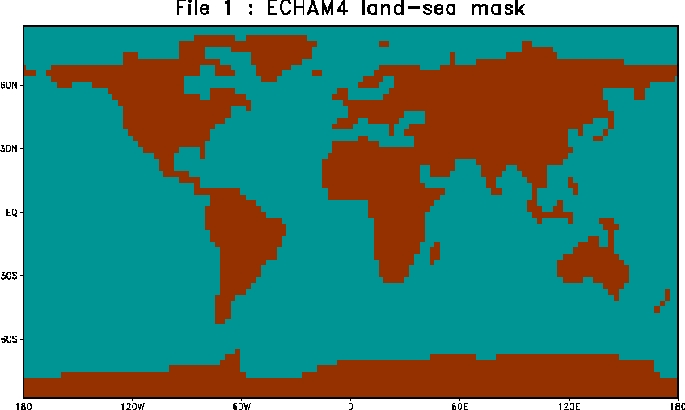
The distance between two grid points in a GCM (or an RCM) is the minimum scale (~200km). The coarse resolution typically used in the GCMs till now has implied that the topography has been smooth compared to the real landscape and that some countries (e.g. Denmark and Italy) are not represented in the models (one exception is one Japanese GCM with an extremely high spatial resolution).
Sub-grid processes are represented by parameterisation schemes describing their aggregated effect over a larger scale. These schemes are often referred to as ‘model physics’ but are really based on physics-inspired statistical models describing the mean quantity in the grid box, given relevant input parameters. The parameterisation schemes are usually based on empirical data (e.g. field measurements making in-situ observations), and a typical example of a parameterisation scheme is the representation of clouds.
Surface processes
Skillful scale
Shortcomings associated with parameterisation schemes and coarse resolution explain why one gridpoint value provided by the GCMs may not be representative for the local climate. A concept called skillful scale has sometimes been employed in the literature, most of which have been linked to a study by Grotch and MacCracken (1991) who found model results to diverge as the spatial scale was reduced. Specifically, they observed that:
Although agreement of the average is a necessary condition for model validation, even when [global] averages agree perfectly, in practice, very large regional or pointwise differences can, and do, exist.
Although it is not entirely clear whether this study really touched upon skillful scale, it has since been cited by others, and used to argue that the skillful scale is about 8 gridpoints. Nevertheless, since the 1991-study, the GCMs have improved significantly, and the GCMs now are run for longer periods and with diurnal variations in the insolation.
Regionalisation
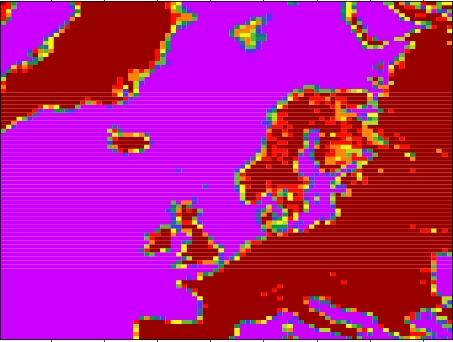
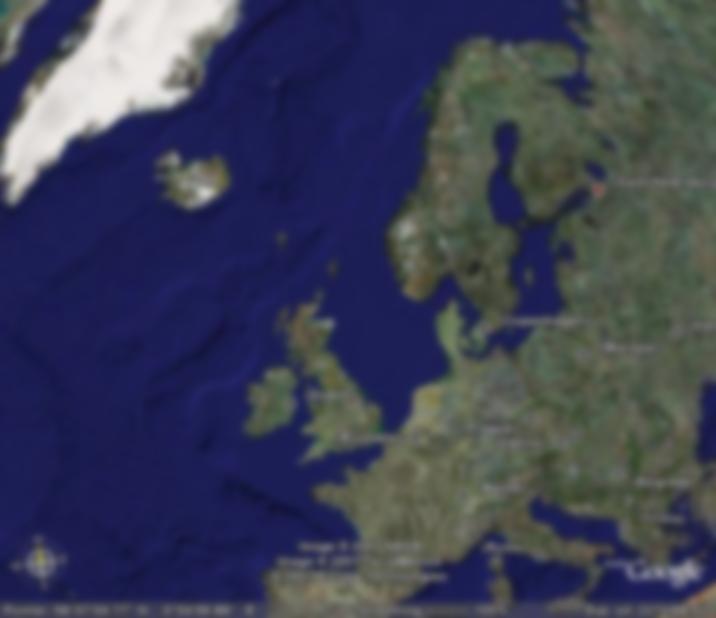
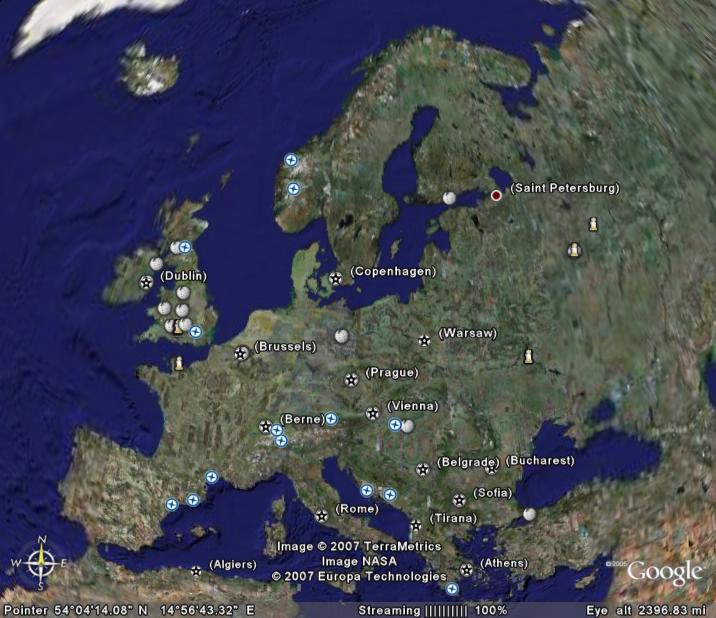
The figure above gives an illustration of the concept of regionalisation, or so-called downscaling. The left panel shows a typical RCM land-sea mask, giving a picture of its spatial resolution. The middle panel shows a blurred satellite image of Europe, which can illustrate how the sharp details are lost yet providing a realistic large-scale picture. The unblurred image of Europe is shown in the right panel. An analogy for the data from GCMs is looking at a blurred picture (middle above) while regional modeling (RCMs) and empirical-statistical downscaling (ESD) is putting on the glasses to improve the image sharpness (right above).
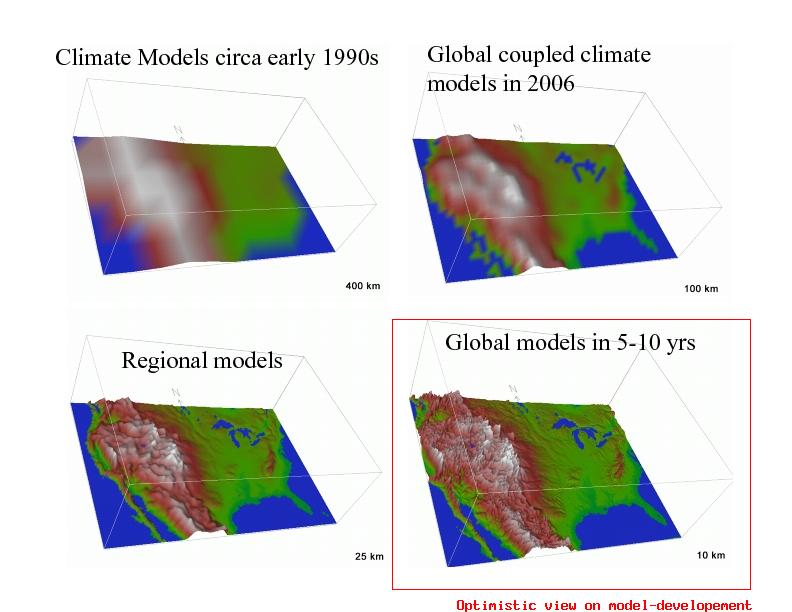
Both RCMs and GCMs give a somewhat ‘blurred’ picture albeit to different degrees of sharpness, and RCMs and GCMs are similar in many respects. However, GCMs are not just ‘blurred’ but also involve some more serious ‘structural differences’ such as an exaggerated Gibraltar Strait (see land-sea mask above), and the Great Lakes area, or Florida, Baja California are quite different and not just blurred (see figure below). Such structural differences are also present in RCMs (eg. fjords), but on much smaller spatial scales.
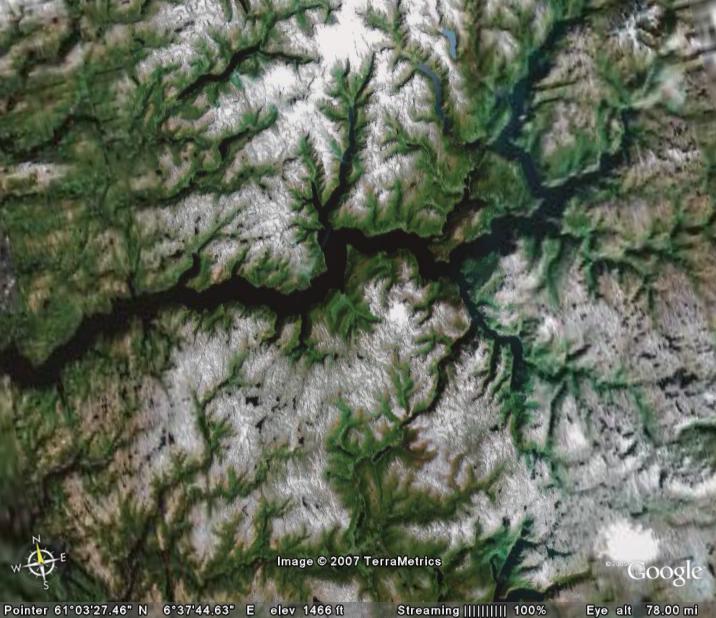
Yet the images shown here for present climate models do not really show features down to kilometer scales that may influence the local climate where I live, such as valleys, lakes, mountains and fjords, even for RCMs (the lower right panel shows an optimistic projection for improved spatial resolution in GCMs for the near future). The climate in the fjords of Norway (can be be illustrated by the snowcover) is very different from the climate on the mountains separating them. In principle, ESD can be applied to any spatial scale, whereas the RCMs are limited by computer resources and the availability of boundary data.
What is the skilful scale now?
My question is whether the concept of a skillful scale based on old GCMs still apply for the state-of-the-art models. The IPCC AR4 doesn’t say much about skilful scale, but merely states that
Atmosphere-Ocean General Circulation Models cannot provide information at scales finer than their computational grid (typically of the order of 200 km) and processes at the unresolved scales are important. Providing information at finer scales can be achieved through using high resolution in dynamical models or empirical statistical downscaling.
The third assessment report (TAR) merely states that ‘The difficulty of simulating regional climate change is therefore evident’. The IPCC assessment report 4 (chapter 11) and the regionalisation therein will be discussed in a forthcoming post.
 (Source: Strand, NCAR)
bender (#84) wrote:
Even if there are some things which fall out of the domain of what we can currently explain, that doesn’t mean that we can’t ever explain them. You understand as much – as the argument that, “Since we don’t know everything, we can’t claim to know anything” is an argument from solipsistic skepticism.
But this is explainable in terms of physics. It is called the greenhouse effect. The absorbtion of infrared by carbon dioxide and water vapor – in accordance with their lines of absorbtion? And there is a trend throughout the entire twentieth century. Plenty of decades which by themselves do not show statistically significant trends, and the same applies to an even greater degree to individual years, but the overall trend does is pretty obvious – and this is exactly what we would expect as a matter of physics.
Pointing this out isn’t parcing – it is looking at the wider context. There is a principle in the philosophy of science and statistics which you should also recognize even if you were unfamiliar with either of these two topics – when a conclusion is justified by multiple, independent lines of investigation, the justification which it receives is far greater than that which it would receive from any one line of investigation considered in isolation. But in wanting to consider only isolated pieces, you were parcing the evidence. It is a technique I have seen quite often – among creationists.
It is the methodology of science. Just because we might make mistakes doesn’t mean that we are mistaken. What you are arguing is bad philosophy. Science makes mistakes, the possibility of making mistakes is an unavoidable consequence of the attempt to understand the world. But if one practices the appropriate methodology, one will eventually uncover the areas where one is mistaken and be able to correct them. I find it surprising that I should have to explain as much to you.
OK. There will be “the highest years,” and when those occur, typically what one will see is that the next year is lower than the previous year – otherwise each year would be higher than the previous one. But the fact that 1998 was a highest year is explicable in terms of the particularly strong El Nino we had that year. But after falling back, the trend towards higher temperatures continued right up to 2005. Then 2005 beat out 1998 as the warmest year from 1890 to 2005. And while 1998 had the benefit of an unusually strong El Nino, 2005 did not. Moreover, 2005 had the coolest solar year since the mid-1980s. 2005 was pretty unusual compared with the twentieth century – but part of a trend for the past five, ten, fifteen and twenty years.
You don’t do that – particularly in internet debates – moreover, you most especially don’t do that with those parts of the same passage which tend to undercut the point which you are trying to make. Creationists do this so often that proponents of evolution gave it a name: they call it “quote-mining.” Its dishonest. And if you thought it was Ok at the time, I hope that you will avoid it in the future – whatever the topic.
When I see dishonesty, especially quote-mining, I point it out and I stress it. The individual who uses it should be shamed. Moreover, dishonesty is proof that the individual who is being dishonest realizes that reality isn’t on their side.
Arguing from logical possibility of an alternative to the conclusion that the best explanation explains nothing is an approach which belongs to radical skepticism. And thinking of this as “an opening” belongs to debate in which one is no longer concerned with the truth but winning the argument.
Very few people are as familiar with stochastic systems as climatologists – they virtually invented the study of such systems.
When someone concludes that what is true of the parts of a whole must be true of the whole without there being adequate justification for the claim, they are commiting the fallacy of composition. I believe this accurately describes what you have just done.
Provide a link or give the exact source – or else summarize what points you are trying to use in your argument.
Even probablistic behavior is mathematical behavior, otherwise it would not be susceptible to mathematical description.
As I have pointed out above, when you throw up your arms like this, you are using arguments belonging to solipsistic skepticism.
If it is susceptible to mathematical description, then it is not irreducible – its causal.
One could make the same claim with respect to trying to understand anything which is not already understood – or anything where the degree of justification does not approach cartesian certainty.
It should be particularly easy then for you to provide the quote – if it supports your argument. But don’t quote-mine.
Are you suggesting that wave-like behavior is inexplicable, or are you suggesting that wave-like behavior is inexplicable if it is not strictly regular?
The rest of your argument is of the same pattern, and I need to start getting ready for work.
Bender, you claim that “They [temperatures] have flattened by any measure” – why don’t you go to the GISS website (http://data.giss.nasa.gov/gistemp/tabledata/GLB.Ts.txt), plot temperatures from 1900 to 2006, then apply a 5 year (or 3 year, or 7 year, or whatever) moving average and plot them again? I don’t see any such so-called flattening…
Also, it is fairly clear that even if the climate system is chaotic, historical evidence suggests that it is not chaotic in such a way to make it impossible to determine likely responses to a large induced forcing. Not all chaotic systems have the same properties!
Ray (77), the prefix I like, first heard from a CERN grunt a few years back, is “lotta-” as in lottajoules, followed by “wholelotta-” as in wholelottajoules.
graham dungworth
Do we have any numbers of the levels of DMSO and MDS in the ice record, both totals of organic sulphur and the redox potential would be nice.
With regard to lightening and N2, you are right about the sink rate. Again, do we have a good measure of nitrate/nitrite in any of the ice core data?
Here’s one repository search you can click for the latter question. There’s more out there.
http://adsabs.harvard.edu/cgi-bin/nph-abs_connect?return_req=no_params&db_key=PHY&text=Not%20Available+&title=Nitrate%20plus%20nitrite%20concentrations%20in%20a%20Himalayan%20ice%20core
I am cross-posting this post from the Hansen topic, since this is (a) a fresher topic with more traffic and (b) it is about models.
In a discussion of Hansen’s latest paper over at CS, Willis E. made the following comment regarding the veracity of current climate models:
“Then we should perform Validation and Verification (V&V) and Software Quality Assurance (SQA) on the models. This has not been done. As a part of this, we should do error propagation analysis, which has not been done. Each model should provide a complete list of all of the parameters used in the model. This has not been done. We should make sure that the approximations converge, and if there are non-physical changes to make them converge (such as the incorrectly high viscosity of the air in current models), the effect of the non-physical changes should be thoroughly investigated and spelled out. This also has not been done.”
I asked him for references showing that the above have not been done. His reply was that he has no source, but that he can find no reference to any of the above having been done.
Does anybody know how true the above is? If it is in any part not true, are there any supporting references?
Gavin,
Thx for addressing bender in a head on fashion. I won’t comment on the
tactics others used ( funny, most drawn from the skeptics handbag of obsfucation). I will just say, you showed some class and kept it civil.
#100 FurryCatHerder
It appears you can download the GISS ModelE (used for AR4) from here:
http://www.giss.nasa.gov/tools/modelE/
Can’t comment on it’s user friendliness or otherwise, but I see Gavin Schmidt’s name at the bottom of the page…
re: #85
The climate system is an open system for which there is not equilibrium between the components or within individual components. Under these conditions, change is the only constant.
Re #107 Yes, thanks to gavin and to others too.
In #85, Gavin responded: “The GCM equilibrium is in a statistical sense, as you well know, and there is plenty of internal variability. – gavin”
I am not sure what do you mean. Do you mean that the 30-year average of pseudo-weather’s quasi-oscillations still have substantial variability, or that the ocean model and coupling between ice cups and something else has intrinsic variability on its own?
In #95, Ray wrote: “First, there is no evidence climate is chaotic.”
There is plenty of evidence. For example, Prof. C. Wunsch has examined almost every known proxy and performed time series analysis of them, e.g. http://ocean.mit.edu/~cwunsch/papersonline/milankovitchqsr2004.pdf
The typical conclusion is that
“record of myriadic climate variability in deep-sea and ice
cores is dominated by processes indistinguishable from
stochastic, apart from a very small amount (less than
20% andsomet imes less than 1%) of the variance
attributable to insolation forcing. Climate variability in
this range of periods is difficult to distinguish from a
form of random walk”
Spectral power density of climate variations appears to be continuous power-law functions, which is a good indication of chaotic behavior.
“Certainly there seem to be epochs in the history of the planet where the climate was more or less predictable, but on the whole you can say that climate certainly is predictable in a piecewise fashion.”
Everything is predictable on a piecewise basis, the question only is if you can predict which direction the piece is heading after a turn. Even a sine function can look like a flat (“stable?”) twice in the cycle.
“If the source is not increased greenhouse activity from anthropogenic CO2, what is it?”
How about solar wind activity that changes formation of clouds and acts as a strong shutter to solar radiation?
re 106, V&V and SQA of the models:
First, saying “Then we should …” immediately raises the question of who the “we” are. V&V is seldom used, even on military applications, except for highly mission critical or human safety systems. This is because V&V can come close to doubling the cost of a project. This is evident from the sort of questions in the quote, “… error propagation analysis…,” “…complete list…,” “make sure … converge…,” “thoroughly investigated.” These questions are asked in a “prove it to me” tone of voice. The modelers now not only have to build models that match observed phenomena, they have to provide evidence (that would not otherwise have been developed) to satisfy the V&Vers. You are going to need as many V&Vers as you have developers (they are going to verify all of the analytical work) and the V&Vers themselves need to be qualified climate scientists to understand what they are looking at.
So who pays?
Is any of this of any benefit? No. There are better, cheaper ways to assess the quality of software. In this particular case, the fact that the couple dozen climate models in the world all pretty much agree shows that they are free of disqualifying defects (assuming that they were designed and coded independently.)
By way of reference, in the 7 years I spent at NASA Goddard, I never heard of a project, even for flight software, that used real IV&V (Independent V&V). They called using a separate test team IV&V, and calculated that it added 5% to 15% to the cost of a project. Note that an independent test team can’t answer any of the questions in the original post. This was the shop that built the flight control software for nearly all of NASA’s earth satellites for decades. They understood software quality.
The second thing that a call for V&V does is misunderstand scientific, and perhaps all, modeling. V&V’s goal is to answer two questions: Was the system built correctly? and Does the system as built meet the requirements? But notice that the goal of any model building is to better understand the thing being modeled. So where are the requirements specified? In Nature? How do we trust the V&V team to better understand the subject than the modelers?
I reluctantly conclude that the call for V&V is either deeply ignorant of real-world software development, or is just another piece of FUD trying to impeach climate models.
In the process of composing my previous comment, I downloaded modelE from the giss site and took a quick look at the code. From a completely non-rigourous assessment of two modules, it looks like it was written by fully competent programmers. The code is modular. I didn’t see any overly-long subroutines. There are plenty of comments that look like they would mean something to somebody who understands the domain. I didn’t notice any routines with excessive cyclomatic complexity.
It’s been 18 years since I worked with FORTRAN, so I’m not competent to thoroughly evaluate the code, but it certainly passes my quick look.
I wish the Java I’m working on now was as well written.
Alexi, you say, “I usually keep in mind that if the system is open (like Earth), energy is not conserved.”
That is an excellent point, and I stand corrected. It’s easy to fall into the trap of thinking of the climate in simple thermodynamic terms, as in ‘system and surroundings’ – and ‘internal oscillations of the climate system’ – as if the Earth’s climate behaved like a piston, or like a mass on a spring. Of course, energy is always conserved, even in open systems – it just can leave the system, is all.
However, the basic rules of heat transfer still apply to the Earth, and we can note that a body can only lose heat via conduction, convection and radiation. We also know that the oceans absorb warm up very slowly due to the high heat capacity of water, and that the ground has low heat capacity. So, how can we get at a net energy balance for the Earth?
See, for example, Gavin’s earlier post, Planetary Energy Imbalance? The issue is succinctly summed up in the statement in that post “Since the heat capacity of the land surface is so small compared to the ocean, any significant imbalance in the planetary radiation budget (the solar in minus the longwave out) must end up increasing the heat content in the ocean.”
Still, this is not a direct measurement of radiative imbalance (ocean heat content, that is), and thus includes some assumptions. How do we get a better measure? Well, one could look at the Earth from a good vantage point (space) and measure the solar energy balance directly – as the plan for NASA’s Deep Space Climate Observatory. This project would cost $100 million and the instrument has already been built – but has been mothballed by NASA (clink on the link). For some reason, NASA can’t come up with the money.. but they can come up with $5.6 billion for Hewlett Packard.. certainly a fine company, but what’s up?
Perhaps this quote by the NASA chief on NPR explains this: “I guess I would ask which human beings – where and when – are to be accorded the privilege of deciding that this particular climate that we have right here today, right now is the best climate for all other human beings. I think that’s a rather arrogant position for people to take.”
Yes- attempting to address global warming is ‘arrogant’, according to the head of NASA, who can’t seem to come up with funds for climate satellites any more.
P.S. “First, there is natural variability that is tied to external forcings, such as variations in the Sun, volcanoes, and the orbital variations of Earth around the Sun. The latter is the driving force for the major ice ages and interglacial periods. Second, there is natural variability that is internal to the climate system, arising, for instance, from interactions between the atmosphere and ocean, such as El Niño. This internal variability occurs even in an unchanging climate.” (From Trenberth 2001 Sci)
Would one classify alterations of carbon cycle dynamics as �internal variables�? For example: the saturation of the oceans with respect to CO2 resulting in less uptake, the transition from forest to grassland resulting in less biosphere carbon storage in the expanding dry subtropical zones, and the melting of northern permafrost resulting in release of frozen carbon as CH4 or CO2? Tamino had an interesting post on this issue (A CO2 surge?).
Basically, climate scientists seem to understand the physics of the unforced internal variability well enough to rule it out as the cause of the observed temperature trend, and they understand the physics of the forcings well enough to attribute the observed temperature increase to anthropogenic changes in greenhouse gases. What still seems uncertain to us humble observers is the response time of the system, but it sure seems to be tending toward the rapid end of the possibilities… which is not good news.
“PAL” means “Present Atmospheric Level.” When a paleoclimatologist says an old Earth atmosphere was 30% oxygen, that’s not “30% PAL.” That’s about 150% PAL. And the surface pressure of Venus is 92 bars, not 200.
Re #106
Walt, There was a large study performed trying to reconcile the measurements made using radiosondes with the models for the lower atmosphere of the tropics (local climate?) “Temperature Trends in the Lower Atmosphere: Steps for Understanding and Reconciling Differences.” Thomas R. Karl, Susan J. Hassol, Christopher D. Miller, and William L. Murray, editors, 2006. A Report by the Climate Change Science Program and the Subcommittee on Global Change Research, Washington, DC. http://www.climatescience.gov/Library/sap/sap1-1/finalreport/
In Chapter 5 [Santer et al. 2006] two key points are made:
� For longer-timescale temperature changes over 1979 to 1999, only one of four observed upper-air data sets has larger tropical warming aloft than in the surface records. All model runs with surface warming over this period show amplified warming aloft.
� These results could arise due to errors common to all models; to significant non-climatic influences remaining within some or all of the observational data sets, leading to biased long-term trend estimates; or [to] a combination of these factors. The new evidence in this Report (model-to-model consistency of amplification results, the large uncertainties in observed tropospheric temperature trends, and independent physical evidence supporting substantial tropospheric warming) favors the second explanation.
IMHO, the final sentence seems to imply that since the models all agree then there cannot be “errors common to all models.” Walt, I leave it to you to decide whether this is a plausible reading, and if so whether this is plausible.
Alexi, First, energy is conserved whether the system is open or closed–the energy has to come from somewhere. Where? Your reference to solar winds is incomplete, but I can only assume you are talking about the modulation of galactic cosmic rays by solar winds, since solar particles are largely below the geomagnetic cutoff. The main problem here is that the GCR fluxes are not changing–per either the neutron-flux data or the satellite data. The GCR mechanism is not persistent, and for it to change the climate, it must be changing itself. It is not. And even if it were a credible mechanism, there would then be the question of why a greenhouse gas would magically stop functioning as a greenhouse gas above ~320 ppm.
It surprises me that you would take comfort in the idea the climate is chaotic. Certainly hundreds of millions of farmers depend on climate being somewhat predictable, and during the era in which they have been farming, it largely has been. Now certainly the past 10000 years have been a period of exceptional stability. If climate is indeed chaotic, that stability can only be viewed as a quasi-stable strange attractor, and by perturbing the climate away from that attractor we risk inducing much more chaotic activity in which agriculture would be largely impossible. I would contend that this would make it all the more important to limit CO2 emissions. Now certainly, this makes for some fascinating speculation: Did civilization begin when the climate stabilized to the point where agriculture became more profitable than a hunter-gatherer lifestyle? It is possible, but the more relevant point is that the planet will not support a population of 9 billion hunter-gatherers, and I would consider that a significant issue if we want human civilization to continue.
Ike: Regarding Mike Griffin’s comments, I have to say I was appalled. My God, why does he have world-class climate scientists on staff if he is not going to listen to them?
Re: the new focus of NASA, you might appreciate the essay by Tom Bodett
http://www.tombodett.com/storyarchive/homeplanet.htm
Warning, don’t drink coffee while reading this as you could scald your nasal passages.
“Nowhere in NASA’s authorization … is there anything at all telling us that we should take actions to affect climate change …. we study …. I’m proud of that ….” — Mike Griffin on NPR
Well, not since the Administration took that OUT.
Do we assume he’s also going to cancel the watch for asteroids on Earth-crossing orbits?
The rate of change from an asteroid impact is closer to the rate of change from fossil fuel impacts than either of those are to any other climate change event we know about, I think. Doesn’t the man understand rate of change of rate of change? Calculus??
re: #106, 113, 114
I concur that documentation that software V&V and SQA procedures have been applied to NWP and AOLGCM software has proven to be very difficult to locate.
Additionally, I suggest you get an update on the status of software V&V and SQA within NASA, and see this report for detailed discussions of code-to-code comparisons as a procedure for V&V and SQA, in which you’ll find:
The Seven Deadly Sins of Verification
(1) Assume the code is correct.
(2) Qualitative comparison.
(3) Use of problem-specific settings.
(4) Code-to-code comparisons only.
(5) Computing on one mesh only.
(6) Show only results that make the code �look good.�
(7) Don�t differentiate between accuracy and robustness.
A good starting point might be the information in the literature references listed here.
Finally, check out some of the additional information about ModelE under code counts.
Re #118 by Ray —
If you look at the aa index (verbosity here), as well as the affect of cosmic radiation on cloud formation, I’m sure you’d find more than enough evidence that GCR is far from a constant. Whether or not it’s a major factor is open to debate, but looking at a graph of aa over the past 150 years looks a lot like looking at the temperature graph. Tim and I had a discussion about this sort of thing a few weeks back, so perhaps he can repost the article he found.
FurryCatHerder, First, you have to consider the 11-year solar modulation, which does indeed affect GCR flux considerably, just as it affects geomagnetic field. That would not explain the warming effect–you’d have to be seeing decreasing solar wind to let in more GCR particles. The solar particles won’t do it by themselves as they are mostly below the geomagnetic cutoff even during magnetic storms (exceptions would be really big flares like the Carrington Event in 1854, the ’56 event, the ’72 event and maybe the ’89 event). If you compare fluxes at the same stage of the solar cycle, they’re consistent within expected Poisson errors.
Lots of things vary with the solar cycle. Also, look at graph–it ends in 1998–and 1998 which was one of the hottest years ever is low on the AA scale. And unlike CO2, there’s no persistence to the effect–if the flux isn’t decreased, then cloud formation doesn’t decrease and you don’t get increased solar irradiance. The GCR mechanism really isn’t credible–the flux is only 5 per cm^2 per second, so it’s kind of hard to figure out how that can be significant anyway.
Ray @#122:
Ray,
I don’t think the chart ending in 1998 is relevant — the aa index and sunspot count are related (chart), and SC23 was only slightly less robust than SC22.
This is the comment I take issue with —
“And unlike CO2, there’s no persistence to the effect–if the flux isn’t decreased, then cloud formation doesn’t decrease and you don’t get increased solar irradiance.”
If you look at the aa index, you see that the rise in the minimum above prior decades maximum values makes the change in aa index “persistent”. This comment is from the paper I referenced with “verbosity here” above —
“Although not documented here, it is interesting to note that the overall level of magnetic disturbance from year to year has increased substantially from a low around 1900 Also, the level of mean yearly aa is now much higher so that a year of minimum magnetic disturbances now is typically more disturbed than years at maximum disturbance levels before 1900.”
That would provide the persistent trend towards decreasing cloud formation and increasing irradiance.
The May 25 edition of Science has a report on regional climate projections for American southwest. Figure 1 (available here) shows the median results of 19 AR4 model projections for precipitation and evaporation for this region. The most obvious feature, other than a drying trend, is a 10 year precipitation cycle (the blue line). According to the paper, this is driven by the El Nino / Na Nina cycle.
I would expect that as model projections go farther into the future, that model results would increasingly diverge, and the average (or median) might show a trend, but would not show decadal variation in that trend. Yet looking at the graph, I see a very clear and intense La Nina cycle starting in 2080. Considering that presently we cannot predict that cycle even a year in advance (an unexpected El Nino is why last year’s hurricane forecast was so wrong), I would like to know how 19 climate models could all predict such a result.
FurryCatHerder, First, yes there is a correlation between sunspot number and geomagnetic distrubance. This is because sunspot number correlates roughly with solar activity, which correlates with the solar wind density. Solar wind is a plasma, and so the moving charged particles generate magnetic disturbances in the geomagnetic field. Many other things can also change geomagnetic field–including the geodynamo in the core. Since we’re heading for a field flip in another few thousand years, there’s considerably variability now than at any time in the instrument record.
However, solar wind particles themselves do not penetrate the geomagnetic field (except near the poles as the aurora) except for extreme solar particle events. The argument is that solar wind modulates the flux of galactic cosmic rays, which create showers of charged particles in the atmosphere and seed cloud formation. There are several things wrong with this argument. First, there is no evidence that the atmosphere lacks for nucleation centers for cloud formation in the firstplace. Second, GCR fluxes are small–5 particles per cm2/sec in free space on average–and less by the time they penetrate the geomagnetic field. Third and most damning–GCR flux is not changing–not since ~1975 if you look at the satellite record, and not since the 1950s based on neutron fluxes measured at ground level (the neutrons are produced by the GCR as end products of the showers). You can find all sorts of patterns if you look at solar variability. However, you have to ask yourself whether that variability is sufficiently large to explain the observed effects, and if it’s not, what amplification mechanism do you propose. So far no one has anything that comes close to a coherent theory. Anthropogenic CO2 on the other hand is known physics and sufficiently large to explain the effects we are seeing. If you contend that Svensmark’s ideas are credible, then you have to explain why CO2 is a less effective ghg than we thought–as well as developing a coherent theory for amplifying the GCR effect.