 In a recent issue of the journal Astronomy and Geophysics (A&G), Henrik Svensmark coined a new term: ‘cosmoclimatology’ . I think ‘cosmoclimatology’ is a good and refreshing name for anything combining our cosmos with our climate. However, all other aspects of the article I found very disappointing. We have already covered most of these topics before, but the A&G articles provides us with some new aspects to discuss. Furthermore, Svensmark is the Director for Center for Sun-Climate Research, Danish National Space Center, and therefore influential. He is also the co-author of a recent book with Nigel Calder that received some attention. Furthermore, a laboratory experiment of his also managed to make some headlines. It seems that solar forcing is one of the sceptics’ last trenches in the debate about climate change. In my view the A&G paper therefore merits a comment as long as the same old and worn arguments resurface without discussing misgivings from the critics.
There are a number of issues which really make the A&G paper poor in my view. One is the neglect in addressing old criticisms of the hypothesis that galactic cosmic rays (GCR) change our climate by modulating clouds (see here, here, & here). Svensmark is very vague on the lack of any trend in GCR or other solar proxies since 1952. I confronted him about this question on an European Geophysical Society (EGS) conference in Nice a few years ago, and have since published a paper also making the point. The A&G article makes selective references, without answering the serious criticism forwarded by Damon & Laut (2004), Laut (2003), or myself. To be fair, the critical paper by Kristjansson and Kristiansen (2000) is cited, albeit only to say that Svensmarks’s own conclusion is “a counter-intuitive finding for some critics“. The remaining treatment of critical aspects is completed in the A&G article without further qualifications other than the following passage (my emphasis):
The chief objection to the idea that cosmic rays influence cloudiness came from meteorologists who insisted that there was no mechanism by which they could do so. On the other hand, some atmospheric physicists concluded that observation and theory had failed to account satisfactorily for the origin of aerosol particles without which water is unable is unable to condense to make clouds.
I don’t think this is meant as a joke, and I don’t know if the article tries to make a point about classifying critics and supporters of his ideas as ‘meteorologists’ and ‘physicists’ (I’m a physicist). But that’s a tiny detail compared to the more substantial misconceptions embedded in this passage. There are plenty of ‘seeds’ in the air on which water can form, also known as cloud condensation nuclei (CCN). According to my old text book ‘A Short Course in Cloud Physics’ by Rogers and Yau (1989, p. 95 in Third edition): “Condensation nuclei of some sort are always present in the atmosphere in ample numbers: clouds form whenever there are vertical air motions and sufficient moisture”. The CCN tend to consist of mineral dust, sea salt, or sulphur-based matter.
I have serious misgivings concerning the following – vague yet false – statement put forward in the A&G article :
Attempts to show that certain details in the climatic record confirm the greenhouse forcing (e.g. Mitchell et al., 2001) have been less conclusive. By contrast, the hypothesis that changes in cloudiness obedient to cosmic rays help to force climate change predicts a distinctive signal that is in fact very easily observed, as an exception that proves the rule.
Again, no further qualifications or references. The irony is that Svensmark ignores (in addition to the lack of trend in GCR) the fact that the night-time temperature has risen faster than the day-time temperature, which I did pester him about on a Nordic Meteorology Meeting in Copenhagen in 2002. A journalist from Jyllands Posten present at the conference got the message, as my criticism was echoed in a news report the following day (“Klimaforskere i åben krig” [translation ‘Climate researchers in open war’], May 28, 2002): It’s tricky to explain how a warming caused by decreasing albedo would be stronger at the night-side (dark) of the planet.
Another newer puzzle is the surprisingly good correlation between low clouds and GCR (se figure below), since higher clouds (global mean cover ~13%) or middle clouds (~20%) which are not influenced by GCR, mask the lower ones (which represents between 28% and 30% of the globe). It’s indeed a surprisingly good fit between the two curves in the A&G article (reproduced below), considering the time structure of both the high-cloud, middle-cloud, and low-cloud curves, and the satellites cannot see the low-level clouds where there are higher clouds above blocking the view. The fact that the variations are small (~1% amplitude!) compared to the total area, suggest that the overlap/masking effect by the higher cloud must be very small for a high correlation to shine through the upper clouds. Even if the clouds hypothetically were completely determined by GCR, one would expect to see deterioration of the correlation if viewed from above due to the presence of higher clouds not influenced by GCR. Another issue is that the cloud data used in this analysis was only based on the infra-red (IR) channel, and a better analysis would include the visible observations too, but if the visible data are included, then the correlation is lower (private communications, Jørn Kristjansen).
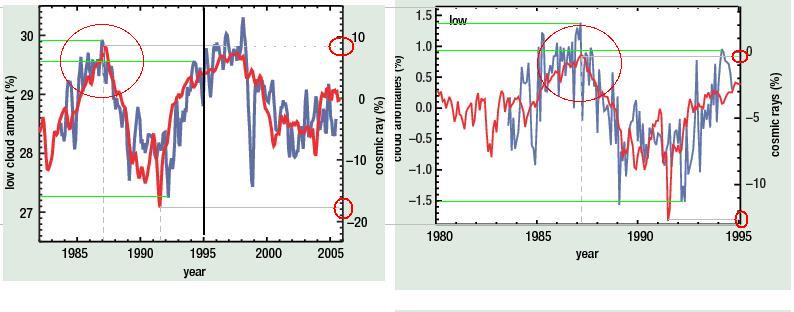
On a more technical note, there seems to be inconsistencies between the GCR presented in Fig 2 and 3 in the A&G article (see red circles in the plot above), and this is not explained in the article. In Fig. 3 (left panel above) the GCR count increases by 10% but the maximum value is about 0% in Fig. 2 (right panel above), and the minimum value is abut -18% in Fig 3 but only -13% in Fig 2. It seems as if Fig 2 & 3 were based on different data sources. To be fair, both GCR and ISCCP are continuously updated and revised. But I am surprised that routine update and revision would result in as large differences as seen here. It looks as if the curve has been readjusted at some stage, but it is then a bit strange that the curve representing the global lower cloud cover doesn’t seem to have been re-scaled: the difference between maximum and minimum is about 3% in both figures (it’s annoying that the vertical axis for the cloud cover are given in different units in Fig.2 & 3). Is this important? I don’t know. But it could be a sign of sloppy work. There is not sufficient information about methodology that I could repeat the results presented here.
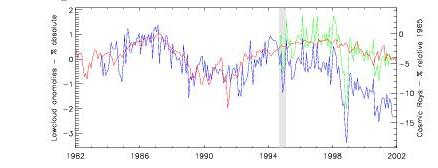

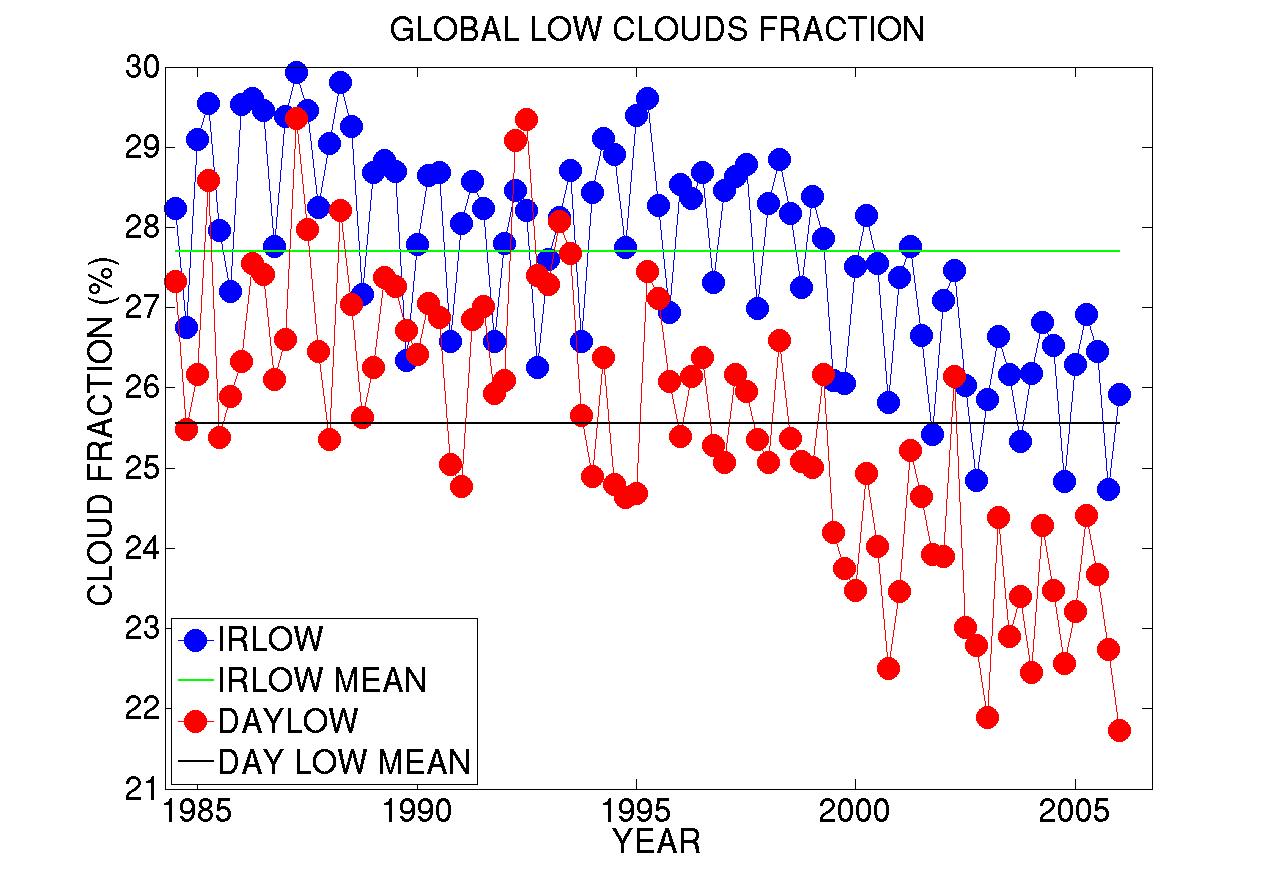
Svensmark must have adjusted the cloud data too. Shown below is a figure from a previous paper where he justified an adjustment from a break in the difference between low and high clouds. The question is: why would the error be in the lower cloud measurements and not the high clouds? I haven’t seen any other independent statements about breaks or problems in the data series for low clouds after ~1995. Apparently, there are some biases in the ISCCP data, and Stordal et al. (2005) suggest that there is a spurious “footprint” from METEOSAT imprinted on the high (cirrus) clouds, and the problems with the ISCCP trends are now becoming well known. Besides, the fundamental error Marsh and Svensmark made in their ‘correction’ has discussed before, but since this issue keeps re-appearing, the ‘adjustment’ is shown again (left) while the ‘adjustment’ cannot be discerned in independent plots of the most recent data (right, and a second opinion sought in an independent analysis by K. Gislefoss).
In the A&G article, GCRs get the blame for the ‘snowball earth‘ episodes, and Svensmark writes:
A surprising by-product of this line of enquiry is a new perspective on changing fortunes of life over 3.5 billion years ago.
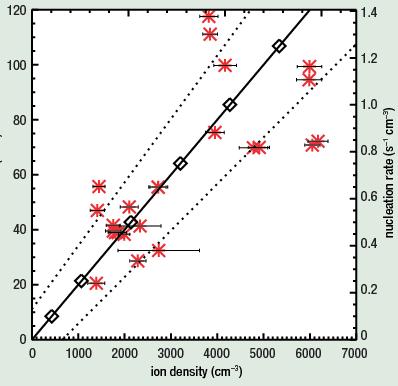 Furthermore, the paper claims to explain the ‘faint sun paradox‘, by the complete absence of low clouds because there were allegedly no GCR at the time. Presumably, it is seriously meant. Proposing that the GCR is the only factor affecting low clouds, is inconsistent with the result shown in his very own Fig. 4 (the scatter plot shown left). In the A&G article, Fig 4 doesn’t really show the relationship between GCR and clouds, but between ion density and numbers of ultra-small (radius greater than 3 nano-meters) aerosol nucleation. The large scatter suggests that the number of ultra-small aerosols is fairly weakly affected by the number of ions – otherwise all the points would lie close to the diagonal line. This implies that other factors must influence the formation of ultra-small aerosols in addition to some effect due to ionization. And this is only in the laboratory environment – on the outside of Svensmark’s test chamber, more factors may play a role.
In the laboratory experiment ‘SKY’, UV-light was modulated to mimic the variations in the Sun, but it is not clear whether the effects observed due to changes in the UV are transferable to GCR. The experiment also involved natural GCR (as opposed to a particle beam which presumably would be easier to control), supplemented with gamma rays. Then the aerosols were according to the article stable ultra-small clusters of sulphuric acid. So, what about the larger aerosols which play a role in cloud formation? According to “Atmospheric particles and nuclei” by Götz et al. (1991), Junge (1963) proposed on the basis of aerosol measurements that ‘large’ and ‘giant’ particles (radius greater than 0.1 micro-meter) constitute the majority of CCN, independently of their chemical composition. Besides, the Köhler curve (also see here) based on theoretical work from 1926 and onwards indicates that droplets only start to grow spontaneously only the droplet is greater than a critical size (they are then ‘supercritical’). The number of sulphuric aerosols is also influenced by the availability of sulphur in general. The amount of sulphur can vary, e.g. with the combustion of fossil fuels, volcanic eruptions, as well as due to biological activity (i.e. through the emission of dimethyl sulphide, or ‘DMS’; Götz et al. ,1991, p. 108), and presumably the number of sulphuric acid clusters formed over the past billion years can have been affected by several of geological factors. Besides, it is the vapour pressure (or ‘supersaturation’) which really control whether cloud drops or not, seeing as aerosols tend to be around anyway. I also have some general questions regarding isotopic evidence from pre-historic times. Are isotopes from the distance past only created by GCR bombarding Earth’s atmosphere or could there be other sources? Could some be introduced by meteorite/astroid impacts, volcanic activity, or different emission of radon gas from Earth’s interior?
I would expect the albedo effect presented by clouds to be weak over the mostly snow/ice covered Antarctica, but Svensmark argues that the clouds here warm rather than cool the temperature. This claim is not quantified. Is he suggesting some GHG-effect kicking in during the Antarctic winters? Is the sense/chronology of causation really determined? What about temperature affecting the cloudiness (e.g. advection of mild and moist air), and the role of circulation patterns? For sure, there is no simple one-way relationship. I think that the A&G article is bit too cavalier about the complexity involved in the atmospheric processes. The cavalier attitude seems to be a trademark of cosmoclimatology.
I presume that many celestial bodies and complicated calculation of gravitational pull must make the modelling of the galaxy dynamics difficult, and star formation processes must have altered the distribution of mass and hence the gravitational field. So, surely the dynamics of the stars over billions of years can be characterised as chaotic? Is it really possible to re-construct the constellations and our solar systems trajectory around the galaxy more than 2 billion years ago with a precision which precedes that of calculating the effect of increasing the GHG concentrations at present day? Is the story as simple as the one narrated by Svensmark? He even suggests that his ideas amount to a paradigm shift, that ‘scientifically speaking’ is as secure as the prevailing paradigm of AGW. I find this sweeping statement a bit puzzling as no further qualification is made on the matter of AGW. Exactly what are the weak points in the AGW paradigm? I wonder if Svensmark really knows what he talks about.
It is possible that GCRs do have an effect on climate through the modulation of clouds, but I don’t think it is very strong. I also think that Svensmark’s claims are wildly exaggerated, but most of my objection lies in the way the arguments have been presented in this A&G article. I have the impression that the A&G article comes from the same school as “The Skeptical Environmentalist“, which also has been criticised for cherry picking references to make mere speculation appear as more solidly founded. To ignore aspects that don’t fit the hypothesis is definitely not science. Neither is adjusting data so to provide a good fit without a solid and convincing justification. Science, however, means objectivity, transparency, repeatability, and in principle the possibility of falsification. Furthermore, it is only a lack of respect for the readers to publish an article that doesn’t provide all relevant sides to the story. I hope that Svensmark reads my comments and responds to them here at RealClimate. I also hope that this is read by scholars and journalists who start asking the critical questions. I do not know the answer to the questions that I pose here, so I’d be interested to hear your view.
AcknowledgementsThanks to Jørn Kristiansen for comments and input to my post and Kristian Gislefoss for one figure on global low cloudiness.
Numa recente edição da Astronomy and Geophysics (A&G), Henrik Svensmark cunhou um novo termo: ‘cosmoclimatologia’. Eu acho que ‘cosmoclimatologia’ é um nome bom e renovador para qualquer coisa que combine nosso cosmos com nosso clima. Contudo, achei muito desapontador todos os outros aspectos do artigo. Já cobrimos a maioria desses tópicos antes, mas o artigo da A&G nos dá alguns novos aspectos para discutir. Além do mais, Svensmark é o diretor do Centro de Pesquisa sobre o Sol-Clima, do Centro Nacional Espacial Holandês, e portanto é muito influente. Ele é também co-autor de um livro recente com Nigel Calder que recebeu alguma atenção. Ainda mais, um experimento de laboratório seu também ganhou notoriedade. Parece que a forçante solar é uma dasúltimas trincheiras dos céticos no debate sobre mudanças climáticas. Na minha visão, o trabalho da A&G merece então comentários, dado que os mesmos velhos e ultrapassados argumentos resurgem sem se discutir os temores dos críticos.
Existem algumas questões que tornam o trabalho da A&G realmente pobre ao meu ver. Uma delas é a omissão de responder as velhas críticas da hipótese de que raios cósmicos galáticos (sigla em inglês GCR) mudam nosso clima modulando as nuvens. (veja aqui, aqui e aqui). Svensmark é muito vago sobre a falta de tendência nos GCR ou em outras variáveis solares desde 1952. Eu o questionei sobre isso numa conferência da Sociedade Européia de Geofísica (sigla em inglês EGS) em Nice há alguns anos atrás, e publiquei também um trabalho sobre esse ponto. O artigo da A&G seleciona as referências, sem no entanto responder as sérias críticas enchaminhadas por Damon & Laut (2004), Laut (2003) e eu
mesmo. Para ser honesto, o trabalho crítico de Kristjansson e Kristiansen (2000) é citado, embora somente para dizer que a própria conclusão de Svensmark seja “um achado contra-intuitivo para alguns críticos“. O tratamento restante dos aspectos críticos no artigo da A&G é sem maiores qualificações, a não ser a seguinte passagem (minha ênfase):
A principal objeção para a idéia de que raios cósmicos têm influência na cobertura de nuvens veio de meteorologistas os quais insistiram que não haveria mecanismo capaz de produzir isso. Por outro lado, alguns físicos atmosféricos concluiram que a observação e a teoria falharam em considerar satisfatoriamente a origem das partículas de aerossóis sem as quais a água não condensa para formar nuvens.
Eu não acho que isso seja uma piada, e não sei se o artigo tenta criar uma classificação de críticos e adeptos de suas idéias como ‘meteorologistas’ e ‘físicos’ (eu sou físico). Mas este é um detalhe diminuto comparado com os conceitos errados incluídos nessa passagem. Existem muitas ‘sementes’ no ar que podem condensar água, também conhecidas como núcleos de condensação de nuvens (sigla em inglês CCN). De acordo com meu velho livro ‘A Short Course in Cloud Physics’ de Rogers
e Yau (1989, p. 95, terceira edição): “Núcleos de condensação de algum tipo estão sempre presentes na atmosfera em grande número: nuvens se formam sempre que há movimentos verticais de ar e suficiente umidade”. Os CCN consistem na maioria das vezes de poeira mineral, sal marinho ou material sulfuroso.
Eu tenho sérias dúvidas sobre a seguinte – vaga ainda que falsa – afirmação colocada adiante no artigo da A&G :
Tentativas de mostrar que certos detalhes nos dados climáticos confirmam a forçante de efeito estufa (por exemplo Mitchell et al., 2001) têm sido menos conclusivas. Em contraste, a hipótese de mudanças nas nuvens devido aos raios cósmicos que ajuda a forçar uma mudança climática prevê um sinal distinto que é na verdade muito facilmente observado mais como uma exceção do que uma regra.
De novo, sem mais qualificações ou referências. A ironia é que Svensmark ignora (além da falta de tendência dos GCR) o fato de que as temperaturas noturnas têm subido mais rápido do que as temperaturas diurnas, ponto pelo qual eu o incomodei numa Reunião Nordica de Meteorologia em Copenhagen em 2002. Um jornalista do Jyllands Posten presente na conferência captou a mensagem, de modo que minha crítica repercurtiu num jornal no dia seguinte (“Klimaforskere i åben krig” [tradução ‘Pesquisadores do clima em pé de querra], 28 de maio, 2002): É difícil explicar como um aquecimento causado pela diminuição do albedo poderia ser mais forte no lado escuro (noite) do planeta.
Um outro quebra-cabeça está na surpreendentemente boa correlação entre nuvens e GCR (veja figura abaixo), tendo em vista que nuvens altas (cobertura média global de ~13%) ou nuvens
intermediárias (~20%) que não são influenciadas por GCR, mascaram as nuvens baixas
(que representam entre 28% e 30% do globo). É de fato supreendente o bom ajuste entre as duas curvas no trabalho da A&G (reproduzido abaixo), considerando a estrutura de tempo nas curvas de altas, intermediárias e baixas nuvens, e que os satélites não podem ver as nuvens de baixo nível onde acima existem nuvens de níveis mais altos bloqueando a visão. O fato é que as variações são pequenas (~1% em amplitude!) comparadas com a área total, sugerindo que o efeito de sobreposição/mascaramento por nuvens altas deve ser muito pequeno para uma alta correlação acontecer através de nuvens elevadas. Mesmo se hipoteticamente as
nuvens fossem completamente determinadas por GCR, poderíamos esperar ver uma deterioração da correlação se vista por cima, devido à presença de nuvens altas não influenciadas por GCR. Outra questão é que os dados de nuvens usados nessa análise foram somente baseados no canal infra-vermelho (sigla em inglês IR),
e uma melhor análise deveria incluir as observações no visível também, mas se os dados do visível são incluídos, então a correlação seria menor (comunicação pessoal, Jørn Kristjansen).
Numa nota mais técnica, parece haver inconsistências entre o GCR apresentado nas Figuras 2 e 3 do artigo da A&G (veja os círculos vermelhos no gráfico acima), e isto não é explicado no artigo. Na Fig. 3 (gráfico da esquerda acima) o GCR aumentou em 10% mas o máximo valor é cerca de 0% na Fig. 2 (gráfico da
direita acima), e o mínimo valor é aproximadamente de -18% na Fig 3 mas somente -13% na Fig 2. Parece que as Fig 2 & 3 foram baseadas em fontes diferentes de dados. Para ser justo, ambos GCR e ISCCP são continuamente atualizados e revisados. Mas fico surpreso que a rotineira atualização e revisão resultem em grandes diferenças como vistas aqui. Parece como se a curva tivesse sido reajustada em algum estágio, mas é então um pouco estranho que a curva representando a cobertura de nuvens baixas não parece ter sido rescalonada: as diferenças entre o máximo e o mínimo é de cerca de 3% e ambas figuras (é chato que os eixos verticais para a cobertura de nuvens são dados em unidades diferentes na Fig.2& 3). Será isso importante? Não sei. Mas pode ser um sinal de um trabalho mal feito. Não há informação suficiente sobre a metodologia para que eu pudesse repetir os resultados apresentados aqui.
Svensmark certamente deve ter ajustado os dados de nuvem também. Acima é mostrada uma figura de um artigo anterior no qual ele justifica um ajuste de uma quebra na diferença entre nuvens baixas e altas. A questão é: por que o erro estaria nas medidas de nuvens baixas e não nas de
nuvens altas? Eu não tenho visto quaisquer outras declarações independentes sobre quebras ou problemas na série de dados para nuvens baixas depois de ~1995.
Apparentemente, existem algumas tendências nos dados do ISCCP, e Stordal et al. (2005) sugere que existe uma marca espúria do METEOSAT impressa nas nuvens altas (cirrus), e os problemas com as tendências do ISCCP estão agora se tornando bem conhecidas. Junto a isso, o erro fundamental que Marsh e Svensmark fizeram em
suas ‘correções’ foi já
discutido, mas como essa questão continua reaparecendo, o ‘ajuste’ é novamente mostrado (esquerda) enquanto que o ‘ajuste’ não pode ser discernido em gráficos independentes nos dados mais recentes (direita, e uma segunda opinião vizualizada numa análise independente de K. Gislefoss).
No artigo da A&G article, os GCR seriam responsáveis pelos episódios de ‘bola de neve da Terra‘, e Svensmark escreve:
Um surpreendente produto dessa linha de questionamento é uma nova perspectiva da mudança do destino da vida ao longo dos últimos 3,5 bilhões de anos.
Além disso, o artigo pretende explicar o ‘paradoxo solar fraco‘, pela completa ausência de nuvens baixas pois alegadamente não havia nenhum GCR naquele tempo. Presumivelmente, isso é levado a sério. Propor que os GCR sejam o único fator afetando nuvens baixas é inconsistente com o resultado
mostrado na muito sua Fig. 4 (a plotagem mostrada à esquerda). No artigo da A&G, a Fig 4 realmente não mostra a relação entre GCR e nuvens, mas entre densidade iônica e os números de ultra-pequenos (raio superior a 3 nanometros) aerossóis de nucleação. A grande dispersão sugere que o número de aerossóis ultra-pequenos é muito fracamente afetado pelo número de ions – do contrário, todos os pontos situariam-se próximos à linha diagonal. Isso implica em outros fatores que devem influenciar a formação de aerossóis em adição a algum efeito devido à ionização. E isso é somente no ambiente de laboratório – fora da câmara de teste de Svensmark mais fatores devem desempenhar algum papel.
No experimento de laboratório ‘SKY’, a luz UV (ultravioleta) foi modulada para mimetizar a variação do sol, mas não ficou claro se os efeitos observados devido às mudanças no UV podem ser tranferidos aos GCR. O experimento também envolveu GCR naturais (em oposição a um feixe de partículas que presumivelmente seria mais fácil de controlar), suplementado com raios gama. Os aerossóis foram, de acordo com o artigo, grupos ultra-pequenos estáveis de ácido sulfúrico. Então, o que dizer dos grandes aerossóis que têm um papel na formação das nuvens? De acordo com “Atmospheric particles and nuclei” de Götz
et al. (1991), Junge (1963) propôs, baseado em medidas de aerossóis, que partículas ‘grandes’ e ‘gigantes’ (raio maior que 0.1 micrômetro) constituem a maioria dos CCN, independentemente de sua composição química. Ao lado disso, a curva
de Köhler (veja também aqui) baseada no trabalho teórico de 1926 e adiante indica que as gotas somente começam a crescer espontaneamente a partir de um certo tamanho crítico (elas são todas ‘supercríticas’). O número de aerossóis sulfúricos é também influenciado pela disponibilidade de enxofre em geral. A quantidade de enxofre pode variar, por exemplo, com a queima de combustíveis fósseis, erupções vulcânicas, bem como devido à atividade biológica (i.e. através da emissão de dimetil sulfito ou ‘DMS’; Götz et al. ,1991, p. 108), e presumivelmente o número de grupos de ácido sulfúrico formado nos últimos bilhões de anos pode ter sido afetado por diversos fatores geológicos. Aliado a isso, a pressão de vapor (ou ‘supersaturação’) deve realmente controlar se uma nuvem forma gotas ou não, visto que os aerossóis tendem estar casualmente ao redor. Tenho também algumas questões gerais sobre as evidências isotópicas de tempos pré-históricos. Seriam os isótopos de tempos passados criados somente por GCR bombardeando a atmosfera terrestre ou poderiam haver outras fontes? Algumas poderiam ser introduzidas por impactos de meteoritos/asteróides, atividades vulcânicas ou emissão distinta de gás radônio originado no interior da Terra?
Eu esperaria um fraco efeito do albedo das nuvens sobre as regiões cobertas de neve/gelo da Antarctica, mas Svensmark argumenta que a temperatura das nuvens aumentaria (esquentaria) ao invés de diminuir (resfriar). Esta declaração não é quantificada. Estará ele sugerindo algum efeito de gas de efeito estufa atuando durante os invernos Antárticos? Estaria o senso/cronologia de causa realmente determinado? O que dizer da temperatura afetando a cobertura de nuvens (por exemplo por advecção de ar suave e úmido) e o papel dos padrões de circulação? Certamente não há uma simples relação unidirecional. Acho que o artigo da A&G seja um pouco displicente sobre a complexidade envolvida nos processos atmosféricos. Essa atitude displicente parece ser uma marca registrada da cosmoclimatologia.
Presumo que muitos corpos celestes e cálculos complicados de gravitação tornam a modelagem da dinâmica de galáxias muito difícil, e os processos de formação de estrelas devem ter alterado a distribuição de massa e, assim, do campo gravitacional. Então, a dinâmica de estrelas durante bilhões de anos poderia ser certamente caracterizada como sendo caótica? Será mesmo possível reconstruir as constelações e a trajetória de nosso sistema solar ao redor da galáxia há mais de 2 bilhões de anos atrás com uma precisão que precede aquela
de calcular o efeito do aumento da concentração de gases de efeito estufa nos dias atuais? Será a estória tão simples quanto narrada por Svensmark? Ele mesmo sugere que suas idéias são uma mudança de paradigma, o que ‘cientificamente falando’ seja tão seguro quanto a prevalência do paradigma do
aquecimento global antropogênico (sigla em inglês, AGW). Eu vejo essa extensa declaração um pouco nebulosa dado que nenhuma qualificação seja feita sobre a questão AGW. Quais seriam exatamente os pontos fracos do paradigma AGW? Me pergunto se Svensmark sabe do que está falando.
É possível que os GCR de fato apresentem um efeito sobre o clima através da modulação das nuvens, mas eu não creio que seja muito forte. Também penso que as declarações de Svensmark são muito exageradas, mas em geral minhas objeções situam-se na forma como os argumentos são apresentados no artigo da A&G. Tenho a impressão que o trabalho da A&G vem da mesma escola do “O Ambientalista Cético “, que também tem sido criticado por referências pontualmente escolhidas para tornar mera especulação como solidamente fundamentada. Ignorar aspectos que não se adequam a hipótese não
é ciência definitivamente. Do mesmo modo não é ajustar os dados de modo a dar um bom resultado sem uma sólida e convincente justificativa. A Ciência, todavia, significa objetividade, transparência, repitabilidade, e em princípio a possibilidade de falsificação. Além disso, seria somente uma falta de respeito com os leitores publicar um artigo que não contemple todos os lados relevantes da estória. Espero que Svensmark leia meus cometários e os responda aqui no RealClimate. Também espero que isso tudo seja lido por alunos e jornalistas que iniciam perguntas das questões críticas. Não sei a resposta para essas questões que postei aqui, assim gostaria de saber suas visões.
Agradecimentos
Agradeço Jørn Kristiansen pelos comentários e contribuições para essa minha postagem e Kristian Gislefoss por uma figura global da cobertura de baixas nuvens.
traduzido por Ivan B. T. Lima e Fernando M. Ramos
[[Boy you guys are so right on . These are such tired arguments. Why can’t we all just agree global warming is man made and ignore the mountain of data that might question that assumption??? ]]
How about because the data does not, in fact, question that assumption? Or that it’s not an assumption, but a conclusion from the data?
50 Yes. If for no other reason that we already know that cosmic rays caus ions, and molecules cluster about them. The key issue is what happens in the natural atmosphere that controls the number of water drops that form from the nanosized cluster, and how they grow and evaporate.
[[Concerning all the arguments above on the theme “you need first to have a clear signal of GCR effect on past 20, 50, 100, etc. yrs”, I think it’s not really conclusive. Fourier or Arrhenius were OK and true scientific pioneers about CO2 greenhouse effect without any model for detecting and attributing a CO2 signal in 18th or 19th century temperature. ]]
You may be confusing the greenhouse effect here with global warming. Fourier spoke of the former, Arrhenius of the latter. Arrhenius’s inspiration was the discussion then current of the cause of the ice ages.
I am reminded of the school science fair project which expounded upon the dangers of “di-hydrogen monoxide”. A high percentage of the viewers of the exhibit actually wrote to congress asking that the dangerous chemical di-hydrogen monoxide be banned.
I tried to tell somebody about the space elevator the other day. He asked if it would reach all the way to Mars.
The point is that the average person is far too stupid to understand any of this and half the population is even stupider. How do we solve THAT problem?
RE: 54
…”The point is that the average person is far too stupid to understand any of this and half the population is even stupider. How do we solve THAT problem?”
Good luck there.
Consider that a huge number of people are actually illiterate, lucky to read at a vague 8th grade level, or functionally illiterate in the compounded step by step functions required in directions, along with a direct lack of reading comprehension cognitive processes and one just sighs.
Illiteracy In America
By Timothy N. Stelly, Sr.
(Aug. 22, 2005)
http://www.useless-knowledge.com/1234/aug/article321.html
Incidentally, I listened to a TV program the other night that featured Brian Ross investigating the African email money swindling scams. Lo and behold there were plenty
of physicians and attorneys being snared by it.
Which did not surprise me, to be truthful, as I have worked with both, but its still a poor reflection of our so called higher learners and another sad example of the state of nation.
The one thing that does seem to have become in favor of observationally acknowledging climate changes outside of the expected norm, without being scientifically titled or of greater intellectual capacity, would be that some of the manifestations or effects, regardless of attributional cause, are becoming more day to day tangible and visible in comparison to the expected past climates that the public has enjoyed.
You know, sometimes, at the end of day when it comes to relating to the average person it goes back to their embrace of such folksy things as:
when there are going to be heavy rains or floods, the ants will build their hills higher.
Such is life that one works with what one is given and we need to be even MORE understanding of others in relation to talking over their heads or with enclycopedia mouths.
Guilty here myself of using an encyclopedia mouth to the extent people don’t understand me. So, one goes with the flow and adapts at their level, rather than expecting them to have to adapt to our levels. It’s easier anyhow than explaining every darn thing you equated in a conversation.
And I would imagine many people who lack the understanding of the climate sciences are grateful for this site and the patience of the scientists who spend their time trying to elaborate on the science of the topics, or their efforts to clarify and make simple many hard to fathom nuances; not to mention their analysis and discussions of the recent papers released in the field.
[edit]
I think GCR should not be considered a “dead horse” but a hypothesis that deserves consideration. The IPCC says man-made forcings are very likely 90% of total forcings, with ‘very likely’ being 90 to 95% probable. If I do the math right, there’s between a 1 to 10% chance then that nature is responsible after all. Before the world “acts now” to stop GW, which will cost lots of money (e.g. sequestering carbon costs up to 30% of the input energy to perform, says an IPCC report), we should study the problem more, don’t you think? While carbon in the atmosphere may indeed stay there for 100s of years, I don’t think even another 100 years of unmitigated anthropogenic CO2 pollution will be fatal to the planet. In short, look before you leap, and let’s keep politics out of this.
Ray Lopez
*****
It is possible that GCRs do have an effect on climate through the modulation of clouds, but I don’t think it is very strong. I also think that Svensmark’s claims are wildly exaggerated, but most of my objection lies in the way the arguments have been presented in this A&G articl
If rasmus really thinks that Svensmark rides a dead horse, is the ongoing CLOUD experiment at CERN (which probably will be ready in 2010) a superfluous spending of fundings?. See here for the link to the CLOUD documents. [http://cloud.web.cern.ch/cloud/] Comment by Francis Massen � 10 Mar 2007 @ 7:55 am
This issue reveals once again the primary importance of understanding how clouds behave, and how aerosols behave, and how the two interact with one another. Lindzen’s IRIS hypothesis was another example of relying on a theoretical picture of how clouds behave, but the actual data from CERES showed that those assumptions were unjustified: http://science.nasa.gov/headlines/y2002/22apr_ceres.htm
“For example, a group of scientists recently proposed an idea called the “iris hypothesis.” They suggested that the canopy of clouds over the tropical Pacific Ocean recedes when the water’s surface temperature increases. Fewer clouds would open a window through which heat could escape to space and thus cool the planet. Earth, they argued, has a natural response that counteracts rising temperatures — a bit like an iris in a human eye dilating to adapt to low light.
But does Earth really respond that way?
Wielicki and other NASA scientists used CERES to test the idea. It turned out that such clouds did trap infrared heat. But even more so they reflected visible sunlight back into space. Fewer of the clouds would mean more global warming, not less.”
Similarly, aerosols don’t automatically become cloud-condensation nuclei, as http://www.terradaily.com/reports/Pollution_Shown_Cutting_Rainfall_In_Hilly_Areas_999.html demonstrates.
However, when we look at the overall claim made by the global warming denialists, it really is ridiculous – they claim that galactic cosmic rays influence the climate through some very hypothetical and convoluted process involving the solar and earth magnetic fields, formation of aerosols, and formation of clouds (the right sort of clouds, that is…), and then they also claim that CO2, CH4 and N2O do not influence the surface temperature despite all the theoretical and experimental evidence that they do.
This demonstrates how the scientific discourse about all the different factors involved in climate has been misused and abused by a handful of scientists and political advocacy groups when it comes to discussing these issues with the general public. The fact is that infrared-absorbing gases act like an atmospheric blanket that slowly raises the surface temperature; this leads to more water evaporation, and water vapor is also an infrared-absorbing gas, which also acts as a blanket, so the surface warms more; as the poles begin to melt there is less snow, so the ground absorbs more radiation; over the past few million years the orbital solar forcing has caused the system to osciallate back and forth; there are many factors that are poorly understood (for example, if biosphere respiration > photosynthesis, atmospheric CO2 levels rise; if photosynthesis>respiration, CO2 levels fall; is this involved in glacial cycles?) – but the fact is that we’ve altered the system by injecting gigatons of ancient fossil fuel carbon into the atmosphere, in the form of carbon dioxide and methane – and to get back to cosmic rays, we know this is so because cosmic rays produce radioactive carbon-14 in the upper atmosphere, which has a halflife of around 6000 years, meaning that ancient fossil fuels have no C14 in them, meaning that we can determine the sources of atmospheric CO2 by measuring its C14 content.
Re #56: [The IPCC says man-made forcings are very likely 90% of total forcings, with ‘very likely’ being 90 to 95% probable. If I do the math right, there’s between a 1 to 10% chance then that nature is responsible after all.]
I think what you have there is in fact the chance that changes observed up to now are the result of natural changes, and not past human activity. It’s not saying anything about what future changes may accumulate.
[Before the world “acts now” to stop GW, which will cost lots of money (e.g. sequestering carbon costs up to 30% of the input energy to perform, says an IPCC report)…]
If carbon sequestration was the only option, you might have an argument. As it it, it’s only an argument against using fossil fuels for power generation. There are other options, ranging from conservation (does the world really, really need to illuminate thousands of square miles of empty parking lots, for instance?) to increasing efficiency to using other energy sources. Many of them actually save money in the long run.
Just some comments re. the Ch4 programme and its aftermath, and then a technical question/suggestion.
Although not a climate scientist myself, I was appalled by the Ch4 programme. I forced myself to watch it, however, as I think that all scientists have to be aware of how (essentially) the big scientific stories are being presented, so that we can deal with the questions we get from our students/friends/family/thewider public etc. Indeed, only yesterday, my brother gave me quite a grilling about the programme and why we should be concerned about climate warming at all, although he did admit afterwards that he was very much playing “devil’s advocate”. It’s good practice to be able to respond to this sort of direct and assertive questioning, but probably only if the interlocutor is genuinely interested in the answer. However, I am not sure how interested in alternative opinions were some/all of the contrarians who were interviewed on the programme! What’s even worse, though, is the effect the programme has had on the wider public. I listened to the phone-in on BBC Radio 5 live the following morning, and I would judge that 70-80% of the respondents thought Ch4 had done a really good job, debunking myths put about by a lot of biased, grant-chasing scientists. Hardly anyone spoke clearly or resolutely in favour of the attempts by the climate science community to come to an informed and well presented view. The general skepticism I heard from the public, and their support for the Ch4 programme, left me even more depressed than the programme itself! However, we just have to persevere. Perhaps, via Realclimate, we could demand a right of reply?
On a technical note, in my own research (I am an geomorphologist, main interests in modelling landscape evolution over the Quaternary, and also in clarifying equifinality and equifinal behaviour of spatially/temporally discretised models, which are all semi-empirical to some extent), I have been developing and using ‘metamodels’ to explore high dimensional factor spaces of large inherent uncertainty. The outputs from such metamodels can be used to forecast, with error (via a bootstrap or similar technique), a wide range of scenarios, which would be completely infeasible if using full simulations. Are these techniques being used in the climate sciences to any extent? I am aware of only one recent report in this respect, by Peter Challenor (Technical report for the Tyndall Centre, no. 45 or after, I think – it’s on the web) but no others. It’s a very powerful technique, which I am happy to discuss with people, and which I would strongly recommend as a model exploratory tool.
Cheers,
Nick Odoni
School of Geography, Southampton
A Pragmatic Theory to Explore:
I find the comments and explanations in this site interesting and compelling, and at times very difficult to understand. I must also admit that the level of complexity for which your examinations attain are a true signal of the quality to found with, and as I have come to agree with, the theory that climate change is linked to human creation of greenhouse gases, or more broadly termed pollution. It is with the word ‘pollution’ that I find the second most compelling case for reducing Co2 and other chemical or greenhouse elements. Even if we are wrong about the causes of climate change, surely severely reducing the pollutants we pump into the localised and global atmosphere (I will go at this stage go into the importance of stopping deforestation) is an incredibly positive achievement for which our children would be incredibly proud. The technology and intelligence to maintain a high level of life style is at hand but we seem unable to invest the required intellectual and economical capital. While huge amounts of the afore mentioned capital finds its way into other less productive human endeavours such as the war in Iraq (est at $1.8 billion a week, figures found at – http://www.msnbc.msn.com/id/15377059/).
So while some may still favour the 10% probability (IPCC recent data) that humans and Co2/greenhouse emissions are not causing climate change, surely to err on the side of caution and at the same time create an enhanced living environment, and then start to think about the truly important battle of sustainability and conservation, would be the most intelligent and responsible strategic plan.
I look forward to any comments regarding this theory…
William Laitinen
re. No trend in solar proxies since the fifties
I don’t think there needs to be a trend in a forcing parameter of a system over a given period in order for that parameter to be driving a noticable change in that system during that period.
An example would be to take sunspot number as a proxy of solar activity – no trend since the 1950s – and assume that the global mean annual temperature anomaly is driven by the sunspot number according to:
This year’s anomaly = last year’s anomaly + (sunspot number – 40)*0.0003
Under this relationship the global mean temperature would have carried on increasing strongly since the fifties even though there is no real trend in sunspot number over that period. Note – I’m not saying I think this formula is correct, even if it does do a pretty good job of following the measured temperature anomaly! Just wanted to point out that ‘no trend’ does not equal ‘no change.’ Just for fun you can see the graph of the above formula for sunspot based temperature anomaly prediction at http://www.lovemans.co.uk/snspot.html
I have followed the GCR-climate debate over the past year or so, via scientific journals as well as via several internet platforms including realclimate. I have a few questions that I could not find the answer to.
The CLIMAX Neutron monitor does not show any trend in GCR since the 50s. However, cosmic ray proponent Shaviv claims that the ion chamber data are more relevant for potential aerosol (and the “hopefully” cloud) formation, because of the energies measured. And he claims that they do show a decreasing trend.
I have read here on RC that the two (or multiple) types of particles should agree with each other, and that neither side of the argument has an explanation for the fact that they do not. Now it’s easy to say that each side just picks the data that suits their hypothesis, so my question is: Why would the CLIMAX neutron monitor be the better data series to look at? Do they cover a longer time period? Are they regarded as the “reference” measurement? But would such reasons deem the trend in the ion chamber data statisticlly insignificant? Or are the ionchamber data Shaviv refers to rubbish to begin with?
My second question is more general: Climate sensitivity is bounded by how well we can model the 20 century temperature increase with the known forcings, and by the last ice age, right? So if (and I know that it’s a very big if) there is another forcing that up till now was not included in the 20th century modeling excercises, the climate sensitivity according to the first line of thinking would be lower (as per the Nature paper of Andreae et al (2006)). How strong is the constraint on climate sensitivity by inspecting the last ice age versus the constraints that stem from modeling the 20th century temperature increase? I.e. would such an unaccounted forcing (or alternatively, a much larger aerosol forcing than currently thought) indeed force the climate sensitivity to be revisited or not, and if so, to what extent? If they don’t agree, would we take the average of the two as the most likely number? It’s nice that currently the climate sensitivity you get from both lines of evidence more or less agree, and it indeed strengthens the claim that it’s probably not far from the truth, but I think the “what if” question is important in countering common sceptics talk.
Thanks for the great site!
Why would the GCR count have been lower for the early Earth? If Svensmark is dependent on Solar activity to mediate GCR flux, wasn’t the Sun 25% dimmer than now at 4.5 GYA? Which would mean less modulation, which presumably would result in a GCR flux with less Solar interference. Am I missing something?
…”Its not like solar flux is being ignored; far from it, as many of the realclimate authors have written about the effects of solar radiative changes on the earth’s climate in the peer reviewed literature.”…
Very true, and yet there are methodology conflicts and uncertainties still to be clarified and determined. However, it has been proposed
that regardless of solar changes, the current greenhouse gases
influence (forcing) is higher than the contribution of any solar forcing or factor.
Reconstruction of solar irradiance using the
Group sunspot number (2007)
L. Balmaceda, N. A. Krivova and S. K. Solanki
http://arxiv.org/PS_cache/astro-ph/pdf/0703/0703147.pdf
…”The model predicts an increase in the total solar irradiance since the Maunder Minimum of about 1.3 m{Wm$^{-2}$}. “…
…”Conclusion
We have reconstructed total solar irradiance back to 1610. The cyclic variation
of ER was assumed to be related to the properties of the corresponding
AR cycle, whose variation can be estimated from the Group sunspot number
(Solanki et al., 2002). The secular change in the total magnetic flux of the Sun
and, therefore, in the irradiance is caused by the overlap of the consecutive
ER cycles. The predicted secular change since 1700 is about 1.3 Wmâ??2. This
value lies within the range suggested by other recent reconstructions of solar
irradiance (Foster, 2004; Wang et al., 2005), but is significantly lower than
the ones obtained in earlier investigations based on stellar data ranging from
2 to 16 Wmâ??2 (e.g., Mendoza, 1997; Lean, 2000). However, the stellar evidence
for such a change has been recently critized (Hall and Lockwood, 2004;
Wright et al., 2004; Giampapa, 2005) and the magnitude of the increase in
TSI obtained using these results might have been overestimated.”
Solar variability and global warming: a statistical comparison since 1850
Advances in Space Research
Volume 34, Issue 2 , 2004, Pages 361-364
N. A. Krivova, and S. K. Solanki
http://dx.doi.org/10.1016/j.asr.2003.02.051
…”We show that at least in the most recent past (since about 1970) the solar influence on climate cannot have been significant. “
Solar radiative output and its variability: evidence and mechanisms
The Astronomy and Astrophysics Review 12 (4), 273 (2004)
http://dx.doi.org/10.1007/s00159-004-0024-1
…”Empirical associations with solar activity proxies suggest reduced total solar irradiance during the anomalously low activity in the seventeenth century Maunder Minimum relative to the present. Uncertainties in understanding the physical relationships between direct magnetic modulation of solar radiative output and heliospheric modulation of cosmogenic proxies preclude definitive historical irradiance estimates, as yet.”
And YET another proposed idea on the matter……
Stardust component in tree rings
Dendrochronologia 24 (2-3), 131 (2007)
http://dx.doi.org/10.1016/j.dendro.2006.10.005
…”With respect to 11-year periodicity, which is the most prominent one in sunspot number spectrum (Schwabe cycle) it may be said that it hardly appeared in Arctic tree-ring series. Although the 22-year cycles in climatic records are perceivable (it is also evident from our and other results), any physical mechanisms by which a reversal in the solar magnetic field could influence climate are still missing. To our mind, a potential cause of this phenomenon seems to be a variation of stardust flux inside the solar system. The most recent observations in frame of the DUST experiment on board the Ulysses spacecraft have shown that stardust level inside of the solar system was trebled during the recent solar maximum (Landgraf et al., 2003. “…”It is possible that the periodic increase of stardust in the solar system will influence the amount of extraterrestrial material that rains down to the Earth and consequently down to the Earth’s atmosphere and may affect climate through alteration of atmospheric transparency and albedo. “
Quick comments: the dynamics of stars in the galaxy are formally chaotic, but the galactic potential is actually quite smooth on these scales and the Sun’s orbit about the galaxy is quite regular – and 2 billon years is only 8-10 orbits, so backtracking is not hard. Basically the Sun has just been going around in a slightly eccentric orbit about the galaxy.
Inferring galactic cosmic ray history is much more hazardous, since it depends on local conditions, including crossing of star forming regions, transient hot shocks in the interstellar medium, and large scale events which we do not observe and have no record of in the astronomical data. You can make guesses, based for example of crossing of the galactic plane and the spiral arms, but the timing and amplitude of variations would be highly uncertain for any individual event and not very robust as periodic signals, although it has been tried.
Are any of the commenters at Chicago who could ask the astronomy people there about this one?
NOTE: I don’t know what the software will make of this — see the original if you want to rely on things like the tilde and Angstrom symbols to be correct.
http://www.journals.uchicago.edu/cgi-bin/resolve?id=doi:10.1086/511127&erFrom=-7221149384855447239Guest
It’s the only article I’ve seen that has both direct observations of our sun over a long time period, and a particular observed variable that might correlate with the Maunder Minimum:
Sun-as-a-Star Spectrum Variations 1974-2006
Author(s) W. Livingston, L. Wallace, O. R. White, and M. S. Giampapa
Identifiers The Astrophysical Journal, volume 657, part 1 (2007), pages 1137�1149
DOI: 10.1086/511127
Bibcode: 2007ApJ…657.1137L
Availability This site: PS | HTML (1.1k) | PDF (1.1M)
Copyright © 2007, The American Astronomical Society.
Abstract We have observed selected Fraunhofer lines, both integrated over the full disk and for a small circular region near the center of the solar disk, on 1215 days over the past 30 years. Our full disk results for the chromosphere show that Ca ii K 3933 � nicely tracks the 11 yr magnetic cycle based on sunspot number, with a peak amplitude in central intensity of [tilde]37%. The wavelength of the midline core absorption feature, called K3, referenced to nearby photospheric Fe, displays an activity cycle variation with an amplitude of 3 m� (6 m� center disk). Other chromospheric lines, such as He i 10830 �, Ca ii 8542 �, Halpha, and the CN 3883 � bandhead, track Ca ii K intensity with lower relative amplitudes. In the low photosphere, temperature-sensitive C i 5380 � appears constant in intensity to 0.2%. In the high photosphere, the cores of strong Fe i lines, Na D1 and D2, and the Mg i b lines, present a puzzling signal, perhaps indicating a role for the 22 yr Hale cycle. Solar minimum around 1985 was clearly seen, but the following minimum in 1996 was missing. Our center disk results show that both Ca ii K and C i 5380 � intensities are constant, indicating that the basal quiet atmosphere is unaffected by cycle magnetism within our observational error. A lower limit to the Ca ii K central intensity atmosphere is 0.040. This possibly represents conditions as they were during the Maunder minimum. Converted to the Mount Wilson S-index (H+K index), the Sun center disk is at the lower activity limit for solar-type stars. An appendix provides instructions for URL access to both the raw and reduced data.
Any comment concerning the recent Solar Changes?
http://science.nasa.gov/headlines/y2…_longrange.htm
The following is an excerpt from the above link:
The sun’s “Great Conveyor Belt”
“Normally, the conveyor belt moves about 1 meter per secondâ��walking pace,” says Hathaway. “That’s how it has been since the late 19th century.” In recent years, however, the belt has decelerated to 0.75 m/s in the north and 0.35 m/s (has recently slowed down to 0.25 m/s â�� my comment) in the south. “We’ve never seen speeds so low.”
And from the next link, it appears there was a failed solar magnetic field reversal.
http://science.nasa.gov/headlines/y2…_backwards.htm
I thought Solar Activity in the 20th century was the highest in 8,000 years and the solar large scale magnetic field doubled has doubled. Is that correct?
Evolution of the Sun’s large-scale magnetic field since the Maunder minimum
http://www.nature.com/nature/journal/v408/n6811/abs/408445a0.html
A part of the Sun’s magnetic field reaches out from the surface into interplanetary space, and it was recently discovered3 that the average strength of this interplanetary field has doubled in the past 100 years. There has hitherto been no clear explanation for this doubling. Here we present a model describing the long-term evolution of the Sun’s large-scale magnetic field, which reproduces the doubling of the interplanetary field. The model indicates that there is a direct connection between the length of the sunspot cycle and the secular variations.
[Response:Paleo-records exhibit variations in the isotope compositions dating back several thousands years. One plausible explanation may be a strengthening in the solar magnetism, but I think these hypothese must involve a high degree of uncertainty. As far as I know, there are not many independent evidence which can pin point the exct cause. The idea of a strengthenig solar magnetic field over the past 100 years is based on the so-called aa-index: the difference between the magnetic field measured at near-opposite sides of the pole. I think one should be careful to use the difference of two large and noisy numbers as an indicator, and in this case, the difference must surely be affected by changes in the geo-magnetic field as well. At least over the long run (100 past years). In the last 50 years, even the aa-index doesn’t exhibit much of a trend. -rasmus]
Has any one in this forum reviewed the Wilson H-K study? The Wilson H-K study was a long term study that was started in the 1970s where 70 sun-like stars were studied to learn more about solar variability?
The following is from a solar review article write by a solar research team. The article summarizes at a high level current solar research findings and understanding. It includes a list of basic questions that this solar research project hopes to answer.
http://sdo.gsfc.nasa.gov/sdo_sdt_report.doc
From page 21
�The solar cycle has proven to be notoriously difficult to predict. Once a cycle is well under way its smoothed behaviour can be predicted with some reliability using statistical models for the shape of the curve. Predictions prior to the start of cycle are, however, much less reliable and longer range predictions are virtually useless. Currently all methods of cycle prediction are empirical in nature. While we understand many of the processes involved in producing the solar cycle we do not have a physical model that will take initial conditions and predict future behaviour.�
From page 4-5
�Solar magnetic fields with their associated forces and electric currents are recognized as being responsible for the Sun�s activity, but the underlying process which create �are poorly understood. Although helioseismology has revealed flows and thermal structures related to magnetic variability, present theoretical models based on these observations can only broadly reproduce the observed magnetic evolution and are far from having predictive capability.�
�Historical records suggest that the strength of the cyclic magnetic variations may have been different than today and that there may have been associated terrestrial climate changes. Furthermore, sun-like stars are observed to have a wider range of activity than is seen in the Sun, suggesting that current solar behaviour could be misleadingly steady.�
In reply to comment 63 “Why would the GCR count have been lower for the early Earth? If Svensmark is dependent on Solar activity to mediate GCR flux, wasn’t the Sun 25% dimmer than now at 4.5 GYA? Which would mean less modulation, which presumably would result in a GCR flux with less Solar interference. Am I missing something?”
The solar magnetic field was much stronger in the past due to faster rotation of the sun. Attached is a paper that discusses the hypothesis.
http://www.citebase.org/fulltext?format=application%2Fpdf&identifier=oai%3AarXiv.org%3Aastro-ph%2F0306477
>67, William Astley wrote:
http://science.nasa.gov/headlines/y2…_backwards.htm
That isn’t a link. I searched the NASA pages, and don’t find anything matching your description.
(2001) http://science.nasa.gov/headlines/y2001/ast15feb_1.htm
“…The Sun’s magnetic poles will remain as they are now, with the north magnetic pole pointing through the Sun’s southern hemisphere, until the year 2012 when they will reverse again. This transition happens, as far as we know, at the peak of every 11-year sunspot cycle — like clockwork.”
And this, from: http://science.nasa.gov/headlines/y2006/15aug_backwards.htm
2006: On July 31st, …. this sunspot was special: It was backward…. “We’ve been waiting for this,” ….”A backward sunspot is a sign that the next solar cycle is beginning.” ….The first spot of a new solar cycle is always backwards. Solar physicists have long known that sunspot magnetic fields reverse polarity from cycle to cycle. N-S becomes S-N and vice versa. “The backward sunspot may be the first sunspot of Cycle 24.” … … For a while, perhaps one or two years, Cycle 23 and Cycle 24 will actually share the sun, making it a hodgepodge of backward and forward spots.
Possibly you missed that last sentence? We’re in between right now, as expected.
Perhaps you misread that latter link?
Hi Hank,
Attached is the correct link to the May, 2006 NASA Solar news release, which notes the solar conveyor has slowed by roughly 65% in the southern hemisphere and 25% in the Northern Hemisphere. Also attached is a paper that describes unusual solar activity, that is concurrent with the changes in the solar conveyor.
http://science.nasa.gov/headlines/y2006/10may_longrange.htm
The NASA news link states:
“Normally, the conveyor belt moves about 1 meter per secondâ��walking pace, says Hathaway. “That’s how it has been since the late 19th century.” In recent years, however, the belt has decelerated to 0.75 m/s in the north and 0.35 m/s in the south. “We’ve never seen speeds so low.”
Attached is a paper that notes solar observers have found that there are significant asymmetries that are appearing concurrent with the asymmetrical slowing of the solar conveyor.
http://www.dxlc.com/solar/cyclcomp.html
From the above paper:
“The statistical results in sunspot and plage distribution in 1996-2004 â�¦Sunspot and plage area distribution reveal a strong North-South asymmetry of about 0.4 and the period of 7 years for sunspots and of 0.6 and period of about 8 years for plagesâ�¦ The resulting or excess fluxes in 1997-2003 covered by sunspots reveal mostly a positive magnetic flux â�¦ These asymmetries reflect some essential properties of the global solar activity to be accounted for in solar dynamo modelling.”
Also solar cycle 23 appears to be phased shifted as compared to cycle 21 and 22. See the attached link to a daily solar observation site that also provides a daily and long record of solar activity.
http://www.dxlc.com/solar/cyclcomp.html
Re: Correct to comment 71:
Attached is the correct link to the paper “North-South Asymmetry in Solar Cycle 23…”
http://sait.oat.ts.astro.it/MSAIt760405/PDF/2005MmSAI..76.1072Z.pdf
Don’t miss this one:
One pole of the sun is cooler than the other. That’s the surprising conclusion announced today by scientists who have been analyzing data from the ESA-NASA Ulysses spacecraft.
…. The “cool spot” follows the north magnetic pole when the sun’s poles flip. …
science.nasa.gov/headlines/y2007/20feb_coolmystery.htm
Ulysses’ first polar flybys in 1994 and 1995 revealed the asymmetryâ��”a 7 to 8 percent difference in temperature,” … researchers know the effect is real. Ulysses has returned to the sun’s South Pole in 2007 and “recent observations show that the average temperature … is virtually identical to what we saw 12 years ago,” says Gloeckler.
Taking the sun’s temperature is tricky business. The spacecraft can’t descend to the surface and insert a thermometer. Instead, Ulysses samples the solar wind at a safe remove of 300 million km. “We measure the abundance of two oxygen ions found in the solar wind. The ratio O6+/O7+ tells us the temperature of the gas,” explains Gloeckler. He is the principal investigator of the instrument onboard Ulysses that does this, the Solar Wind Ion Composition Spectrometer or “SWICS.”
According to SWICS, the average temperature of the sun’s polar wind is about one million degrees C. But over one pole the wind is about 80,000 degrees cooler than over the other pole.