You read it here first!
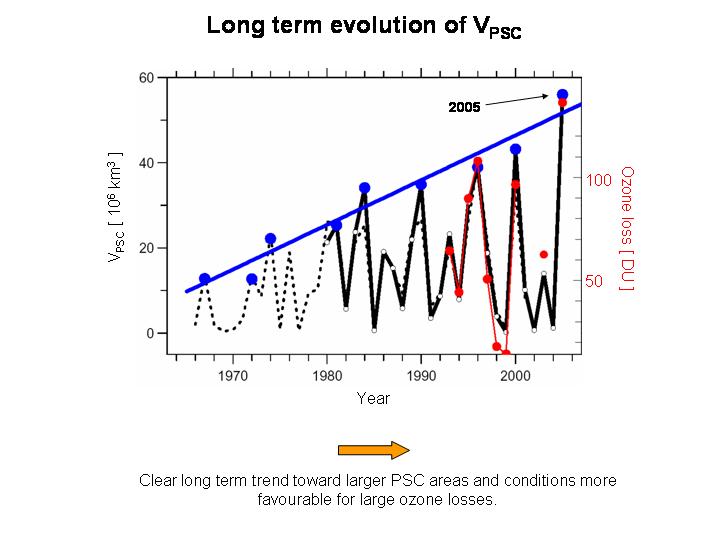
Update (09/05/05): Markus Rex was kind enough to send us the full figure from which Nature made their thumbnail, and which is a little clearer. He also cautions that the 2005 numbers are still preliminary, however there is a clear trend towards increasing potential for Arctic ozone loss, which is realised or not depending on the vagaries of each individual winter.


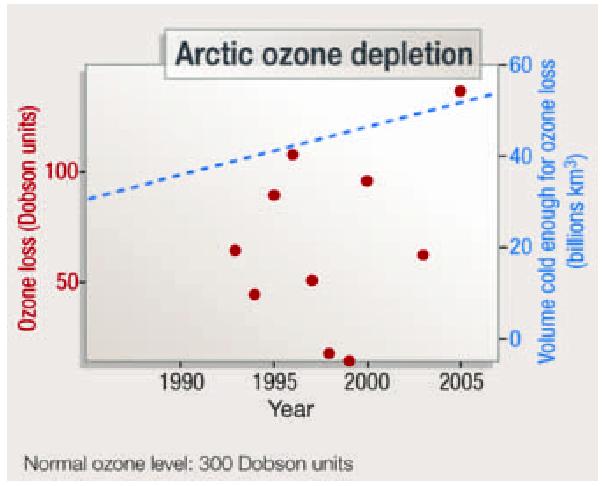
That dotted line is high on the Y axis if it is supposed to be showing the average loss. However, the data points do point to progressive, but not straight line loss.
Or maybe there is just poor record keeping? OR a LOT of variance over the years. Could holes be shifting around the data collection points? Who knows? Graph looks inconclusive by itself.
[Response: The scatter of the dots is due to various dynamic effects (how much wave energy there is that year etc.) and is very noisy year-to-year. However, that dynamic variability is part of what makes one year so much colder than another, and the temperatures we were seeing over February and March suggested that this would be a bad year for ozone – despite the fact there was a rapid warming towards the end. I have to admit that I am also a little stumped as to why the ‘cold volume’ line appears so linear, unless of course it is a model predicition of the background conditions – which are changing due to increasing CO2 levels. I will investigate and report back…. – gavin]
I don’t get it. Why is the “volume cold enough for ozone loss” line so perfectly linear, and what sort of trend do the “ozone loss” dots show? I’m sure the Nature article would tell me, but I can’t read it. :( Could you summarize the article for those of us without subscriptions?
This might help — I’d just put this together a few days ago to post on a message board for home mechanics in response to a very young man’s faarch commend that he was ‘supposed to’ vacuum out his old CFC R-12 air conditioner system but had just opened the valve and vented it instead (sigh).
http://www.cambridgenetwork.co.uk/pooled/articles/BF_NEWSART/view.asp?Q=BF_NEWSART_157792
QUOTE (excerpts; ellipse and any errors introduced by my editing ar e mine, see the original for the original text)
29 Apr 2005
Large scale ozone losses have occurred above the Arctic this past winter with over 50% of the ozone destroyed at altitudes around 18 km. …
Overall temperatures in the ozone layer were the lowest for 50 years …. large areas of polar stratospheric clouds (PSCs) – clouds in the ozone layer- were present over the Arctic region at altitudes between 14 and 26 km. This [area] is the largest in the 50 year record, and especially in the last 20 years, the period when the ozone-depleting compounds have been high.
The chemical balance in the stratosphere is changed significantly by the presence of these clouds, altering the breakdown products from manmade CFCs (chlorofluorocarbons) so that rapid chemical ozone destruction can occur in the presence of sunlight. The cold conditions affected the distribution of nitrogen oxides, allowing ozone loss to continue longer than usual.
….. the atmospheric concentrations of CFCs [has] started to decrease. But the atmospheric lifetime of these compounds is extremely long and the concentrations will remain at dangerously high levels for another half century.
… the Arctic ozone layer will mainly depend on … temperatures at the altitude of the ozone layer. Over the past forty years the conditions there have become significantly colder…. the cold Arctic winters…. result in large ozone losses. In 2005 the average extent of conditions cold enough… was four times larger than it has ever been ….
This continuous cooling trend is … a result of increasing concentrations of greenhouse gases in the atmosphere [and so will continue].
END QUOTE
Background:
http://jwocky.gsfc.nasa.gov/eptoms/dataqual/ozone_v8.html
http://www.elmhurst.edu/~chm/vchembook/ozone.html
http://www.atm.ch.cam.ac.uk/tour/tour_images/total_ozone.s.gif
Despite the fact that I do have access to the Nature article in question (“Arctic trends scrutinized as chilly winter destroys ozone” by Quirin Schiermeier, published in Nature 435, 6 (5 May 2005), doi: 10.1038/435006b), I am also confused by the figure.
In fact, the article itself doesn’t give a whole lot of information. It appears to be a short report from the recent European Geosciences Union meeting in Vienna, focussing on a contribution to that conference by Markus Rex, an atmospheric scientist of the Alfred Wegener Institute of Polar and Marine Research in Potsdam, Germany, and his colleagues.
The figure featured in this RealClimate post does appear in he Nature article, but without any clear explanation (in fact, I couldn’t find any caption at all in the on-line version). All that is said referring to the figure is “[Rex and his colleagues report that] after this winter’s unusually low Arctic temperatures, ozone losses are greater than any seen before (see graph).” The source of the figure is given as “M. Rex, Eur. Geosci. Un. Meeting 2005”.
No specific mention of the “volume cold enough for ozone loss” trend line is made in the Nature text, although it is stated that “Certain clouds in the stratosphere provide surfaces on which CFC decay products are converted into forms that destroy ozone â?? but the clouds only form at temperatures below -80°C.” (There’s a pretty picture of polar clouds accompanying the article.)
I suspect that those of us that were not there in Vienna will have to wait for future publications from the group at the Alfred Wegener Institute in order to hear the full story about this particular ozone study in all its glorious detail. (Unless someone posts a link to the conference proceedings manuscript I suspect was or is being written for the EGU meeting ?!) In the meantime, I guess we have to resort to the earlier RealClimate posting and its comments for information.
[Response: The previous post gives the background for why any particular year has different amounts of ozone loss, and why we anticipated that this year had the potential to be a bad one. The relevant abstract from EGU can be found here but since abstracts have to be submitted in January, this is not up-to-date with respect to the data. -gavin]
Disclaimer: I have no competence at all in this area professionally. I search, and sometimes ask questions to elicit answers that haven’t been typed yet.
On this one, I can’t even guess which datasets were used. I do find a few that are old but interesting:
http://strat-www.met.fu-berlin.de/products/cdrom/html/section4.html#section4-2
QUOTE
4.2 SPARC Stratospheric Temperature Trend Assessment (STTA) (Ramaswamy et al., 2001)
Under the auspices of the World Climate Research Program (WCRP) the sub-program SPARC (Stratospheric Processes and Their Role in Climate) initiated the STTA Group. The charter was (1) to bring together all available data sets of stratospheric temperatures and (2) to analyse the trends in a consistent manner. The results of this work are published in Ramaswamy et al. (2001)….. The report deals carefully with all the problems arising from the various, very diverse data sets and their trends.
END QUOTE
And this one does graph trend lines for polar stratospheric temperature that on average over recent years would correlate to the trend line for area for PSCs in the article being discussed:
http://strat-www.met.fu-berlin.de/products/cdrom/html/section2-3.html#section2-3-1
QUOTE
2.3.1 Temperature Trends at the North Pole since 1956
The time series of the 30-hPa annual mean temperatures (°C) at the North Pole is shown in Fig.19. It is based on the data given in Table 4. If a linear trend is calculated for the whole series, the trend is -0.50 K/decade with a probability of 99%. But again, as discussed above, the interannual variability is large even in the annual mean and it is difficult to decide if this calculation is the correct answer to the question about temperature trend in the stratosphere…..”
END QUOTE
Again, disclaimer: I definitely don’t know what I’m talking about, I’m just pointing and grunting.
Skip that last one, this seems more on point (well, keep the disclaimers, I _still_ don’t know anything) ….
From:
http://strat-www.met.fu-berlin.de/products/cdrom/html/section2-1.html#fig13
Figure:
http://strat-www.met.fu-berlin.de/products/cdrom/fig/fig13.gif
Caption:
Figure 13: Number of days with temperatures lower than Tnat (white) or Tice (red) at (a) 50 hPa and (b) 30 hPa. Integral for each season of the area (in % of the Northern Hemisphere) which had temperatures low enough for the formation of PSCs, (c) at 50 hPa and (d) at 30 hPa. ( Fig.2 in Pawson and Naujokat, 1999, updated)
Markus’s thumbnail isn’t yet linked to a full size image, looks to me like the bottom two I found, at
http://strat-www.met.fu-berlin.de/products/cdrom/fig/fig13.gif
Can someone with the article and some competence in reading it comment whether the new Science article is an improved statistical analysis on the same dataset, or has other data or basis for what sounds like greater confidence in saying this is an apparent trend?
Sign me “Advocatus Diaboli” (grin)…
Off topic, but I thought I’d post these links to two very pertinent and important stories highlighted by Chris Mooney:
This on Inhofe’s latest diatribe against the IPCC and Michael Mann:
http://www.chriscmooney.com/blog.asp?Id=1806
and this one that links to an interesting bit of investigation by George Monbiot of the Guardian regarding pitifully sourced reports of glacial expansion:
http://www.chriscmooney.com/blog.asp?Id=1805
Markus Rex graphs shows a linear trend for the increasing PSC volume, and the left y axis the POTENTIAL OZONE LOSS ( not the measured one, am I right?) estimated from this PSC volume. My basic question: what is the actual TOTAL O3 column loss happening since January 2005 over Arctic?
Response to 9: Actually the values shown in the plot are based on our analysis of thousends of ozonesonde measurements. The red points show estimates of the average degree of chemical ozone loss inside the Arctic polar vortex. Isolating the signal of chemical loss from dynamical effects is not straightforward. The uncertainties of these estimates are in the order of 20%. Please note that the value for 2005 is still preliminary and its uncertainty is considerably larger. For various reasons ozone loss estimates for the past winter are more difficult than usual and the uncertainties of the final analysis will remain larger than for most previous winters. But based on all information we have, the statement that the loss in 2005 was at least as large as the previous record and probably larger is robust.
The continued dry conditions experienced in Eastern Australia over the last 5 years coinsides with the appearance of static high pressure systems over the continent. Low pressure systems coming from the Indian Ocean are forced down into the Southern Oceans, taking with them any moist air.
The increasing depleation of ozone over the Pole regions, Real Climate (6 May 2005)Record Artic Ozone Loss, has at least coincided with decreased temperatures, comment 5, and increased snow falls in the Antartic continents interior, New Scientist (28 May 2005) in Brief, p.17.
Comments on the shift in weather patterns caused by ozone depleated areas at the poles could possibly explain some weather shifts blamed on the greenhouse affect. Are other Southern continents experiencing weather shifts caused by these meandering low’s. The mechanics of ozone depleation and accumulation have not been studied here but rather the effect it has upon the weather patterns. It is interesting to note that the arctic also appears to be experiencing problems arising from ozone depleation as does the Antartic.
These are just some brief observations based on the Australian perspective. It appears that a more wider perspective involving the whole globe then working back to a regional experience seems to work better than the other way around.
I look forward to further comments in this most informative media.