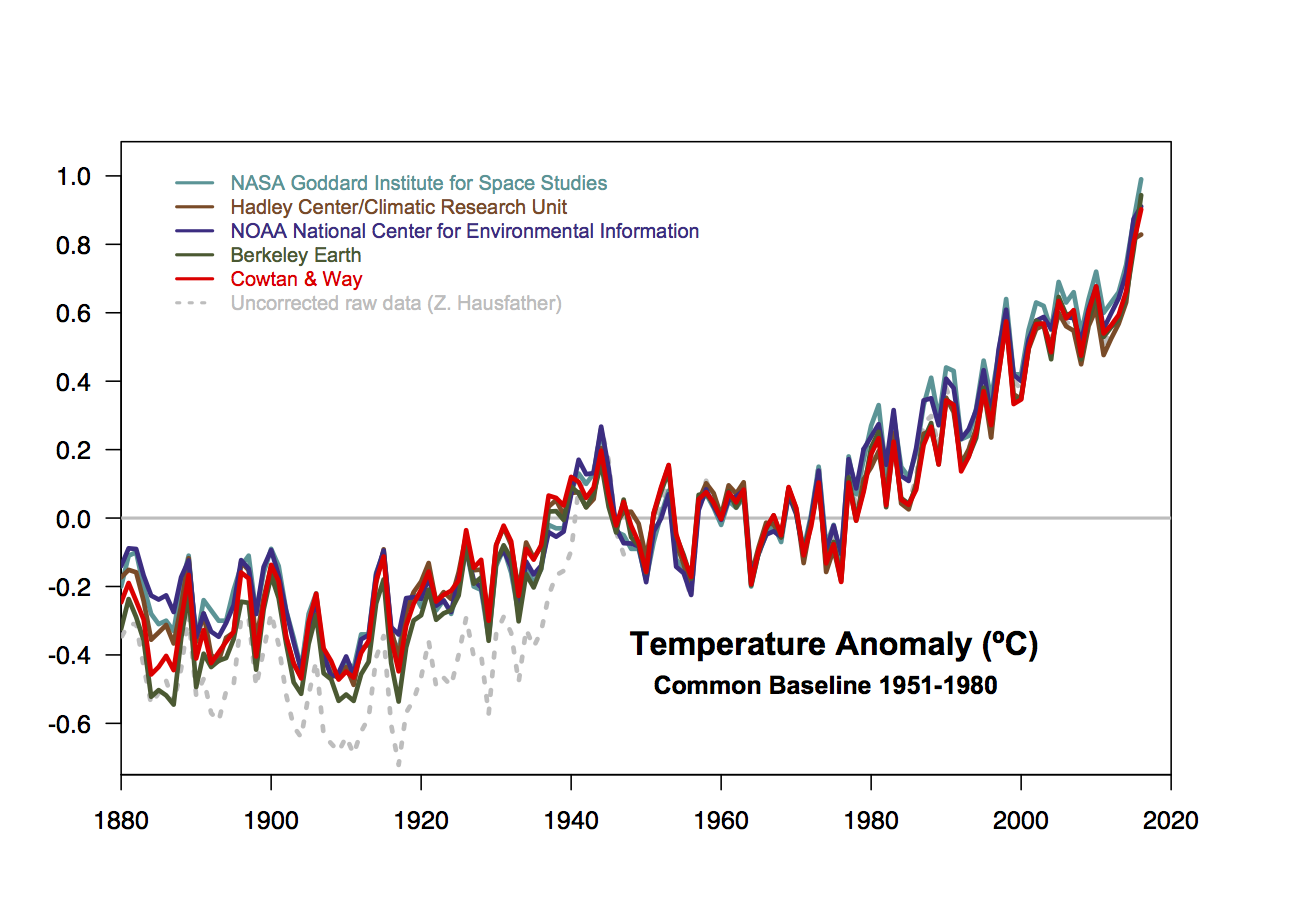
To nobody’s surprise, all of the surface datasets showed 2016 to be the warmest year on record.
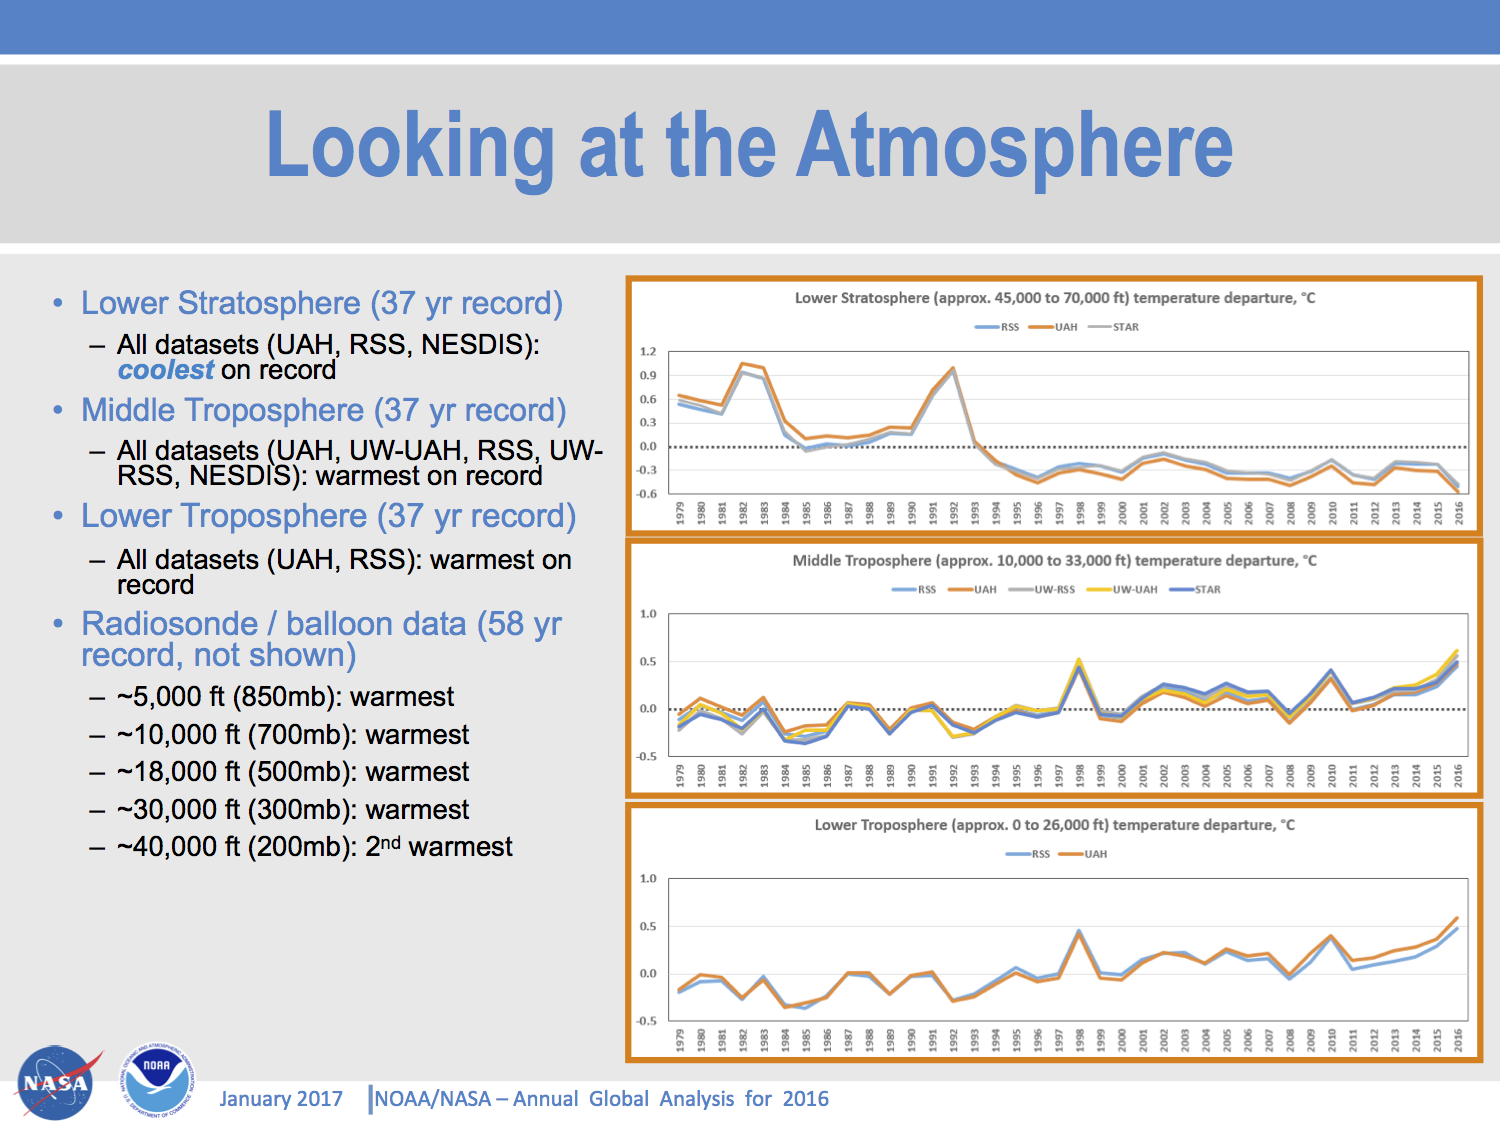
Barely more surprising is that all of the tropospheric satellite datasets and radiosonde data also have 2016 as the warmest year.
Coming as this does after the record warm 2015, and (slightly less definitively) record warm 2014, the three records in row might get you to sit up and pay attention.
There a few more technical issues that are worth mentioning here.
Impact of ENSO
The contribution of El Niño to recent years’ anomalies in the GISTEMP data set are ~0.05ºC (2015) and ~0.12ºC (2016), and that means the records would still have been set even with no ENSO variability.
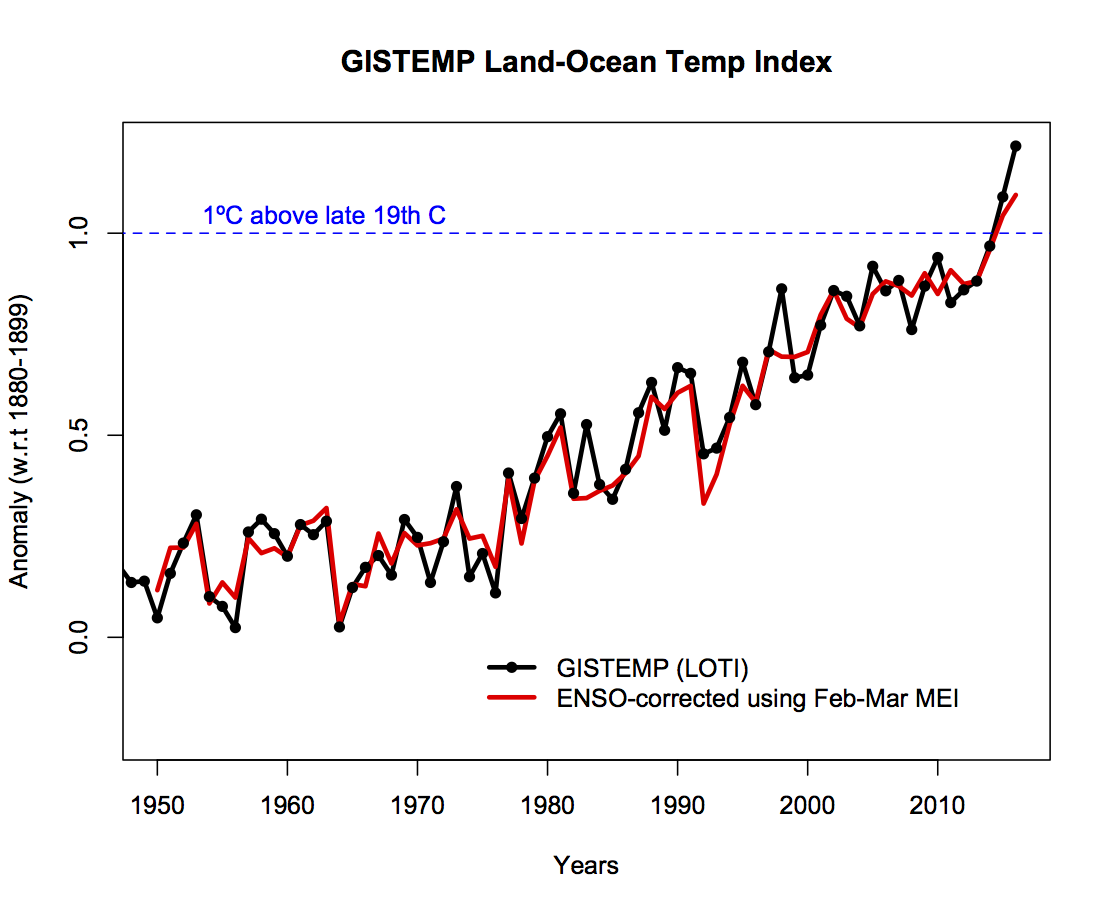
I calculated these values using a regression of the interannual variability in the annual mean to the Feb-Mar MEI index. This has (just) the maximum correlation to the annual means (r=0.66). The impact of ENSO on other indices is similar, but does vary – the datasets that don’t interpolate to the Arctic, in recent years at least, have a slightly stronger ENSO signal, as do the satellite tropospheric records. Doing the same procedure with the HadCRUT4 data, does change the ordering – with 2015 staying as the record year, but using the Cowtan and Way extension, the results are the same as with GISTEMP. Which brings us to another key point…
Impact of the Arctic
It’s perhaps not obvious in the first figure, but the magnitude of the record in 2016 is much larger in GISTEMP and Cowtan&Way (and in the reanalyses), than it is in HadCRUT4, NCEI and JMA. This is in large part due to the treatment of the Arctic. The latter 3 records all ‘conservatively’ don’t include areas where there aren’t direct observations in their global means. This is equivalent to assuming that the missing areas are, on average, warming at the same rate as the global mean. However, this has not been a good assumption for a couple of decades. Arctic anomalies this year were close to 4ºC above the late 19th Century, over 3 times as big an anomaly as the global mean.
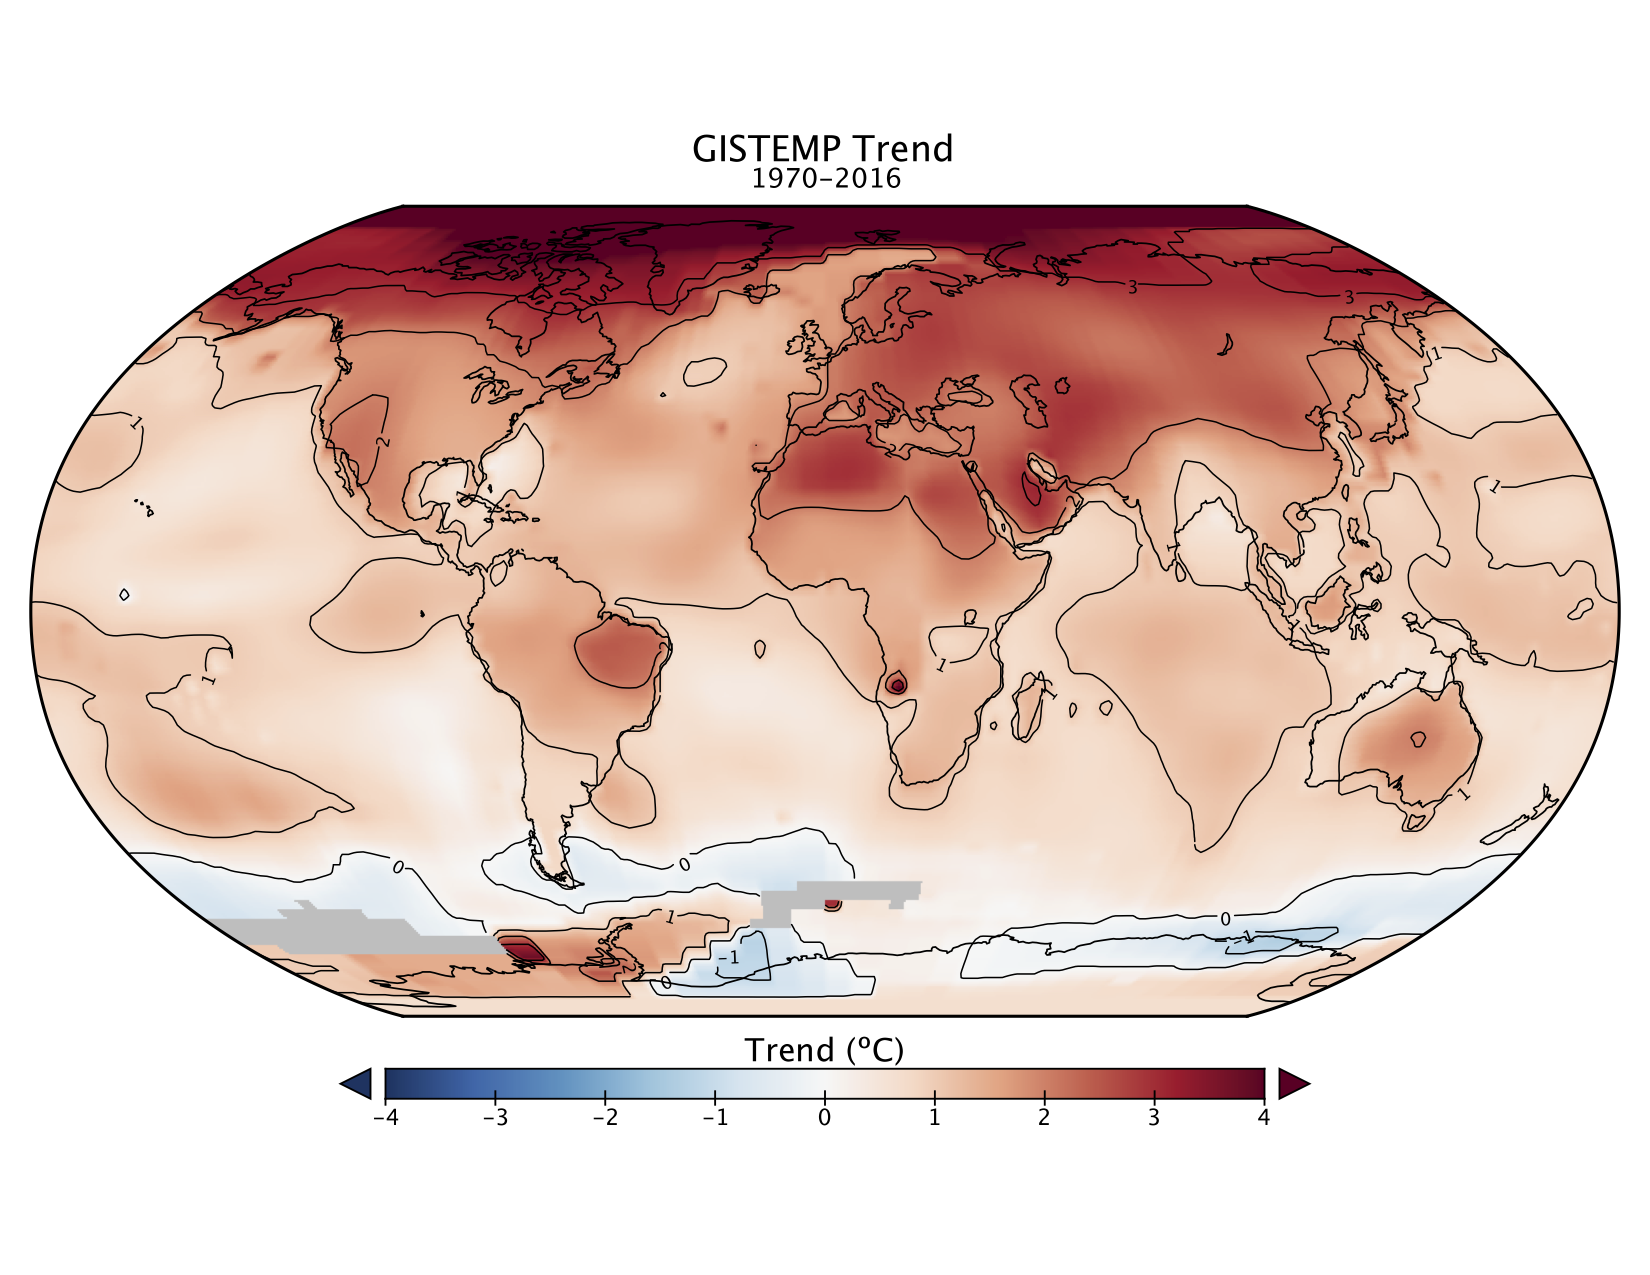
This divergence between the ‘global’ averages wouldn’t matter if all comparisons were done against masked model output, but this is often skipped over for simplicity. I personally think that both HadCRUT4 and NCEI should start producing a ‘filled’ dataset using the best of the techniques currently available so that we can move on from this particular issue.
Do I have to mention the ‘pause’?
Apparently yes. The last three years have demonstrated abundantly clearly that there is no change in the long term trends since 1998. A prediction from 1997 merely continuing the linear trends would significantly under-predict the last two years.
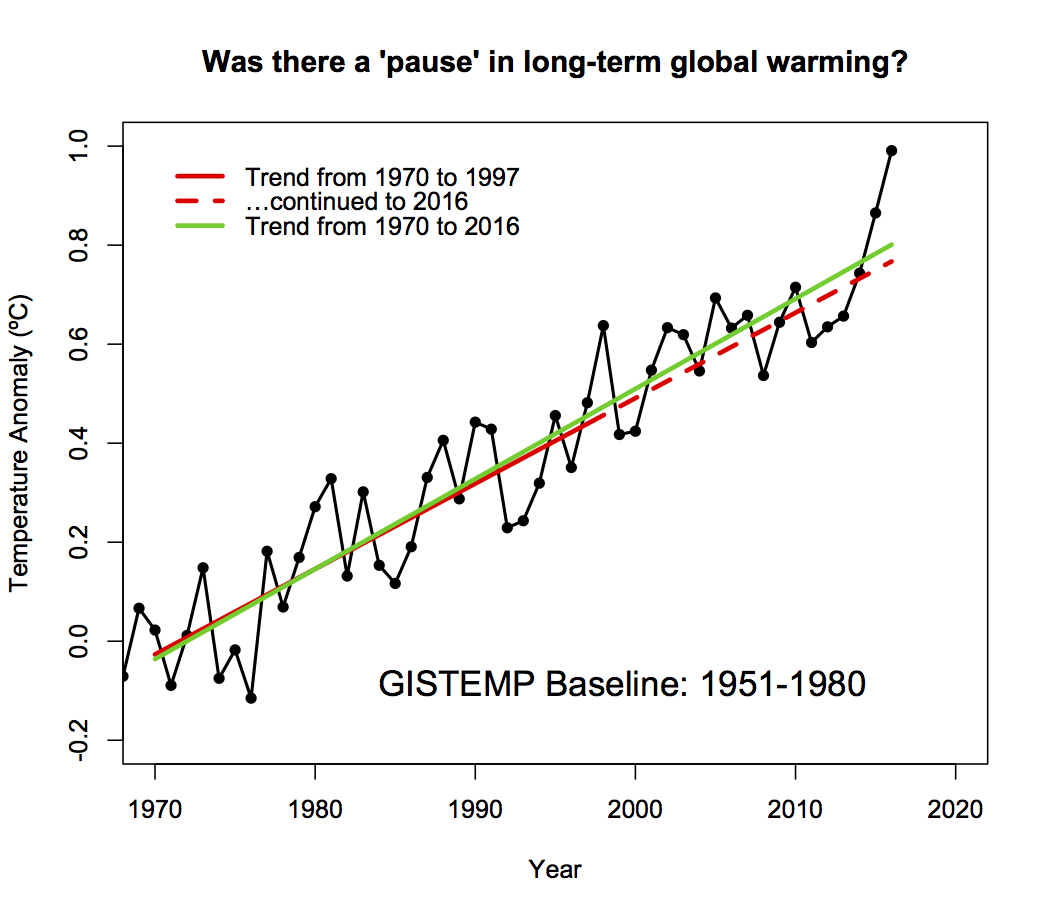
The difference isn’t yet sufficient to state that the trends are accelerating, but that might not be too far off. Does this mean that people can’t analyse interannual or interdecadal variations? Of course not, but it should serve as a reminder that short-term variations should not be conflated with long term trends. One is not predictive of the other.
Excellent, Gavin, I hope Lord Lawson & Co. will take notice
The New York Times has produced an interactive applet that allows users to submit the name of their city and if it is in the database, it will show the anomaly for that city. THE PROBLEM is that the Times used 1981-2010 as their base period. I there something similar using 1880-1920 or at least somewhat more reasonably 1951-1980 base period? Or a reasonable conversion factor?
Thanks- we are starting to get a some traction here in Nebraska, especially with the Democratic climate Caucus, but we want to do the data right!
Sorry- did not include the link to the Times: http://bit.ly/HowMuchWarmer2016
Deniers believe this is not science, that scientists have abandoned the “scientific method” — as they understand it. It’s the old story.
Dr John Snow took the handle off the pump that was spreading cholera in Soho, London. The authorities replaced it because the oral-faecal method of transmission of disease was too unpleasant to contemplate. People preferred to believe it was “bad air”.
Now we’ve got “bad air”, the truth is too unpleasant to contemplate.
Berkeley Earth has the temperature of Nebraska. It also gives the data. You can simply subtract the mean temperature of 1880-1920 from all temperature (in xls) to get the graph you want.
http://berkeleyearth.lbl.gov/regions/nebraska
They have such data for US states http://berkeleyearth.lbl.gov/state-list/
and even for cities http://berkeleyearth.lbl.gov/city-list/
A few other types of “OTEC” will work also but they are not as efficient as “Ocean Mechanical Thermal Energy Conversion” or “OMTEC”. One would be “Ocean Wind Mechanical Thermal Energy Conversion ” or “OWMTEC” and “Ocean Solar Thermal Energy Conversion” or “OSTEC” . Different combinations of all of these can get us out of the quagmire… If you think not then I’ll be glad to give you a blackboard tutorial on the subject and let your scientists work out the maths.. TYVM.. Another one with the same acronym as “Ocean Wind Mechanical Thermal Energy Conversion” or “OWMTEC” would be “Ocean Wave Mechanical Thermal Energy Conversion”.
Well done.
Looks like the new U.S. government will be following the Libertarian Heritage Foundation roadmap for budget cuts and will be attempting to cut 1 trillion a year from U.S. government spending.
Get your Resume’s ready.
You are going to need them.
So here’s audio and slides on this topic:
http://www.noaa.gov/sites/default/files/atoms/files/NOAA_NASA%202016%20Global%20Temp%20Call%20011816.mp3
https://www.ncdc.noaa.gov/sotc/briefings/201701.pdf
More than half the hour is Q & A–which underscores the public in the public nature of this inquiry, and adds value. Yes we want to know. Thank you very much.
Thanks Gavin. As per Tamino’s recommendation…I’ll continue to do what I can, come hell or high water. Expect both. http://tamino.wordpress.com/2011/05/07/hell-and-high-water/
As with temps, so with coral bleaching–it’s the trend that counts the most, not particular records broken along the way. But here’s one on coral bleaching (and for largely the same reasons): Only 7% of 911 reefs in the Great Barrier Reef have escaped bleaching:
https://www.theguardian.com/environment/2016/apr/19/great-barrier-reef-93-of-reefs-hit-by-coral-bleaching
The world is in the midst of a global bleaching event, which is a result of a pulse of warm water flowing around the Pacific Ocean caused by El Niño, and the background global warming caused by man-made greenhouse gas emissions. …in the previous two mass bleaching events – 1998 and 2002 – 40% of the reefs escaped bleaching.
“By that metric, this event is five times stronger. And in those two years, only 18% of reefs were severely bleached. This time it’s 55%. We’ve never seen anything like this scale of bleaching before…” said Hughes. [–Prof Terry Hughes, from James Cook University and head of the National Coral Bleaching taskforce]
Get your Resume’s ready, make sure your Passport is up-to-date and start lodging applications to emigrate and/or prepare your brief for Political Asylum applications.
And for anyone communicating with peers in Australia, know that the keeping of all metadata records of Australian telcos for 2 years goes into full force in April.
I also hope that all good climate scientists have hired an external professional white hat hacker to ensure your comms and data is secure from here on in.
No, I’m not joking. 5xPs Proper Planning Prevents Poor Performance aka avoid being burned at the stake for witchcraft.
Thanks for the graphs and the comments Gavin. Never forget there’s a bright red bulls eye painted on your back.
VD 8: Looks like the new U.S. government will be following the Libertarian Heritage Foundation roadmap for budget cuts and will be attempting to cut 1 trillion a year from U.S. government spending.
BPL: Great. Instant recession.
Congratulations.
We also got the similar results based on our newly global homogenized and integrated land surface air temperature dataset (CMA_LSAT), 2016 is about 0.1 ºC warmer than 2015.
[Response: I’d be happy to include your estimates in future comparisons, do you have a link to your analysis? Thanks! -gavin]
That’s one proven way to cut fossil fuel use.
BEST and JMA also have 2016 at the top rank.
Does the fact that 7 different data sets all have 2016 as the warmest year have any bearing on the uncertainty?
Hello, this comes from a frequent visitor whose wife has global warming doubts but who seems to be waking up to the problem.
She recently viewed the color-coded NASA video showing 1880 to 2016 global warming, as well as NASA’s graphic display. She found them very informative (the video especially as to the arctic) but asked about the global temperature run-up that occurred in 1938-45. To my chagrin I had no ready answer.
I’ve Googled the question, and looked at the Skeptical Science website, to no avail. Does anybody have an explanation? The obvious factor is World War II, but it’s hard to figure how that would cause a spike rather than a permanent bump-up in the trend.
Thank you!
[Response: It’s not the war – directly at least! There is some continuing uncertainty in temperature data around that period for obvious reasons, but the (El Niño-related) spike in the early 40s is real, as is the trend before that (say 1910-1940). Partly it is due to the already ongoing increases in greenhouse gases, but other forcings and internal variability must have played a part. Unfortunately, we don’t have great estimates of what solar did, or aerosols, during this period, and since we don’t have ocean heat content data, or stratospheric temperatures, it’s harder to constrain exactly what’s going on. Thus all explanations for that period are more uncertain than we’d like. – gavin]
@#5 -thanks, Victor Venema (@VariabilityBlog).
Record cold, 2014-2016
2014: https://en.wikipedia.org/wiki/Early_2014_North_American_cold_wave#Role_of_climate_change
“The 2014 North American cold wave was an extreme weather event that extended through the late winter months of the 2013–2014 winter season, and was also part of an unusually cold winter affecting parts of Canada and parts of the north-central and upper eastern United States.[4] The event occurred in early 2014 and was caused by a southward shift of the North Polar Vortex. Record-low temperatures also extended well into March.
On January 2, an Arctic cold front initially associated with a nor’easter tracked across Canada and the United States, resulting in heavy snowfall. Temperatures fell to unprecedented levels, and low temperature records were broken across the United States.”
2015: https://en.wikipedia.org/wiki/2014%E2%80%9315_North_American_winter#Northeastern_United_States
“Nine states in the Northeast United States had their coldest recorded January–March ever on record.[69] According to the National Oceanic and Atmospheric Administration, from February 1 to 28, 2015, 898 lowest minimum temperature records were broken and 91 were tied in the Northeastern United States. In addition, 736 records for the highest snow depth were broken and 138 were tied during the same period.[70]
Over a large portion of New England, February 2015 was the most extreme winter month observed in modern record keeping. Eastport, Maine was one of many places also seeing record snowfall, with 132.5 inches (337 cm) over five weeks. Snowflakes fell on 19 out of 28 days in the Boston, Massachusetts area, setting records in numerous locations with depths up to over 36.0 inches (91 cm) deep in certain places. Boston broke the previous record for the snowiest month by almost 24.0 inches (61 cm).[71]”
2016: https://weather.com/forecast/national/news/back-to-back-arctic-cold-blasts-midwest-east-december-2016
“The second of two arctic cold blasts in the past week has plunged into the central and eastern states, setting more than three dozen record lows.
Temperatures have been dangerously cold in some areas, with wind chills in the 30s, 40s and even 50s below zero during the past weekend.
Dozens of record lows have been set in the Midwest and Plains since this weekend as the second of two arctic blasts in the past week invaded those regions.
Actual air temperatures fell into the 20s and 30s below zero, while wind chills plunged into the minus 30s, 40s and even a few 50s at times during the weekend.”
Let’s not forget 2017:
“Parts of Alaska See Coldest Temperatures in Several Years as Lows Plummet into the 40s and 50s Below Zero.” https://weather.com/forecast/regional/news/alaska-frigid-below-zero-temperatures-january-2017
“A major cold snap gripped Alaska.
Temperatures dipped into the 40s and 50s below zero.
Some cities saw their coldest lows in several years.
While much of the Lower 48 enjoyed a January thaw, Alaska experienced its coldest air of the winter season. Parts of the state even saw their coldest temperatures in several years.”
http://www.king5.com/weather/a-look-back-at-portlands-record-setting-snowfall/385538190
“Snowy pictures and video continues to pop up from the Portland area as they dig out from their record-setting snowfall. Here’s a quick look back at what happened:
The snow started the evening of January 10. The heaviest snow fell between 8 p.m. and 2 a.m., with even a few reports of thundersnow. The snow was so heavy that chains were required on all vehicles in the Portland metro area for a time. Much of the city is still shut down today, including most schools.
It wasn’t necessarily an all-time historic snowstorm, but it still ranks as the 5th snowiest 24-hour period in Portland history. First place belongs to January 21, 1943, when over 14-inches fell. Two daily snowfall records were set at the Portland airport: January 10 – 6.5-inches, and January 11 – 1.5-inches.
It will go down as the snowiest day since December 2008, and the worst snow event since 1995 (22 years ago!)”
Global Temperature in 2016 – 18 January 2017
BY: James Hansen, Makiko Sato, Reto Ruedy, Gavin A. Schmidt, Ken Lob, Avi Persinb,
Abstract.
Global surface temperature in 2016 was the highest in the period of instrumental measurements. Relative to average temperature for 1880-1920, which we take as an appropriate estimate of “pre-industrial” temperature, 2016 was +1.26°C (~2.3°F) warmer than in the base period.
The 2016 temperature was partially boosted by a 2015-16 El Niño, which was almost as strong as the 1997-98 “El Niño of the century”. We estimate current global temperature excluding short-term variability as +1.07°C relative to 1880-1920, based on linear fit to post-1970 global temperatures.
see in full, a short 6 pages with graphs etc
http://www.columbia.edu/~jeh1/mailings/2017/20170118_Temperature2016.pdf
BPL: Great. Instant recession.
Correction. Grand Economic Depression, if that budget is followed.
Conservative Media outlets are laughing at the new global temperature measurements and claiming that it is just more faked data. As proof of this, they assert that the yearly string of record highs, is just one exaggeration after another since the string of highs clearly can’t be real.
Do I have to mention the ‘pause’?
The start date for the pause will probably be reset from 1998 to 2016. In fact, to go by the number of times I’m reading that the usual suspects are quoting El Nino as the sole cause of the current spike, it’s already happening.
re: 19 and 20.
Why are you posting about short-term *weather* events when the issue at hand is long-term *climate*? Wow, what scientific arrogance. And on a climate blog run by peer-reviewed climate scientists yet.
You might want to learn the distinct differences in time between weather and climate since it is apparent you have little clue about them. And that it takes 30-year periods to account for long-term trends due to short-term natural variations. As any basic climate science internet search would have told you.
The temperature trajectory suggests enormous problems ahead. The deniers deal with this by putting their heads in the sand. But I don’t think that the non-deniers do much better. They acknowledge the problem, but do extremely little to deal with it. CO2 exponential growth has not abated. The Paris agreement is totally inadequate. Promises around the world to rely less on carbon fuels usually turn out to be empty promises. Wind and solar power show no signs of providing much relief.
In other words, the non-deniers should get off their high horse.
S B Ripman, #17. There’s no (direct) harm in curiosity about 1940’s temperatures, and you couldn’t have a better source than Gavin for reviewing what’s known and what’s uncertain.
However. The answer to the question behind the question is that it doesn’t matter. The rise since the 1970’s is huge compared to the little bumps around the 1940’s. We know what it’s from, to a certainty that is best expressed as “as near as makes no difference” for purposes of determining the broad shape of policy.
What conceivable and plausible answer about the 1940’s would make such a difference that it would affect the broad shape of the needed policies and actions?
Speaking of rapid meltdowns, The White House website Climate Page has already been taken down, and replaced with this:
https://vvattsupwiththat.blogspot.com/2017/01/that-didnt-take-long.html
It is amazing that none of you mention the impact of global geoengineering (including their ramp-up periods). The evidence that coal ash with various nanoparticulates and so-called engineered biologicals are being dumped globally is overwhelmingly proved by lab tests and by the work of geophysicist J Marvin Herndon. I encourage you all to go to geoengineeringwatch.org and explore the vast work of Dane Wigington. There was a rampup period in the dumping in 1998 and wondering if this might be linked to coral bleaching as well.
Victor@19,20, Jebus, dude, that’s sad even for you. You sure you’re feeling OK? Too much schnapps at the deploraball?
WASHINGTON, DC — A climate of change! Perhaps the most stark contrast between the Obama administration and the Trump administration is on “global warming”. The climate differences were visible today as the White House website was scrubbed of all references to “climate change” at exactly noon today just as President Donald Trump was sworn in.
“Climate skeptics are thrilled that one of the very first visible changes of the transition of power between President Obama and President Trump is the booting of “climate change” from the White House website. Trump is truly going to make science great again and reject the notion that humans are the control knob of the climate and UN treaties and EPA regulations can somehow regulate temperature and storminess. Welcome to the era of sound science!”
Meteorologist and Weather Channel Founder John Coleman had one word to describe the White House climate website changes. ‘Hooray!
It’s customary for http://www.whitehouse.gov to flip over to the new administration exactly at noon, but the only mention of climate on President Trump’s new website is under his “America First Energy Plan” page, in which he vows to destroy President Obama’s Climate Action Plan, which is a government-wide plan to reduce carbon emissions and address climate change.
25 t marvell says: In other words, the non-deniers should get off their high horse.
There’s as much chance of that happening T as Chris Monckton becoming a ‘born-again warmist’ or Judith Curry being the Greens Presidential candidate in 2020. :-)
Gavin,
O/T question.
Can you please refer me to a widely accepted chart of global average temperatures through the Phanerozoic Eon (i.e. the past ~542 Ma)?
I have read some of the comments on your 2014 post “Can we make better graphs of global temperature history?” https://www.realclimate.org/index.php/archives/2014/03/can-we-make-better-graphs-of-global-temperature-history/ , but did not find the answer to my question. (e.g. I saw comments by Dana Royer and Gavin Foster and others)
The best I am aware of is Scotese’s 2015 update here:
https://html2-f.scribdassets.com/9mhexie60w4ho2f2/images/1-9fa3d55a6c.jpg
Source: https://www.academia.edu/12114306/Phanerozoic_Global_Temperature_Curve
The benefits of this chart for ease of communication to a general audience are:
1. the vertical axis is in degrees C, not degrees change or some other units
2. It can be compared with his charts of temperature by latitude for different average global temperature and temperature gradient from equator to poles. And with his chart of average temperature in the tropics for the past 542 Ma (although I find it hard to believe the trend). These two charts are Figures 12 and 13 here: https://www.academia.edu/12082909/Some_thoughts_on_Global_Climate_Change_The_Transition_from_Icehouse_to_Hothouse
I hope you can provide a link to an authoritative chart of global average temperature for the Phanerozoic Eon I can refer to in future.
19/20 and all the others – Oh victor my victor, the energizer bunny of RC :-)
What about the half a foot of snow that fell around Corinth in sth Greece last week? Very unprecedented cold snap – sure it snows there in winter at times (not every year) but snow never accumulates much if at all – it’s simply too warm a climate (unlike the north Greece or say in Greenland).
Where did all that Grecian snow come from Victor – well it arrived on the sting of the tail of Global Warming and Climate Change as the result of using fossil fuels for energy for the last 250+ years.
Of course this is impossible for you to believe because it conflicts with your ideological and religiously held beliefs, hey Victor. :-)
17 S.B. Ripman, re early 40s there were some severe droughts heatwaves in Australia at that time too … my money (i’m no scientist either) but given what I have seen re the 1940s my money is on an multiple el nino spike and potentially a co2ppm spike from industry pre/during ww2 (my guess – as in the atmosphere spiked in CO2 NO etc before the oceans sucked it all up again post ww2 – no one has ever done the numbers for major growth in energy related emissions at that time that I have seen)
In general maybe try some poltholer54 videos
https://www.youtube.com/channel/UCljE1ODdSF7LS9xx9eWq0GQ
especially these two
https://www.youtube.com/watch?v=CY4Yecsx_-s and
https://www.youtube.com/watch?v=TRCyctTvuCo
Logic should do the rest, given that Monckton is the living patron saint of denialists. :-)
Does this mean that we are likely to get another record hot year for 2017 since ENSO played a relatively minor part last year?.
20 Victor… and your point is……what?. Increased snowfall will mainly be due to increased atmospheric water vapour. Also as the polar regions warm the troposphere widens thus more water vapour/km^3Thank you for supporting 98% of climate scientist’s conclusions. The fact that the mid lat jet stream winds are also slowing w-e and widening n-s. Trapping pockets of super saturated air over locations for vastly extended periods of time. C’mon Victor, visualise will you!
I’d like to see a graph of projections made earlier with ME shadows (gray areas) and see if 2016 goes above those ME shadows. The reason — some years back denialists were harping on how some years after 1998 (I think around 2008) went below the ME shadows, so ergo the science was wrong….
What conceivable and plausible answer about the 1940’s would make such a difference that it would affect the broad shape of the needed policies and actions?
As Ripman said, it’s a core denier plank that is misused against the science as a whole. Every plank that can be removed by best practice knowledge should be (if feasible). The 1930s/1940s heat waves are used as part of the other core denier plank of manipulated temperature data – everything is connected.
All the dominoes need to be knocked over, all the denier planks removed so that Ripman’s wife and every other person individually has a better chance of rising above the BS by listening to and understanding the “real climate science” outside of the looney echo chambers infested by Titus’ Judith currys, jennifer marohasys and Inhofes… imho at least.
PS …. aka “it matters to this starfish”
File under: Duh-oh. Cowtan misspelled on first Figure.
Re the temp rise up to the mid 1940s, besides multiple el Ninos and rapidly growing anthro CO2, IIRC solar output also rose in that period, plus there was a lull in large volcanic eruptions in the tropics. And then there is the infamous canvas bucket vs engine cooling intake pipe sea surface sampling change during WW2, which replaced a cooling bias (bucket) with a warming bias (pipe), bumping the peak a bit higher. A rapid boost in particulates and sulfur aerosols in the post-war boom quickly lopped off the peak and masked the warming of ever rising CO2 until the Clean Air Act and similar policies in the UK and Europe rapidly reduced aerosol emissions, ending the 1945-1980 “pause” to reveal the masked CO2 warming that had always been there. In other words, there were multiple reinforcing and dampening drivers.
S.B. Ripman says: “She recently viewed the color-coded NASA video showing 1880 to 2016 global warming, as well as NASA’s graphic display. She found them very informative (the video especially as to the arctic) but asked about the global temperature run-up that occurred in 1938-45. To my chagrin I had no ready answer.”
The situation is not fully clear yet. Part of the WWII peak will be El Nino, but the raw sea surface temperature data also shows a considerable war bias because merchant ships before and after the war have a cold bias, while the war ship making measurements have a warm bias. This is a post of mine on WWII warming with more detail.
The necessary adjustments in this period are thus large, which adds the uncertainty.
The sea surface temperature of NASA’s GISTEMP comes from ERSST. The way ERSST computes the adjustments, they cannot follow the fast changes around the WWII. Well before and well after WWII, the data is good, but in a period around WWII it is more uncertain. If you are interested in this period, HadSST or HadCRUT are better datasets; their methods are better suited for fast changes.
It is important for science to get this right. I do not get why this is important for the question whether climate change is real. I hope your wife did not come into contact with the false claim that while the warming after WWII is man-made, the warming before WWII is natural. The warming before WWII is less well understood and partially natural (volcanoes, sun), but also for a large part due to greenhouse gases. See the IPPC estimates of the forcings over time in this post.
Anna:
Anna, are you familiar with the least-hypothesis rule, also known as “Occam’s Razor”? Yes, some conspiracy theories have turned to be true, but there are more parsimonious (and less sinister) explanations for what Herndon and Wiginton claim are evidence of a conspiracy. I won’t cite any here, as conspiracism tends to be self-sealing, thus it’s unlikely any evidence can dissuade you from yours. For me, though, science is first and foremost a way of trying not to fool myself (“The first principle is that you must not fool yourself — and you are the easiest person to fool.” -R. Feynman). After taking a look around the geoengineering dot com site, I’m afraid I’m unable to take it seriously, as the contributors seem far too willing to fool themselves.
Anna: About J Marvin Herndon in particular please take the time to read this thread open-mindedly: https://www.metabunk.org/debunked-j-marvin-herndons-geoengineering-articles-in-current-science-india-and-ijerph.t6456/
About Chemtrails in general: the whole idea started with the misconception that persistent contrails can’t exist without some additives. People who believe this to be true are unaware of the fact that already in 1953 scientific articles appeared explaining how these persistent contrails develop in ice supersaturated regions.
The mechanism behind the currently observed climate change (increasing amounts of greenhouse gases will add more heat to the climate system) has been described from about 100 years ago and in the subsequent time the understanding and predictions have proven to be more and more accurate, so there is no need to come up with an unproven very unlikely conspiracy hypothesis based upon a demonstrably wrong assumption.
#42 Victor: Thanks for that. I mean, on the ships. Nothing like observations*, and in this case, observations of the observations–I mean of methods of observation, if not of the observer too.
*Your blog post, which you link, is of practical, theoretical and historical import. It’s quite detailed and helpful.
S.B. Ripman, do check it out–and anyone else who has thought about these questions.
Give us more public education, Lord.
43 I agree with you about current use of geoengineering after studying the web cite. But it will probably be used in the future. Given the scale of the climate problem, little is being done to stop CO2 growth (it is still increasing exponentially), and I don’t see the political will to do what is necessary to slow it down. Thus, governments almost have to try geoengineering. There will be major controversy about whether high global temperatures or geoengineering are worse. Both are moves into the wild blue yonder.
Dr Gavin Schmidt on why 2016 was a record warm year
Dr Gavin Schmidt is director of the NASA Goddard Institute for Space Studies. Carbon Brief caught up with him at the University of Southampton, on 12 Jan 2017. https://www.youtube.com/watch?v=9f9NToKsiCA
#25,T. Marvel–“…the non-deniers should get off their high horse.”
Each to his own, but I’m trying to use my high horse to make up some of the ground we’very lost over the last 20 years.
#20:
It’s interesting what can happen during the worlds hottest January on record.
Bit worrying though.
Sorry, re #20, should have said it’s interesting what can happen exactly a year after the worlds hottest January on record.
Still a bit worrying of course.