Last weekend, in Reykjavik the Arctic Circle Assembly was held, the large annual conference on all aspects of the Arctic. A topic of this year was: What’s going on in the North Atlantic? This referred to the conspicuous ‘cold blob’ in the subpolar Atlantic, on which there were lectures and a panel discussion (Reykjavik University had invited me to give one of the talks). Here I want to provide a brief overview of the issues discussed.
What is the ‘cold blob’?
This refers to exceptionally cold water in the subpolar Atlantic south of Greenland. In our paper last year we have shown it like this (see also our RealClimate post about it):
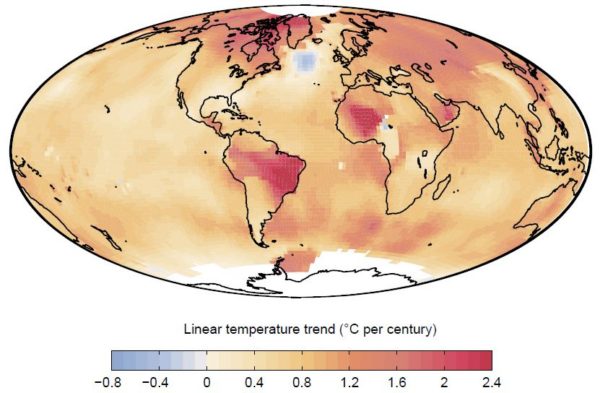
Fig. 1 Linear temperature trends from 1901 to 2013 according to NASA data. Source: Rahmstorf et al, Nature Climate Change 2015.
Sometimes the term ‘cold blob’ is not used for this long-term trend but for a recent snapshot: 2015 was the coldest year in this region since records began in 1880 – despite this being globally the warmest year on record. In the ‘cold blob’ discussion, one must thus keep in mind whether talk is about the long-term trend or a short-term anomaly. When we wrote our paper, of course, we did not know that its publication would then coincide with record cold in the area.
You can see the current ‘cold blob’ when looking at maps of the sea surface temperature for example on Climate Reanalyzer.
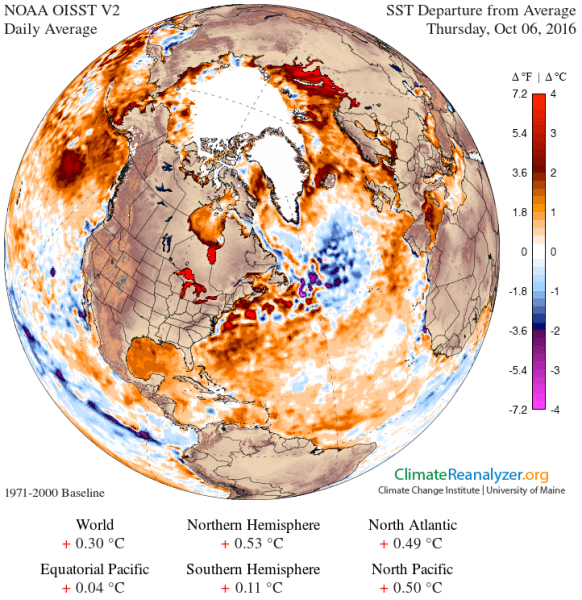
Fig. 2 Anomaly of sea surface temperature (relative to the base period 1971-2000) on 6 October 2016. Source: Climate Reanalyzer
What is the cause of the cold blob?
In principle, there can be two reasons for a change in ocean temperature: heat exchange through the surface or heat transports within the ocean. Halldór Björnsson of the Icelandic weather service showed in his lecture on Saturday that the short-term temperature fluctuations from year to year correlate with the heat exchange through the sea surface, but that this does not explain the longer-term development of the ‘cold blob’ over decades. He concluded that the latter is caused by changes in the North Atlantic ocean circulation, also called the Gulf Stream System. That’s exactly what one expects. Weather dominates the short-term fluctuations, but the ocean currents dominate the long-term development.
One suggestion that had been made some years ago – that the cooling may be caused by shading the sun by aerosol pollution – did not show up in the discussion on Saturday. In the scientific literature that idea was rapidly contradicted at the time, for good reasons (we discussed this in more detail in our paper).
What evidence speaks for a slowdown of the Gulf Stream System?
The basic problem is the lack of direct, continuous measurements of the key circulation in the Atlantic, the so-called AMOC (Atlantic Meridional Overturning Circulation). Such measurements are only available since 2004 through a series of moorings at 26°N (RAPID project). For the longer term development, one must therefore use indirect indicators of the flow.
My colleagues Mihai Dima and Gerrit Lohmann of the Alfred Wegener Institute in Germany in a 2010 study analysed the patterns of changes in global sea surface temperatures. They were the first to conclude that the AMOC has been weakening since the 1930’s. The evidence for this is the trend towards cooling in the subpolar North Atlantic which anti-correlates with temperatures in the South Atlantic (suggesting reduced heat transport from the South Atlantic to the North Atlantic). In addition, Dima and Lohmann found an anti-correlation to the temperatures off the US East Coast, to the south-west of the ‘cold blob’. This is not seen in Fig. 1 above, since the NASA data use a smoothing radius of 1200 km, but you can see it, for example, in the currently high temperatures in Fig. 2.
The latest high resolution simulations of the GFDL in Princeton show precisely this pattern in response to a CO2 increase in the atmosphere (discussed more in this RealClimate post). In the model the cause is a slowdown of the Gulf Stream system. There are also coral data from the Gulf of Maine off the US coast, which indicate a similar time evolution of water mass changes there as the ‘cold blob’ (discussed further in the same post).
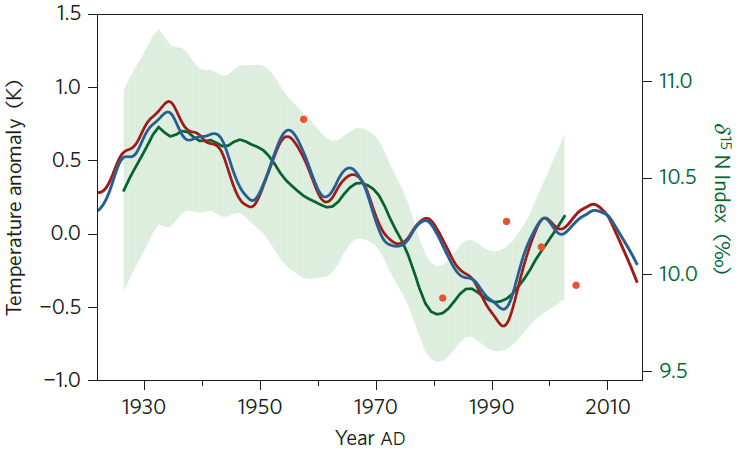
Fig. 3 Index of the strength of the overturning circulation in the Atlantic (AMOC), calculated from the temperature in the subpolar Atlantic minus the mean temperature of the Northern Hemisphere (red and blue curves). The green curve shows the coral data of Sherwood and colleagues. Source: Rahmstorf et al, Nature Climate Change 2015.
For the most recent past, the Atlantic flow index we calculated from the temperature pattern is consistent with other data. For the time since 2004, for which there are direct measurements of the AMOC from the RAPID array, the downward trend by 3 Sv measured there agrees with our indirect estimate. The significant slowdown after 1970 and then following recovery from about 1990 in our curve has been confirmed by other studies with other methods (see e.g. Haine 2016 and its schematic diagram).
What speaks against a slowdown of the Gulf Stream System?
As a counter-argument against a weakening of the Gulf Stream system, Steingrímur Jónsson on Saturday brought up the measurements of the so-called “overflow” from the Nordic Seas across the sills between Greenland, Iceland and Scotland, which do not show any trend. Here one must simply distinguish between different parts of the Atlantic ocean circulation. In our study, we argue that the AMOC in the open Atlantic has weakened – i.e. to the south of the ‘cold blob’, where the heat comes from. This is what’s measured by the RAPID array. The overflows further north are (i) unlikely to have an influence on the temperatures in the ‘cold blob’, and (ii) are largely independent of the AMOC in the open Atlantic – at least that is suggested by a model simulation of the Max Planck Institute for Meteorology in Hamburg, for which we show a correlation analysis in Fig. 2b in our paper.
Another counterargument (though not brought up in professional discourse but on a “climate skeptics” website) is that the measurements on the Oleander line across the Gulf Stream show no slowdown (Rossby et al. 2014). However, these cover only a 20-year period for which our AMOC index also does not show any slowdown. And as Tal Ezer showed in a study in 2015, these measurements of the Gulf Stream don’t correlate with the AMOC measurements of the RAPID array – which is not surprising because the AMOC is only a minor component of the mainly wind-driven Gulf Stream. Therefore these diverse measurements of other aspects of the complex Atlantic ocean circulation are by no means inconsistent with a general long-term slowdown of the AMOC as proposed by Dima and Lohmann.
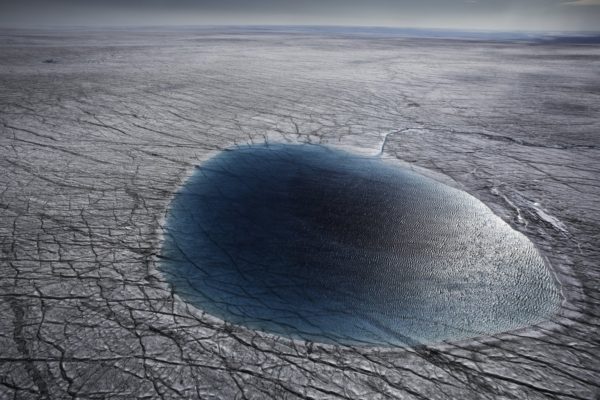
Meltwater lake in Greenland. Photo courtesy of Ragnar Axelsson
What role does the meltwater from Greenland play?
In our paper, we argued that the meltwater input from the Greenland ice sheet could play a so far neglected role (but not the main role, as some have misunderstood). The standard IPCC models, for example, have not yet taken into account this meltwater input. A new study by Claus Böning and colleagues (Nature Geoscience in 2016) has specifically studied the effect of added meltwater in a high-resolution ocean model. It was assumed that starting from 1990, the Greenland ice sheet begins to lose mass – initially starting with a melt rate of zero which is linearly increased until 2020. The authors find little influence on the flow – but this is hardly surprising given the design of this experiment. The real Greenland ice has not started to lose mass only since 1990, it takes time until the meltwater spreads and accumulates, and also the ocean circulation will react with delay and inertia. The prescribed cumulative meltwater amount in the model experiment is 7,500 cubic kilometers in the period 1990-2020, over half of which is added over the last ten years, so the AMOC has little time to react. In our paper, based on data from Jason Box from the Geologic Survey of Denmark and Greenland, we estimated that the Greenland ice sheet has already come out of equilibrium since the beginning of the 20th century and has since added about 13,000 cubic kilometers of meltwater to the ocean. The response of the AMOC could therefore be greater than in the model experiment.
In a further experiment, Böning and co-workers showed that a cumulative freshwater volume of ~20,000 cubic kilometers leads to a breakdown of deep convection and a slowdown of the AMOC by 5 Sv within a few years. The main conclusion of their study is not that Greenland melt has no influence on the AMOC, but as the title of the paper says it shows “Emerging impact of Greenland meltwater on deepwater formation in the North Atlantic Ocean”. It thus supports our argument that the contribution of Greenland melt should not be neglected.
Incidentally, the meltwater hardly has a direct cooling effect in the ‘cold blob’ region – its effect is rather via the dilution of the sea water with freshwater, which reduces the density and thereby hinders the sinking of the water which drives the AMOC.
Is the cold bubble caused by humans?
An important question, of course, is whether the changes in the subpolar Atlantic are caused by humans or are part of natural variability. In my opinion, this is a question of the time scale considered: the variations from year to year are obviously dominated by weather, and also decadal variations – such as the warming (probably the increase of the flow) from 1990 to the middle of the 2000s and the subsequent cooling (slowdown of the flow) – are likely to be mainly natural variations. In contrast, the long-term trend of Dima and Lohmann since 1930 is in my view largely anthropogenic. As the proxy reconstruction in our paper shows, it is probably unique in the context of the previous one thousand years. It is also predicted by climate models in response to the rising greenhouse gas content of the atmosphere.
Regarding the 2015 record cold in the subpolar Atlantic, the arguments are like a mirror image of the discussion about the global heat record of 2015. For the latter the question was El Niño or global warming? The answer is the combination of both. If the natural variation goes in the same direction as the human-caused trend, then a new record can be set. If the natural variation goes in the opposite direction, it can over-compensate the climate trend for a while.
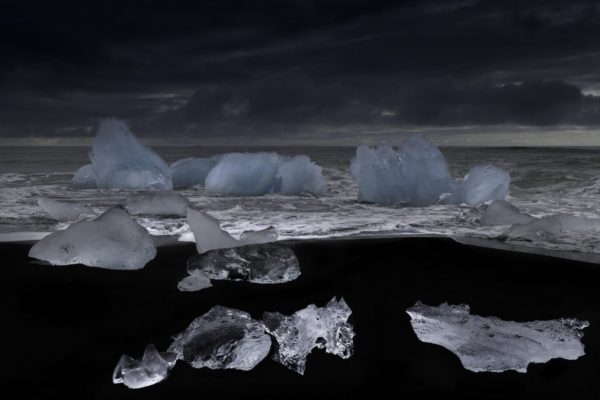
Ice on the coast of Iceland. Photo courtesy of Ragnar Axelsson
What impact does a Gulf Stream System slowdown have?
The potential impacts are increasingly studied, here just briefly a few examples. Haarsma et al. (2015) argue on the basis of model simulation that the weakening of the Gulf Stream system will in the future be the main cause of changes in the atmospheric summer circulation over Europe. Jackson et al. (2015) found that a slowdown is likely to lead to increased storm activity across Britain and parts of mainland Europe. And a new study by Duchez et al. (2016) connects the ‘cold blob’ in the summer of 2015 to the heatwave across Europe that year, because the cold subpolar Atlantic favors a certain air pressure distribution.
A 25-minute video lecture by myself recorded in Iceland last May. Source: Earth101. This project has many more clips with Gavin, Mike, me and other climate scientists – subscribe to their youtube channel (it’s free) to keep them coming.
Could the AMOC break down entirely?
This risk has been discussed since the 1980s, originally due to paleoclimatic data showing a number of abrupt AMOC changes in the course of Earth’s history. It is now well understood that there is a critical tipping point in the system. How far we are from this, however, is not known. Earlier model intercomparisons suggest that a freshwater flow in the order of 0.1 Sv (the equivalent of 3,000 cubic kilometers per year) could be critical. There are some arguments suggesting that models might systematically overrate the stability of the AMOC, which we summarized in PNAS in 2009. An assessment from 2011, commissioned by the European Environment Agency, concluded that the system may be viewed as more sensitive than suggested by earlier assessments.
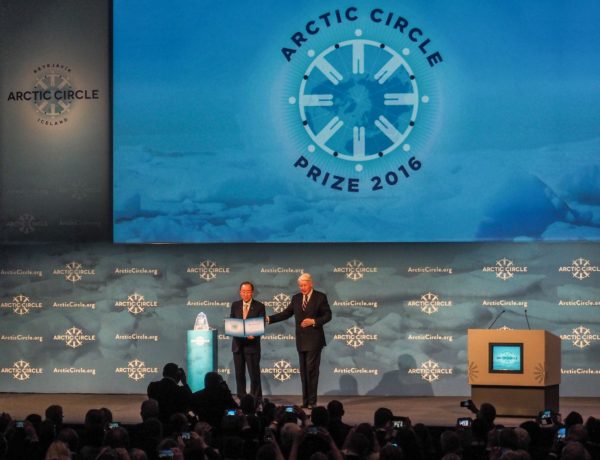
Postscript on the Arctic Circle Assembly. On Saturday, UN Secretary General Ban Ki-moon was awarded the Arctic Circle Prize for his long-standing commitment to the successful conclusion of the Paris Climate Agreement. He received standing ovations from the more than thousand conference participants in the overcrowded hall. In his acceptance speech he emphasised the record-breaking speed in which the agreement has been ratified; after taking the final hurdle a few days ago, it will come into force on 4 November! “What was once considered impossible has now become unstoppable” he said. “We must now turn words into deeds and implement the Paris Agreement. We do not have a plan B, since we do not have a planet B.”
Ban also answered audience questions, and when asked to give a few key lessons he has learned during his time in office, he said: There are many key players, just don’t leave it to governments! He called upon civil society and the business world to push for a low-carbon and climate-resilient economy.
For the evening, the President of Iceland, Guðni Jóhannesson, invited some Icelandic government members (including Prime Minister Sigurður Jóhannsson and Foreign Minister Lilja Alfreðsdóttir) and a handful of scientists to his mansion for a dinner in honor of Ban Ki-moon, where we further discussed the dramatic climate changes in the Arctic and the progress of climate policy.
Link
The Icelandic newspaper Morgunbladid has a special issue for the Arctic Circle Assembly with the magnificent photos and two articles by Ragnar Axelsson and a series of interviews (e.g with Mike Mann from page 20 and with me from page 16).

Aren’t you all missing the elephant in the room – melting Arctic sea ice?
Although it is fresh it should float on top of the GIN Seas, but on the other hand it is cold so it should sink. Could it be that it is flowing below the surface and only emerging on the surface south of Greenland?
[Response: Arctic sea ice is not an elephant. It is a thin layer of 2-3 meters thickness – unlike the 3,000 meter thick Greenland Ice Sheet. I had an estimate of how much freshwater the Arctic sea ice melt could contribute, I think in my Nature papers of 1994 or 1995, and it wasn’t much.]
Probably the worse climate news this century
We passed peak carbon and we all missed it.
Check it out here :
http://www.ecoshock.org/2016/10/life-under-a-damaged-sky.html
or here : https://cosmosmagazine.com/climate/trees-and-plants-reached-peak-carbon-10-years-ago
Jack
Global warming disrupting Gulf Stream patterns, creating local cooling in the North Atlantic? Isn’t that the basic plot of The Day After Tomorrow ?
On the West coast of Ireland we are very reliant on the Gulf Stream for our moderate temperatures and yet we seem to be getting cooler summers.
Does the periodic opening of the Northern Sea Route (with the melting Arctic Summer Ice) disrupt the AMOC by allowing Gulf Stream waters to flow across the Arctic and into the Pacific instead? Wouldn’t that lower the return pressure that the AMOC represents?
Alastair B. McDonald
Let that elephant out!
Cold fresh water is less dense than warmer salty water.
toto
There’s way too much greenhouse cases to allow for cooling.
Northern Europe might not just fry as much as the rest of the world
https://www.sciencedaily.com/releases/2016/07/160711100940.htm?utm_source=dlvr.it&utm_medium=gplus
The really BIG issue is we passed Carbon Peak…
Jack
the null school sea temp anomaly simulation shows the process very well. The very warm gulf stream driven north east is smashing against the cold pool. Both are on similar thermo haline depths. Warm water sticks at the surface and so does sweeter cold water. My first impression years ago is that the fresh melt water from greenland is having a much larger influence in the AMOC slowdown than the official models seem to suggest.
A good analogy is that of a cold spanner in the works of the AMOC machine. I have been predicting to friends a cooling of european winters for the last few years.
We might have a saviour in the form of the growing antarctic ice sheets in the southern winter as this causes much more planckton to form on the undersurface of the forming ice sheet driving super saturated salty waters deep into the circum polar antarctic bottom waters which is the main driver of the Great Oceanic Conveyor and later on it’s travels the AMOC.
Thanks for the article. I’ve been watching this concerning process evolve for years and now have more knowledge to work with.
Thank you for sharing your stories! There are still some in America (like me), who care about this issue very much. You have courageous determination and please carry on with your message even louder than ever! The world needs you!
Has there been an assessment of the affect this might have on fisheries?
Very interesting. Thank you for taking the time to write all your posts. Posts here are like a bright light at night for a lot of topics.
On a different note concerning Arctic Sea Ice, would the measured or expected changes in the AMOC (or other currents) reduce or increase the amount of heat transported into the Arctic? The transported heat has a big influence on the amount of Sea Ice that melts. How do you expect changes in the AMOC to relate to Arctic Sea Ice extent?
Back to that elephant. Arctic sea ice has a profound effect on the exchange of heat between the sea and the atmosphere. Evaporation from the ocean surface both cools and salinifies the ocean surface and thereby bringing about the deep convection. The retreat of the Arctic sea ice in recent decades is moving the egdge of the sea ice away from the areas of deep water formation and I would have thought that this would contribute to a weakening of amoc south of Greenland. The exchange of heat between the air and sea surface is particularly intense close to the edge of the sea ice. Thoughts?
Interesting to note the Hansen et al. discovered a feedback mechanism related to the meltwater that predicts quite rapid sea level rise. http://www.atmos-chem-phys.net/16/3761/2016/
You suggest that the slowdown in the AMOC since 1930 may have an anthropogenic cause. Yet the 2016 paper by Haines (to which you link) suggests that an anthropogenic influence on the AMOC has not as yet been detected. In addition the UK Met Office, in their 2016 Nature Geoscience paper, suggest that whilst an anthropogenic impact on the AMOC cannot be excluded in the 21st Century, no such impact has been detected so far. To their credit, they recognise that there are difficulties even with their reanalysis and go on to state:
‘Although our technique has been very good at reproducing the Atlantic overturning circulation so far, more than a decade of observations would be required for a thorough validation. In particular, the reanalysis may be less good at capturing future changes that occur through different processes, for instance from changes in the dense waters that overflow the underwater ridge between Greenland, Iceland and Scotland into the Atlantic basin. The deep ocean (below 2000m) is still very poorly observed, so changes in the deep ocean that affect the circulation might not be properly represented.’
http://www.nature.com/ngeo/journal/v9/n7/full/ngeo2715.html
I still think there is a long way to go before the science community can identify, with confidence, an observed anthropogenic impact on the AMOC.
[Response: The commentary by Thomas Haine discusses three papers: one a model-data synthesis starting in 1989, the second looks at data from 1990, and third is the Böning et al. model simulation starting 1990 discussed in my article. I would agree that in the variability we see over such a short time scale we cannot detect any anthropogenic influence with any confidence. My main argument that speaks for an anthropogenic influence is the long-term downward trend since 1930 inferred from the SST data in the subpolar Atlantic, and the fact that climate models driven by anthropogenic forcing predict just such a relatively cold patch in this same area. That’s no proof, but it is evidence. -stefan]
Or we could all sleep soundly in our beds by going along with DMI’s conclusion:
https://www.thelocal.no/20160713/danish-researcher-explains-mysterious-atlantic-blue-blob
“Langen told DMI that the cold spot on the heat map was most likely to be caused by a simple weather variation. “It [the blue blob] emerged during a very cold winter in the area in 2014 and 2015, and the cold actually resulted in an increased mixing of surface water with the deeper levels. If the cause of this was meltwater, this mix would be thinned out” Langen explained that researchers were able to reconstruct the cooling of water in the area through energy calculations, making the weather theory the strongest explanation for the North Atlantic’s cold blob.
http://www.dmi.dk/nyheder/arkiv/nyheder-2016/juli/nordatlantens-blaa-plet-bare-vejr/
#15, Rick–I draw your attention to paragraph 3 of this post:
There is another similar persistent cold blob – about latitude 80S, longitude 0. Perhaps the only other one. Like the northern one, it is near the THC and near melting ice caps. Could be more than a coincidence.
Could there be a relation between the slowdown in this article and Antarctic intermediate water freshening coupled with decreasing Agulhas leakage as described in this discussion paper:
http://www.ocean-sci-discuss.net/os-2016-54/
sidd
Thank you for the excellent observations and analysis. It is refreshing to see people dedicated to the
pursuit of truth.
I have a question about another quasi-periodic ocean phenomenon, the Pacific Decadal Oscillation. A paper in PNAS titled Atmospheric controls on northeast Pacific temperature variability and change, 1900–2012, by James A. Johnston and Nathan J. Mantua, makes the following claim:
The PNAS paper is reported by the Climate Central site in an article titled Pacific Northwest Warming May Have Natural Roots. Climate Central reporter John Upton strives for balance, quoting Cliff Mass:
and also John Abatzoglou:
I’d love to see an analysis of the PNAS paper by RC contributors.
Thanks, Kevin. Gotcha!
I’ve tried to do a little reading around the subject – not a straightforward one.
Yes, the DMI (Danish Meteorological Institute) article I linked to does refer to a Cold Blob snapshot of “recent years” – then narrows it down by saying that it was caused by weather – the cold 2014-15 winter in the area. As, according to NOAA’s global temp maps, there has been a cold blob around in the N Atlantic pretty much since the beginning of ‘13, I can only assume DMI mean that the record cold Cold Blob (Jan – June ’15) was caused by weather – so we don’t have to worry, DMI reassures us, “the N Atlantic overturning circulation has not received it’s death blow and then weaken significantly during the foreseeable future”
The Böning et al 2016 paper referred to above (Greenland meltwater) is summerized in the DMI article: “…so far there has not been enough meltwater released to affect the overturning circulation significantly.”
The DMI article concludes: ”To sum up, new papers and earlier research show that the Cold Blob doesn’t look like being the first phase of a shutdown of the North East branch of the North Atlantic’s overturning circulation. DMI’s best assessment is that the Cold Blob is a relatively innocent natural variation, that possibly has an element of reinforcement by AGW.”
Maybe they’re referring to the record cold Cold Blob for a few months in ’15, or maybe they are in fact referring to the 1901-2013 Cold Blob, because Steffen Olsen writes most reassuringly for DMI (in ‘The Weather’ May 2016 – with Bogi Hansen) that the ‘Gulf Stream’ is in fact in two parts – North West and North East.
http://www.dmi.dk/fileadmin/user_upload/2016-nyheder/07/DAMS/Det_kolde_hul__fra_Vejret147.pdf
Now I’m paraphrasing Olsen here, but substance he says: ‘Your (NW) THC bit is fed by the Irminger Current, which unfortunately passes through the Cold Blob and in doing so may be weakening; maybe Rahmstorf et al are right and yours is weakening. But we’ve been measuring ours (NE) and it is in the rudest of health, in fact strengthening since the early 1990’s. Neither the century long Cold Blob or the 2015 one has weakened it. Better still, climate models show that ours is going to be ok at least until the end of the century.’
So according to DMI, over here ‘we’re alright Jack.’ Except I’m not entirely sure they’ve thought of everything.
Maas always takes the outlier position, has for year after year, and turns consistently in the same direction.
http://crosscut.com/2015/05/what-drought-washington-meteorologist-cliff-mass-vs-nearly-everyone/
Hank Roberts:
Hank, thanks, I’m aware of Mass’s history. AFAICT, he’s not an outright AGW-denier, but has positioned himself as an “honest broker”, making him attractive to balance-seeking journalists. I’m hoping for an analysis of the Johnson and Mantua paper by RealClimate authors, in case I need to revise my impression of Climate Central as a provider of accurate (as opposed to “balanced”) climate news for non-scientists.
http://www.woodfortrees.org/plot/nsidc-seaice-n/from:1979.16/every:12/offset:-8.4/plot/nsidc-seaice-n/from:1979.6/every:12 shows that the Arctic refreeze has increased by ~2 million km^2 from summer minimum to winter maximum over the last decade compared to the 80s. Assuming that the open water in summer gets reasonably mixed through a 50-200 meter layer, the meter+ layer of sea ice forms from water with a salt content of ~33psu. The cold, dense brine as it sinks from the bottom of the forming ice will mix and entrain additional cold water from just under the ice. I suspect the amount of additional 33psu surface waters entrained by the sinking brine is indicated by the nearly 35psu salinity of Arctic ocean water below about 300 meters depth; if the salt from each cubic meter of ice formed were added to approximately 15 cubic meters of water at 33psu, it would raise the salinity to near 35psu. If my guesstimates are anywhere near close, and I did the math right, the increase in seasonal min to max sea ice should have increased the thermohaline circulation by ~1Sv (as an annual average – the flow should follow the freeze up, only occuring in the fall). The real change is more complicated; the surface salinities vary over the Arctic, particularly over areas like the East Siberian shelf(which has seen a large portion of the annual melt/refreeze), and the entrainment dynamics will be different in its shallower water. A longer period of open water with larger areas will allow more mixing of the top 2-300 meters, which should increase the surface salinity prior to freeze up, possibly enhancing the effect. The water which replaces the export to the mid/deep THC will mostly come from the Atlantic Gulf Stream; increased flow of this water carries a lot of heat into the Arctic, so this would be a positive feedback(maybe this is one reason that models generally underpredict Arctic sea ice loss?). A seasonally ice free Arctic would only add another 4 million km*2 annual THC “pumping,” to ~3Sv? The increased seasonal THC variability could have an effect on Arctic ecosystems, as well as weather patterns connected with the Gulf Stream.
> Maas
good link above from Mal on Maas.
There he says
Yep. It took decades for the warming signal to emerge from natural variability, as Hansen predicted decades ago. And it sure did.
Shifting baselines make it easy to believe we’ll have peace in our time.
It’s always worth remembering that the other end of the AMOC involves two main factors: (1) vorticity-mixing of heat from surface waters into the deep abyssal ocean (which decreases density causing the Atlantic Deep Water to start rising above the colder Antarctic Bottom Water) and (2) the wind-driven upwelling around the Antarctic Circumpolar Current. In addition, bottom currents are very slow, as little as 1 mm/sec, so it can take a few hundred years for water sinking in the North Atlantic to get back to the surface, at best.
In addition, it’s hard to say how the wind-driven Atlantic gyre (whose western intensification drives the Gulf Stream’s transport of warm salty water northward) will affect a weakened northern end of the AMOC. It seems the thing to do would be to compare the Gulf Stream transport of warm salty water to the Greenland flux of fresh water due to warming and see how much freshening has actually taken place and then estimate how this will change in the future. Ultimately if the freshwater melt was a dominant (which seems hard to believe given the scale of the wind-driven gyre transport) factor, it would be entrained into the gyres at the surface and you’d see an overall freshening of North Atlantic surface waters to make the whole system more like the Pacific, which has a much weaker meridional overturning circulation.
Has the average wind speed over the anomaly’s area risen in the past few decades ?
Mariners who use the @earthwindmap as their primary real time geophysical reference often note high velocity- ( 90-120 kph) winds funnelled towards the anomaly from Greenland’s southeast cape.
Re #1 where I wrote
As A. Randomjack wrote cold fresh water is less dense warm salty water, but I was trying to account for the lack of an anomaly between the Arctic and the “blob”. But , of course there is no anomaly separating them since the water temperature was zero in the past and is still zero now. Thus the anomaly map is consistent with cold water from the Arctic flowing through the Fram Strait down into the blob.
Stephan,
I looked up your paper (Rammstorf, 1995) and you write “If a freshwater flux of 0.06Sv were to be obtained only by melting sea ice, the entire sea ice volume (2 – 3 * 10^13 m^3) would need to melt during a period of 10 to 15 years, a time span too short to cause an advective spin-down of the circulation.”
In 1995 the average melt was from 28 to 11 * 10^12 m^3) a melt of 17 Tm^3.
1 Sv per year is equal to 32 Tm^3, so even in 1995 nearly 0.6 Sv was flowing out of the Arctic, ten times the 0.06 proposed to halt the THC.
This year the melt was from 22 Tm^3 to 4 Tm^3 which means that the average amount of sea ice lost since 1995 is between 6 Tm^3 and 7 Tm^3, perhaps not enough to halt the THC, but perhaps enough to form a cold blob.
One query about the ice melt. Even without a melt the ice would form glaciers and the flow in to the sea to form icebergs which would melt when they reach warmer water in the gulf stream. so surely the fresh water would get in to the North Atlantic circulation without surface melting.
could anybody help?
If melting Greenland ice and this is added with high pressure meltwater underneath the glaciers: if all that water stays 1-3 Celsius it will not sink. Than a “cold blob” just where it is seems logic.
Other problem I see is: if the ice white surface of the north pole is diminishing, sunlight is not reflected like it was: water surface appearing there there will be “heated” and the 1- 3 Celsius (not sinking) H2O ……
Dutch thought that the pee of Willem Barents is now in the Indian Ocean.
Can we repeat something like that?